
We use cookies to ensure our website works properly and to personalise your experience. Cookies policy
Faculty, Department of Civil Engineering, Mailam Engineering College, Mailam
There are 15 groundwater samples were collected and examined for various physical and chemical parameters of groundwater such as TDS, pH, EC, Ca, Mg, Na, K, Cl, NO3, SO4, F in Kilpennathur block of Thiruvannamalai District. The groundwater samples are compared with the WHO standards. The quality of ground water in the study area is fresh to Brackish, slightly basic in nature, Salinity nature. According to USSL classification identifies groundwater mainly within C3–S1 and C4–S1 classes, indicating a high salinity hazard paired with a low sodium hazard. signifying moderate salinity and low sodium hazard, which are acceptable for irrigation under proper management and drainage conditions
Water is an pivotal natural resource, with the primary forms of surface runoff, including rivers, streams, ponds, and canals, and groundwater entering the earth. Globally, most residents depend on groundwater for drinking and domestic, agricultural, and industrial activities (Meghanad et al.,2025).Water is a most important natural resource, it is a essential human need and is a valuable national asset (Ramamoorthy et al 2018). In India, groundwater suites the drinking and domestic requirements of nearly 90% of the rural and 30% of the urban population (Bhunia 2020). There has been a tremendous increase in the demand for groundwater due to increase in population, advanced irrigation practices and industrial usages (Ramamoorthy and Rammohan,2015). Due to shortage of surface water, demand for groundwater resource has increased in many folds in recent times for drinking, irrigation, and industrial purposes in the world. It is estimated that approximately one third of the world’s population use groundwater for drinking (Nickson et al., 2005).Due to overexploitation of groundwater for domestic, irrigation and industrial purposes for the past few years the groundwater level has depleted forcefully it will adverse affect of groundwater quality and quantity. Groundwater quality mainly depends on numerous factors like lithology, rock water interaction, soil characteristics, sub-surface environment, manmade activity, climatical condition etc (Hem, 1989; Freeze and Cherry, 1979; Amadi et al. 1989; Appelo and Postma, 2005; Gholam and Azam, 2012; Ramamoorthy and Rammohan,2014). The significance of water quality in human health has recently attracted a great deal of interest (Ramamoorthy et al 2020). Once the groundwater is contaminated, it is not easy to restored by stopping the pollutants from the supply. This contamination is primarily caused by the discharge of untreated industrial effluents, agricultural septic tanks, domestic wastewater, and other sources (Siddiqui et al. 2015), causing waterborne diseases such as hepatitis, jaundice, typhoid, dysentery, and diarrhoea (Ayush Verma et al. 2023).
Study Area:
The study area Kilpennathur Block(Fig.1) falls in Thiruvanamalai district .The district is bounded on the North and West by Vellore district and on the South West by Dharmapuri district on the South Villupuram district and on the east by Kancheepuram district.
Fig:1 Study area Kilpennathur Block
MATERIALS AND METHODS:
Samples were collected from bore well and open wells and analysed for different parameters. All samples should be properly labelled with details of the locations, date and time of sampling. Water sample collected in the field were analyzed in the laboratory for the major cations and anions using the standard methods as suggested by the American Public Health Association(APHA, 1995)
RESULTS & DISCUSSION
pH
In the study area the pH ranges from 6.8 to 8, the groundwater samples in the study are permissible limit as per WHO standards. In the study area, the pH values for the water samples range from 6.8 to 8, Mostly neutral to slightly alkaline, suitable for drinking.
Electrical Conductivity(EC)
The electrical conductivity is the range of the concentration in the water which is being measured by using the Electrical conductivity meter (digitalized) is being used for the analyzed. The EC for the samples ranges from 910 μ mhos / cm to 2890μ mhos / cm. It attributes moderate to high salinity hazard.
Total dissolved solids (TDS)
The total dissolved solids in water are due to the presence of sodium, potassium, calcium, magnesium, manganese, carbonates, bicarbonates, chlorides, phosphate, organic matter, and other particles. The values of the total dissolved solids for all the groundwater samples vary between 394 and 1078 mg/l. Maximum was observed in location Sirunathur. All the samples are fall within the permissible limit.
|
Parameters |
WHO international standard (1984) |
No.of samples exceeding permissible limits |
|
|
Highest desirable limits |
Maximum permissible limits |
||
|
pH |
7- 8.5 |
9.2 |
Nil |
|
TDS(mg/l) |
500 |
1500 |
NIL |
|
EC(μS/cm) |
1000 |
1500 |
8 |
|
TH(mg/l) |
100 |
500 |
- |
|
Na(mg/l) |
- |
200 |
Nil |
|
Ca(mg/l) |
75 |
200 |
Nil |
|
Mg(mg/l) |
50 |
150 |
Nil |
|
Cl(mg/l) |
200 |
600 |
Nil |
|
SO4(mg/l) |
200 |
400 |
Nil |
|
NO3(mg/l) |
45 |
- |
Nil |
|
F(mg/l) |
- |
1.5 |
Nil |
Table:1 Ground Water Sample Compared With WHO Standard
Calcium(Ca)
In the study area the Ca value ranges from 32 to 126 mg/l. Higher calcium value observed in Kilpennathur location. The concentrations of Ca in the groundwater was mostly derived from leaching of carbonate minerals such as Calcite and Dolomite (Magesh et al.2012). The higher Ca content can cause ailments in humans and it was also not useful for domestic uses as it causes scaling (Sarath Prasanth et al., 2012).
Magnesium (Mg)
The magnesium values are recorded between 23 and 134 mg/l for the groundwater samples. The highest value of magnesium is observed at station Kilpennathur and the lowest value 23 mg/l of magnesium is observed at station (Kalpoodi). On comparison with the WHO standard value of magnesium, in this study it is confirmed that the magnesium value for all the groundwater sample is within the maximum permissible limit (150 mg/l).
Sodium (Na+)
The sodium concentration in ground water is varied between 49 to 101 mg/l in study area. The high variation of Na+ and Ca+ in the groundwater is attributed to cation exchange among minerals as well as irrigation return-flow.
Potassium (K+)
The concentration of potassium ranges from 35 to98 mg/l higher concentration of pottasium it attributed to agricultural activities and minerals like biotite and orthoclase.
Chloride (Cl)
The Chloride (Cl) concentration of groundwater can be attributed naturally due to the presence of chlorides from rocks, evaporates and juvenile water or by the contamination of groundwater through industrial waste and domestic sewages (Saha et al., 2019). The concentration of Cl ranges from 75 to 258 mg/l.
Fluoride
The value of fluoride for the groundwater samples is recorded between 0.1 and 0.6 mg/l. The maximum allowed limit of fluoride according to WHO is 1.0 mg/l. The fluoride values for all the groundwater samples are within the permissible limit.
Nitrate (NO3)
The nitrate concentration ranges from 7 to24 mg/l. The higher value of nitrate is the most common indication of agriculture impact on groundwater quality. Nitrate values for the village within the permissible limits according to the WHO standard (1984) for the irrigation water(50mg/l).
Sulphate(SO4)
The Sulphate concentration ranges from 9 to 360 mg/l. The higher concentration observed in the location Nariyamangalam. The occurrence of SO4 in groundwater can be resulted from the oxidation of sulfur from the surrounding igneous rocks in the region (Saha et al.2019). The lower concentration of Sulphate in groundwater was less affected by anthropogenic sources especially industries (Mostafa et al. 2017).
Groundwater Classification for Irrigation
USSL Diagram
The values of EC and SAR are related and designed on USSL diagram. It directs the sign of salinity and alkali hazards. Suitability of water for irrigation purpose has been classified as four classes (C1-C4) has is shown in figure 2.
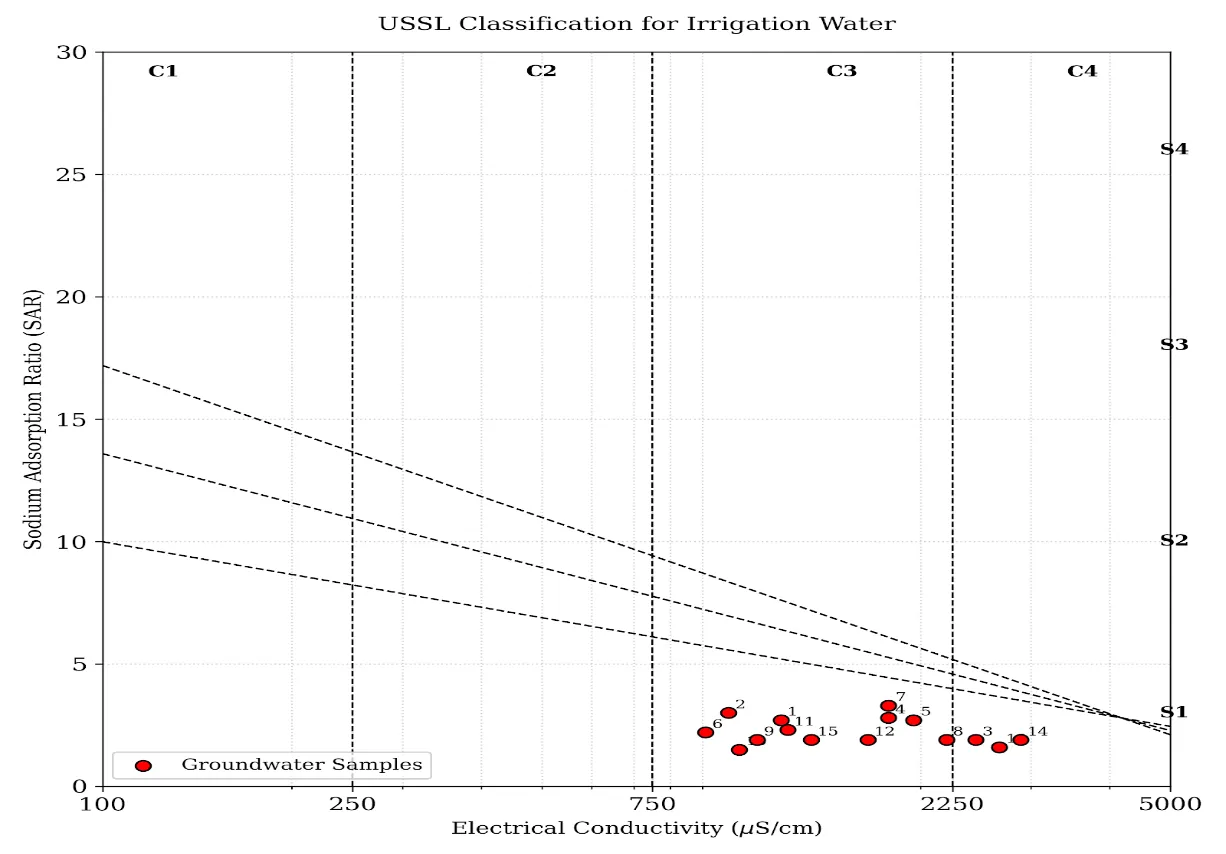
Fig 2 Shows USSL Plot of Study area
In the present study, the EC values of groundwater samples range from 910 to 2890 µS/cm, while SAR values vary between 1.5 and 3.3.
Sodium Hazard (SAR)
All the evaluated groundwater samples fall within the S1 category (low sodium hazard), as SAR values are less than 10. This indicates that sodium concentration in the water is not high enough to unfavorably affect soil permeability or structure. Hence, the groundwater is nontoxic with respect to sodium hazard and does not pose a risk of soil sodicity.
Salinity Hazard (EC)
Based on EC values, groundwater samples are distributed across different salinity classes:
The USSL diagram reveals that most samples belong to C3–S1 (High salinity – Low sodium hazard) and C4–S1 (Very high salinity – Low sodium hazard)( Swati Pawar and Ravindra Bhagat,2026).This indicates that while sodium-related hazards are minimal, salinity is the major limiting factor affecting groundwater suitability.
CONCLUSION
A detailed study of groundwater quality of the study area (Kilpennathur block) revealed that, Overall evaluation of the samples shows that the groundwater in the area is of fresh to Brackish, slightly basic in nature, Salinity nature. According to USSL most groundwater samples fall in “C3–S1” classes, making them moderately suitable for irrigation purposes, but it is poor for drinking water purposes, do not drink directly, it requires Reverse Osmosis (RO) filtration or desalination treatment to lower the TDS and Magnesium levels before human consumption. For Irrigation purposes. It is concluded that the groundwater in Kilpennathur block is suitable for drinking and irrigation purposes, with the more care taken over it to avoid overexploitation of groundwater. Proper irrigation management, gypsum treatment, and periodic quality monitoring are recommended to maintain long-term soil fertility.
REFERENCES

P. Ramamoorthy*, D. Saravanan, C. Mala, P. Easwary, A Comprehensive Assessment Of Groundwater Quality For Drinking And Irrigation Purposes In Kilpennathur Block, Thiruvannamalai District, Tamil Nadu, India, Int. J. Sci. R. Tech., 2026, 3 (6), 941-946. https://doi.org/10.5281/zenodo.20702490
 10.5281/zenodo.20702490