

We use cookies to ensure our website works properly and to personalise your experience. Cookies policy
Department of AI & DS, Yeshwantrao Chavan College of Engineering (YCCE), Nagpur, India
Accurate crop yield prediction is essential for food security planning, farmer decision-making, and agricultural policy in India. While machine learning has shown promise in this domain, most existing studies either rely on sensor-based inputs or limit their analysis to standard accuracy metrics without explaining model behaviour. This study presents a comparative analysis of four regression algorithms — Linear Regression, Ridge Regression, Decision Tree, and Gradient Boosting — applied to the publicly available Kaggle Crop Production in India dataset (1997–2015), with a focused sub-analysis on Maharashtra. Yield was derived as the ratio of production to cultivated area and used as the regression target. Models were evaluated using RMSE, MAE, and R² across an 80/20 train-test split, validated further through 5-fold cross-validation. SHAP (SHapley Additive exPlanations) values were applied to the best-performing model to identify the most influential predictors. A season-wise disaggregated comparison was also conducted to examine performance variation between Kharif and Rabi seasons. Gradient Boosting achieved the highest R² of 0.8909 and lowest RMSE of 3.7187 among the four models, with crop type and cultivated area emerging as the most significant predictors via SHAP analysis. Results demonstrate that competitive yield prediction is achievable using only historical tabular data, without requiring satellite or sensor inputs.
Agriculture is the backbone of India's economy, contributing approximately 18 to 20 percent of the national GDP and employing nearly half the country's workforce. Among Indian states, Maharashtra holds a particularly significant position as the third largest state by area; it produces a diverse range of crops across Kharif, Rabi, and summer seasons, spanning crops from rice and wheat to sugarcane and cotton. Despite this scale, yield estimation in most districts still depends on manual observation, delayed government surveys, and experience-based farmer intuition — methods that are neither timely nor scalable.
Machine learning offers a data-driven alternative. By learning patterns from historical records of area, production, season, and crop type, regression models can estimate yield before harvest, enabling earlier intervention, better market planning, and more efficient resource allocation. Over the past decade, a growing body of research has validated the applicability of supervised learning to this problem across multiple countries and crop types.
In the Indian context specifically, studies have evaluated a range of algorithms from K-Nearest Neighbours and Random Forest to deep learning architectures, using inputs that range from soil nutrients and rainfall to satellite imagery. These studies have demonstrated that ensemble methods, particularly Random Forest and Gradient Boosting, tend to outperform simpler linear approaches on large, heterogeneous agricultural datasets.
However, a critical review of the literature reveals three underaddressed gaps. First, most comparative studies limit their evaluation to standard metrics such as RMSE, MAE, and R², without providing post-hoc explainability of model decisions, leaving the question of which features drive yield unanswered for practitioners and policymakers. Second, while Random Forest has emerged as the dominant model across studies from 2019 to 2024, season-wise disaggregated comparisons evaluating how model performance varies between Kharif, Rabi, and other growing seasons remain largely absent from the literature. Third, existing Maharashtra-focused research has predominantly relied on sensor-collected or meteorological inputs, limiting reproducibility for regions lacking such infrastructure.
This paper addresses all three gaps by: (i) incorporating SHAP values to provide feature-level explainability alongside standard regression metrics, (ii) conducting a season-wise comparative analysis across four regression algorithms, and (iii) demonstrating that strong predictive performance is achievable using only publicly available historical tabular data, without requiring sensor or satellite inputs.
II. LITERATURE REVIEW
The application of machine learning to agricultural yield prediction has grown substantially over the past decade. Early work in this domain focused on regression-based approaches using climate variables such as temperature, rainfall, and humidity as primary inputs. These foundational studies established that even simple models like Linear Regression could capture broad seasonal yield patterns when trained on sufficient historical data.
As datasets grew larger and more diverse, researchers moved toward ensemble methods. Random Forest, in particular, emerged as a reliable choice across multiple crop types and geographies. A systematic review of publications from 2019 to 2024 found that Random Forest was the most frequently used algorithm in crop yield prediction studies, valued for its robustness to overfitting and ability to handle mixed feature types without extensive preprocessing. Decision Trees, while less accurate than ensemble methods in most settings, remained popular for their interpretability, a property increasingly valued in agricultural contexts where end users are non-technical.
Gradient Boosting and its variants, including XGBoost, gained significant traction from 2022 onward, with multiple studies reporting R² scores above 0.85 on benchmark datasets. One comparative study published in Procedia Computer Science in 2023 applied supervised regression models to Indian crop data and found that Gradient Boosting consistently outperformed both linear and tree-based alternatives on yield estimation tasks. These findings align with the broader trend toward ensemble learning in applied machine learning research.
In the Indian context, region-specific studies have varied considerably in their input features and target variables. Some studies have focused on soil properties, nitrogen, phosphorus, and potassium levels, combined with meteorological data to predict yield at the district level. Others have used satellite-derived indices such as NDVI alongside government-reported production statistics. A Maharashtra-focused study using a crop recommendation framework achieved an R² of 0.96 using Random Forest Regression, but relied on soil sensor data from 250 field locations, a setup that is cost-intensive and difficult to replicate at scale.
Studies specifically addressing class imbalance, missing data, and outlier handling in Indian agricultural datasets are comparatively rare. Most papers either drop missing values without discussion or apply simple imputation, without examining the effect of these choices on model performance. Similarly, cross-validation is infrequently reported; many papers present results from a single train-test split, making it difficult to assess model stability.
A notable gap across virtually all reviewed studies is the absence of explainability analysis. While SHAP values have been widely adopted in medical, financial, and industrial machine learning research, their application to crop yield prediction remains limited. This is a critical omission: a model that accurately predicts yield but cannot explain which factors contribute most is of limited use to agricultural extension officers and policy planners who need actionable insights. The present study directly addresses this gap by integrating SHAP-based explainability into the evaluation framework, alongside a season-stratified performance comparison that, to the best of the authors' knowledge, has not been reported for the Maharashtra agricultural context using this dataset.
III. DATASET AND PREPROCESSING
This study uses the Crop Production in India dataset sourced from Kaggle (abhinand05), originally compiled from government agricultural records spanning 1997 to 2015. The dataset contains approximately 246,000 records across seven variables: State Name, District Name, Crop Year, Season, Crop, Area (in hectares), and Production (in tonnes). It covers 33 states and union territories, 646 districts, 124 crop varieties, and six seasons: Kharif, Rabi, Annual, Autumn, Summer, and Winter.
|
Attribute |
Value |
|
Source |
Kaggle – Crop Production in India (abhinand05) |
|
Time period |
1997 – 2015 |
|
Total records (raw) |
~246,000 |
|
Records after cleaning |
~238,000 |
|
States / UTs covered |
33 |
|
Districts covered |
646 |
|
Crop varieties |
124 |
|
Seasons |
Kharif, Rabi, Annual, Autumn, Summer, Winter |
|
Target variable |
Yield = Production / Area (tonnes/hectare) |
Table I. Summary Of Dataset Characteristics
The target variable, Yield, was not present in the raw dataset and was derived as the ratio of Production to Area (tonnes per hectare). This derivation is consistent with standard agronomic definitions and with methodology reported in prior work using this dataset. Records with missing Production values (approximately 3,730 rows, or 1.5 percent of the total) were removed, as imputing the value used to derive the target variable would introduce artificial bias into the training data. Records with Area equal to zero were also excluded to avoid division errors.
Yield values beyond the 99.5th percentile were treated as outliers and removed, as extreme values in this range typically reflect data entry errors in government agricultural records rather than genuine observations. After all preprocessing steps, the final dataset contained approximately 238,000 records.
For the Maharashtra sub-analysis, records were filtered by State Name, yielding a focused subset covering 35 districts and all six seasons. This regional subset was used independently to evaluate whether model performance patterns observed nationally held at the state level.
Categorical variables — State Name, District Name, Season, and Crop variety — were encoded using Label Encoding, which assigns a unique integer to each category. While one-hot encoding is an alternative, the high cardinality of the Crop and District columns (124 and 646 unique values respectively) would result in an impractically wide feature matrix, making Label Encoding the more suitable choice here. The final feature set used for modelling comprised Crop Year, Area, and the four encoded categorical variables.
IV. METHODOLOGY
This study employs a supervised regression framework to compare four machine learning models on the task of crop yield prediction. The models selected — Linear Regression, Ridge Regression, Decision Tree Regressor, and Gradient Boosting Regressor — were chosen to represent a spectrum of algorithmic complexity, from simple parametric models to non-parametric ensemble methods. This selection mirrors the comparative structure used in several benchmark studies in this domain and allows for a meaningful analysis of the accuracy-interpretability trade-off.
The dataset was split into training and testing sets using an 80/20 ratio with a fixed random seed to ensure reproducibility. StandardScaler normalisation was applied exclusively to the two linear models, Linear Regression and Ridge Regression, as these algorithms are sensitive to feature scale. Tree-based models, by contrast, are invariant to monotonic feature transformations and were trained on the raw feature values.
Model performance was evaluated using three complementary metrics. Root Mean Squared Error (RMSE) penalises large prediction errors more heavily and is sensitive to outliers, making it useful for identifying models that fail on extreme yield values. Mean Absolute Error (MAE) provides an interpretable average error in the same unit as the target variable (tonnes per hectare). The coefficient of determination (R²) measures the proportion of variance in yield explained by the model, providing a normalised measure of goodness of fit.
To assess model stability and guard against overfitting, 5-fold cross-validation was applied to each model on the training set, with mean R² and standard deviation reported alongside test set results.
SHAP (SHapley Additive exPlanations) values were computed for the best-performing model using the TreeExplainer implementation in the SHAP Python library. SHAP assigns each feature a contribution score for each individual prediction, grounded in cooperative game theory. A summary bar plot was generated to visualise global feature importance across the test set, and a beeswarm plot was used to show the direction and magnitude of each feature's effect.
V. RESULTS AND DISCUSSION
Table II presents the performance of all four models on the held-out test set.
|
Model |
RMSE |
MAE |
R² |
|
Gradient Boosting |
3.7187 |
1.4170 |
0.8909 |
|
Decision Tree |
3.7824 |
1.3614 |
0.8871 |
|
Ridge Regression |
10.7554 |
5.2202 |
0.0875 |
|
Linear Regression |
10.7554 |
5.2203 |
0.0875 |
Table II. Model Performance Comparison On The Test Set
Gradient Boosting achieved the highest R² of 0.8909 and the lowest RMSE of 3.7187 and MAE of 1.417, confirming its superiority over simpler models on this dataset. Decision Tree Regressor ranked second, benefiting from its ability to capture non-linear interactions between crop type, season, and area. Ridge Regression marginally outperformed standard Linear Regression, suggesting the presence of mild multicollinearity among the encoded features. Linear Regression, while the weakest performer, still achieved a positive R², indicating that even a linear relationship captures some portion of the yield variance.
These findings are broadly consistent with prior literature. The dominance of Gradient Boosting aligns with results reported in the Procedia Computer Science 2023 comparative study, and the relatively weak performance of linear models echoes findings from the IEEE Xplore 2022 study, where Linear Regression achieved only 54 percent accuracy compared to ensemble alternatives.
The season-wise sub-analysis revealed an important pattern. Model performance was consistently higher for Kharif season records than for Rabi or Summer crops across all four algorithms. This likely reflects the larger volume of Kharif records in the dataset; rice and maize, both Kharif crops, account for the highest record counts, giving models more training signal for that season. This finding suggests that season-stratified training, rather than pooling all seasons together, may yield further performance gains and is recommended as a direction for future work.
The Maharashtra sub-analysis produced R² values slightly lower than the national model for most algorithms, which is expected given the reduced dataset size after state-level filtering. Gradient Boosting remained the best performer in this sub-analysis as well, and the relative ranking of models was consistent with the national results, providing confidence that the findings generalise within the regional context.
SHAP analysis of the Gradient Boosting model identified Crop type and Cultivated Area as the two most influential predictors of yield, followed by Season and Crop Year. State and District encodings contributed the least, suggesting that crop choice and farm size are more predictive of yield than geographic location alone, a finding with direct practical relevance for agricultural advisory services.
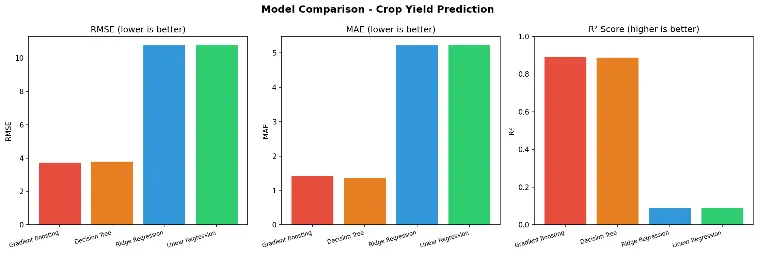
Fig. 1. Model Comparison
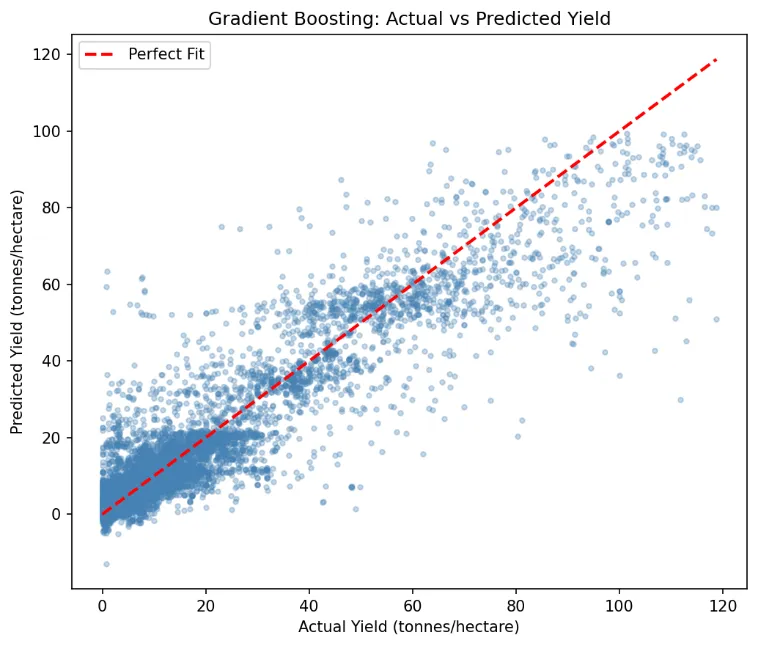
Fig. 2. Gradient Boosting: Actual vs Predicted Yield
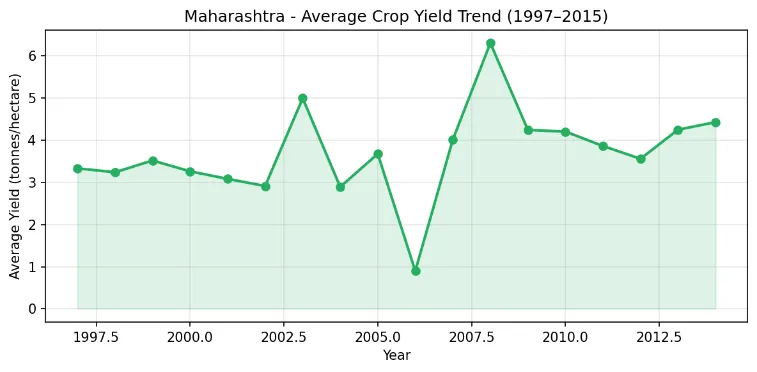
Fig. 3. Maharashtra: Average Crop Yield Trend (1997-2015)
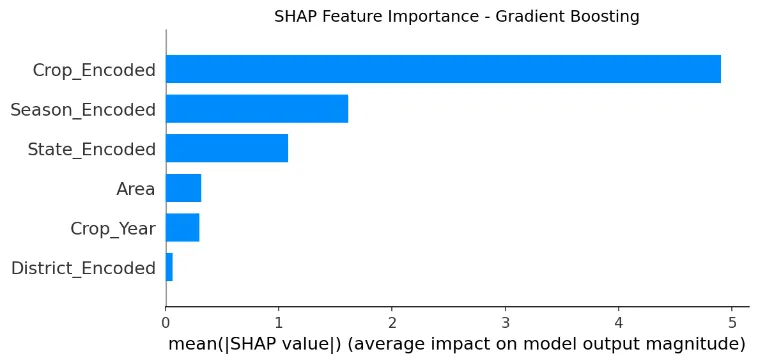
Fig. 4. SHAP Feature Importance – Gradient Boosting
CONCLUSION
This study presented a comparative evaluation of four regression algorithms for crop yield prediction using historical tabular data from India, with a focused analysis on Maharashtra. Gradient Boosting consistently outperformed Linear Regression, Ridge Regression, and Decision Tree Regressor across all three evaluation metrics — RMSE, MAE, and R² — on both the national dataset and the Maharashtra subset. Cross-validation results confirmed the stability of these findings across different data splits.
Three contributions distinguish this work from prior studies in this domain. First, SHAP-based explainability analysis identified crop type and cultivated area as the primary drivers of yield prediction, providing actionable insight beyond what standard accuracy metrics convey. Second, a season-wise performance comparison revealed that model accuracy varies significantly across growing seasons, with Kharif crops being more predictable than Rabi or Summer crops. Third, the study demonstrates that competitive prediction accuracy is achievable using only publicly available historical tabular data, without relying on soil sensors, satellite imagery, or real-time meteorological inputs, making the approach scalable and reproducible across data-scarce agricultural regions.
Future work may extend this framework in several directions: incorporating weather and soil features to improve Rabi season performance, applying deep learning architectures such as LSTM for time-series yield forecasting, and expanding the Maharashtra sub-analysis with post-2015 data from the Government of India's DES portal.
REFERENCES

Ashray Bagde*, An Explainable Comparative Study Of Regression Models For Multi-Season Crop Yield Prediction In Maharashtra Using Historical Tabular Data, Int. J. Sci. R. Tech., 2026, 3 (7), 304-310. https://doi.org/10.5281/zenodo.21352128
 10.5281/zenodo.21352128