
We use cookies to ensure our website works properly and to personalise your experience. Cookies policy
Department of Computer Science Engineering, Inderprastha Engineering College, Ghaziabad, New Delhi, India
Ocular Melanoma is the most common primary eye tumor among adults in United States with around 2500 new cases reported each year. With the increasing number of cases and the aggressive growth of disease, the need arises to cut down the time spent on analyzing hundreds to thousands of ultrasound scans, MRI and CT scans images each day. The proposed enhanced detection and retrieval of ocular melanoma using pattern recognition involves three main steps: feature detection and feature extraction and similarity measures. The proposed technique uses integrated features for feature detection and retrieval of ocular melanoma. The texture features are extracted using Gray level co-occurrence matrix (GLCM) technique. And the color features are extracted using dispersion methods. The distance between the query image features and the features of database images is computed using Euclidean distance. Precision and Recall are used for analysing the performance of the algorithm. Precision is the measure of ability of a system to present all the relevant items and Recall is defined as the ability to present only relevant items.
In recent days, the world is witnesses an unparalleled growth in the importance, number and availability of images in all walks of life. The real engine of imaging revolution is the computer which brings with it a range of techniques for digital image capture, processing, storage and transmission. When the captured images are computerised, the art of imaging becomes affordable and it could be applied in the areas such as medicine, engineering and architecture which were traditionally depending on images for communication. Moreover, the rapid development in digital technologies and the proliferation of World Wide Web have enabled the users to access data from a variety of media, resulting in a further massive stimulus to the exploitation of digital images.
In recent years, as far as technological advances are concerned apart from accessing data, there has been significant effort put into understanding and analysing the data. Analysing the data involves inspecting, cleaning, transforming, and modelling data with the goal of discovering useful information, informing conclusions, predicting similarities, personalisation and supporting decision-making. Pattern recognition (Gonzalez et al., 2004) is?a data analysis method used to recognize the patterns and regularities in data automatically. The data can be anything from text and images to sounds or other definable qualities. One of the main aspects of pattern recognition is feature analysis in Image Processing.?The approach relies on the notion that perceive different features of each object and use these features with increasing complexity to identify and categorize objects in image. The type of features identified and categorised depends on the applications.
Ocular Melanoma (Kellog eye centre, 2009) occurs when the melanocytes cell in the pigmented part of the eye are cancerous, the disease is called ocular melanoma. According to the survey conducted by Ocular Melanoma Foundation (2023), about 6 people per million per year are diagnosed with ocular melanoma. In 2022, nearly 63,000 persons were diagnosed with melanoma and the reported numbers according to the American Cancer Society (ACS)?for 2023 are even higher with?77,000 diagnosis with increased morbidity and mortality rates. ACS also estimates that the risk of developing invasive melanoma is 1 in 41 and 1 in 61 for men and women respectively. This averages out to approximately 1 in 50 chance of developing melanoma throughout the lifetime.
??????? Ocular melanoma is diagnosed mainly by its characteristics (National Cancer Institute 2013). Cancerous melanocytes usually vary in shades of black, brown and tan. Shades of white, gray, red, pink, yellow or blue are also seen. In malignant melanoma, the tumors are either cysts or nevi and the texture of the cysts is mostly hard or lumpy. Thus, color and texture features of tumor greatly aids the physicians in diagonising as the entire procedure of life saving is often dependent on the images produced. Based on the features, the feature descriptor of an image gets defined. Feature descriptor is the representation of an image which enables efficient search in image database based on the features extracted. Today, the total number of images on the web repositories increases in an exponential manner and the task of searching and retrieving a particular image on this huge collection of image database is easier said than performed. To manage and search this huge collection effectively and efficiently creates the necessity for constructing an intelligent image retrieval system.
LITERATURE SURVEY
CBIR is used to search the relevant images in an image database for a specified query image (Jenni et al.,?2015) (Ali et al.,?2020). Though its fully automated, it still suffers from semantic gap, which is a gap between the low level features and high level concepts in the images (Bai et al.,?2018), leading to irrelevant image retrieval. Over the past three decades, this gap has been the focus of numerous studies (Shrivastava & Tyagi,?2017).
The features are the foundation for CBIR. Generally, features are categorized into global features and local features depending on the feature extraction methods. Global features like color, texture, shape, and spatial information are used to represent an image. Though the technique is faster in terms of computation and feature extraction (Datta et al.,?2008), it still suffers to differentiate between the object and background in the image (Halawani et al.,?2006). As compared to the global features, local features are more appropriate for image retrieval , and image recognitions (Halawani et al.,?2006).
Object detection is mainly involved with identifying the objects and its location in image (Mittal et al.,2019). And classification is a sub-task of object detection (Mittal et al.,2019). Local features are defined as the key points in an image, corners, blobs and edges. They are robust to scale, rotation, translation and changes to backgrounds (Halawani et al.,2006).
(Ashraf et al. 2020 methodology for CBIR system was based on the fusion of low-level features (texture and color). Color features were extracted in HSV color space based on color moments and texture features were extracted using DWT and Gabor wavelet. This technique had a larger feature vector of dimension 1x 250. Because of such large dimension of feature vector, it takes a longer time for searching and comparing also the methodology lacks texture and spatial information
PROPOSED ENHANCED DETECTION AND RETRIEVAL OF OCULAR MELANOMA USING PATTERN RECOGNITION
The main aim of the proposed technique is to develop a simple and efficient content-based image retrieval with reduced feature dimension and reduced computation time. The proposed enhanced detection and retrieval of ocular melanoma using pattern recognition involves three main steps: feature detection and feature extraction and similarity measures. Figure 1 shows the block diagram of proposed enhanced detection and retrieval of ocular melanoma using pattern recognition.
? ? ? ?
? ? ? ? ? ? 
? ? ? ?
Figure 1. Proposed enhanced detection and retrieval of ocular melanoma using pattern recognition
The color features of an image such as mean, standard deviation and object area and the texture features of an image such as energy, entropy, homogeneity and contrast are extracted using dispersion method and Gray Level Co-occurrence Matrix (GLCM) technique respectively.
1. Object Segmentation
The tumors appear as bright regions in the eye, which are to be separated from the background. In order to identify the bright objects, the thresholding using local statistics has been used. For a given image, binarization is done using simple thresholding and it is given by,
binx,y= 1 if Ix,y?T0 if Ix,y ??????? ?????? (1)
where,??????? I (x,y) is the segmented region
????????????????? bin (x,y) is the resulting binary image
????????????????? T is the threshold value.
????????????????? The infected tumor cells are segmented automatically by selecting a threshold value using mean of pixel intensity (?) and standard deviation (?) of segmented region.
????????????????? T = ? + ? *? + ? * k? ????????? ?????? (2)
where,??????? k represents the total number of segmented objects ? is a constant which varies from 0 to 1 Very small tumor structure becomes more visible using this method of thresholding as suspicious regions belong to same texture, while surrounding tissues belong to others. ?After segmenting the tumor from binary image, the original RGB color is represented on the segmented region. Figure 2 shows the input image and segmented tumor. From the segmented region, color and texture features are extracted.
? ? ? ?
? ? ? ? ? ? 
? ? ? ?
?Figure 2. Segmenting region of interest from input image
2. Color Feature Extraction
?The proposed technique extracts color features from the segmented region by using dispersion measures in terms of mean, standard deviation and area.
Mean
Average intensity value of the segmented region is computed using,
???????????????????????????? E=i=1N1NPi ???????????????????????????????????? ?????? (3)
where, ?????? Pi is the pixel intensity in the segmented region of interest N is the total number of pixels in the segmented region.
Standard deviation
Standard deviation determines the variation of image pixels from its mean which shows the contrast of an image.
??????????????? ?= 1Ni=1N(Pi-E)2) ?????????????????????????????????? ??????????? ???? ???????????????(4)
where,??????? ? is the standard deviation and its value ranges from 0 to 1. E is the average intensity value of segmented region of interest
Area
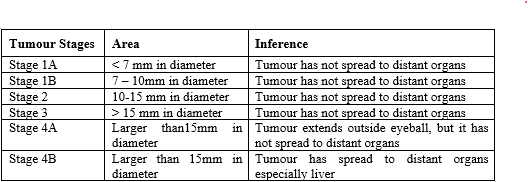
Area determines the total number of pixels in the segmented region. To convert area in pixels to area in square centimetre, the length and width of segmented object is initially converted to pixel unit which is later converted to cm (1 pixel = 0.0264 cm) (Gonzalez et al 2004).
?Area (cm2) = Area in pixels * 0.0264 ?????????????????????????????????????? ???????(5)
?Based on the area of cysts, the tumors are considered as either curable or non curable. And based on the size of the tumor, different stages are defined by Kellog Eye Centre (2009) as shown in Table 1.
Table 1. Different stages of Tumor
? ? ? ?
? ? ? ? ? ? 
? ? ? ?
After extracting color features from the segmented region, texture features are extracted which is explained in the following section.
3. Texture Feature Extraction
Texture features are extracted from the segmented region of interest using Gray Level Co-occurrence Matrix (GLCM). GLCM is a commonly used statistical approach to extract texture features from the region of interest. The extraction of specific texture features from the region of interest is achieved primarily by modeling texture as a two dimensional gray level variation. This two dimensional array is called GLCM.
?GLCM is also called Gray tone spatial dependency matrix. It is a tabulation of how often different combinations of pixel intensity values (gray levels) with specific displacement and orientation occur in an image.
Algorithm
GLi,j= x=1Ny=1N1 , if Ix,y=i and Ix+?x,y+?y=j0 otherwise ? ????????????????????
??????????????????????????????? ??????????????????????????????????????????????????(6)
where GL(i, j) is the Gray level co-occurrence matrix ?N?is the?number of gray levels.
?x, ?y is the row and column offset
???????? GL = GL + GLT??????????????????? ?????????????????????????????????????????????????????????????????????????????????????????????????????????????????? ????????????????????????????????????????????????????????????????????(7)
???????? P(i,j)=GL(i,j)ij=1N-1GL(i,j) ????????????????????????????????????????????????? ???? ???????????????????????????????????????????(8)
From the computed final GLCM, various texture properties such as energy, entropy, contrast and homogeneity are calculated to determine the texture of segmented region.
Energy
Energy also called angular second moment is a measure of textural uniformity of an image and is given by,
?????????????????  Energy =i=0N-1j=0N-1P(i,j)2
 ??????????????????????? ?????????????????????????????????????????? ???????? ???????(9)
where, P(i, j) is the normalized symmetrical GLCM and N is the number of gray levels in an image. If a homogenous image contains few dominant gray tone transitions, then the P matrix for this image will include fewer entries of larger magnitude resulting in large value for the energy feature. In contrast, if the P matrix contains large number of small entries, the energy feature will have smaller value. Thus the energy reaches maximum, when the gray pixels distributions are either constant or a periodic form.
Entropy
Entropy measures the randomness of gray level distribution. It is inversely proportional to GLCM energy and is given by,
Entropy = -i=0N-1j=0N-1P(i,j)log?P(i,j) ????????????????????????????????? ????
  (10)
(10)
Entropy is minimum for homogenous images whereas, for heterogeneous images the GLCM elements will have smaller value which implies large entropy.
Contrast
Contrast determines the dynamic range of gray levels in an image. It is a measure of the intensity or gray level variations between the reference pixel and its neighbour. It is also known as inertia or sum of square variance.
Contrast = i=0N-1j=0N-1|i-j|2Pi,j ????????????????????????????????????????? ????
  (11)
(11)
Gadkari (2004) stated that Energy and Contrast are considered as the most significant and efficient parameters in terms of visual assessment and computational load to discriminate different textural patterns.
Homogeneity
Homogeneity is also known as Inverse difference moment. It measures the distribution closeness of GLCM elements to the GLCM diagonal. It is the local homogeneity of an image.
Homogeneity = i=0N-1j=0N-1P(i,j)1+i-j2 ?????????????????????????????????????????? ???? (12)
For a heterogeneous image area, the inverse difference moment gets only a small contribution and hence, the value of homogeneity is low for heterogeneous images and high for homogenous images. GLCM approach is particularly suitable for describing micro-textures, whose texture primitives are small.
Thus, the feature vector (FV) of the proposed technique on enhanced detection and retrieval of ocular melanoma using pattern recognition is given by,
FVcolor = [Mean, Standard_deviation, Area]
FVtexture =[Energy, Entropy, Contrast, Homogeneity]
where, FVIntegrated = [FVcolor, FVtexture]
The feature vector of query image is compared with the feature vector of target image in database using Euclidean distance. The calculated distances are sorted in ascending order so that images with minimum distance are considered as better match to the query image and images with maximum distance are considered as least match to the query image.
EXPERIMENTAL RESULTS
The proposed enhanced detection and retrieval of ocular melanoma using pattern recognition has been implemented using MATLAB R2024b Image Processing Toolbox. The proposed technique is tested with Ocular melanoma image dataset created by Damato & Coupland (2012) with the motive to help practitioners diagnose ocular melanoma. The dataset is focused on adult tumors alone and it includes images which were decade old as well as recent images.
1. Performance of Proposed Technique on Ocular Melanoma Dataset
The performance of the proposed technique is tested on the application, ocular melanoma. Images in ocular melanoma dataset consist of three categories of images namely iris melanoma, choroid melanoma and conjunctiva melanoma with each category comprising 100 images. Each image in this dataset is manually verified and categorised by physicians during routine medical diagnosis. The images are downloaded from the webpage of Royal Liverpool University Hospital, UK. All images are high resolution images and are resized to a standard size of 256 x 384 for experimental purpose.
2. Retrieval performance using individual and integrated image features on Ocular Melanoma dataset
Table 2 shows the top five retrieved results of proposed technique with solely color features, texture features and with a combination of color and texture features on ocular melanoma image dataset using Euclidean distance (Rana et al., 2019).
Table 2. Top five retrieval results of proposed technique with different features using Euclidean distance on ocular melanoma dataset
? ? ? ?
? ? ? ? ? ? 
? ? ? ?
The Euclidean distance with texture features are relatively small as compared with other features because, the texture features are calculated from normalized GLCM matrix. The correlation of retrieved images with the query image is purely based on the type of feature selected. From the retrieval results of each ocular melanoma image category shown in Table 2, it is observed that integrated image features give better retrieval results compared to using single image feature for retrieval. It is also observed that, the proposed image features not only retrieve melanoma images with patients having similar diagnoses but also images with visual similarity but different diagnoses.
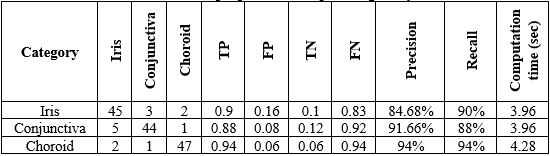
3. Retrieval performance of proposed technique on Ocular Melanoma dataset using confusion matrix
The confusion matrix is constructed by taking the top 50 retrieval results for query image from each category of ocular melanoma image dataset. From the confusion matrix, the four outcomes namely: True Positive (TP), True Negative (TN), False Positive (FP) and False Negative (FN) are computed and the performance parameters such as precision and recall are calculated.
Tables 3, 4 and 5 show the confusion matrix of proposed technique using solely color features, texture features and using integrated color and texture features respectively.
Table 3.Confusion matrix of proposed technique using solely color features
? ? ? ?
? ? ? ? ? ? 
? ? ? ?
Table 4.Confusion matrix of proposed technique using solely texture features
? ? ? ?
? ? ? ? ? ? 
? ? ? ?
Table 5.Confusion matrix of proposed technique using integrated color and texture features
? ? ? ?
? ? ? ? ? ? 
? ? ? ?
From the tabulated values given in Table 3, 4 and 5, it is shown that the performance of proposed technique is better for integrated image features compared to using solely color features and texture features.Thus, the average precision and recall of proposed technique using integrated image features is 93.25 % and 93.33% respectively. Also the average computation time is 4.15 seconds.
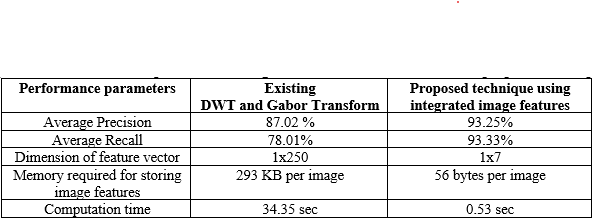
4. Retrieval performance of proposed technique on comparison with the existing technique
To further show the effectiveness in retrieval, the proposed technique is compared with the existing DWT and Gabor wavelet (Ashraf et al., 2020). In the existing technique, Discrete wavelet transform and Gabor wavelet is used for extracting image features. Table 6 shows the performance comparison of existing DWT and Gabor Transform method and proposed technique.
Table 6. Performance comparison of existing DWT and Gabor Transform and proposed technique
?
? ? ? ?
? ? ? ? ? ? 
? ? ? ?
It is observed from Table 6, the performance of proposed technique is better than existing DWT and Gabor Transform in terms of high average precision and recall. The performance degradation in existing technique is due to high dimensional feature vector for smaller sized cysts. This limitation of existing DWT and Gabor Transform method is overcome in the proposed technique using integrated image features with reduced feature dimension having high average precision and recall. Moreover, the computation time and the memory required for storing image features is reduced considerably in proposed technique. This is because as the dimension of feature vector is reduced, the memory required for storing image features also gets reduced. Thus in the proposed technique the memory required for storing features of one image is 56 bytes. This reduction in feature dimension increases the retrieval speed of the algorithm.
SUMMARY
In this work, the color and texture features are extracted from the image using color dispersion methods and gray level co-occurrence matrix. The similarity between query image and database images are measured using Euclidean distance. The performance of proposed technique is tested on application dataset, Ocular Melanoma. From the results, it has been observed that the performance of the proposed technique is far better than existing DWT and Gabor transform method, with high average precision of 93.25% and average recall of
93.33 %. Further, the memory required for storing the image features in the proposed image retrieval technique has decreased considerably with reduced feature size.
??? The proposed enhanced detection and retrieval of ocular melanoma using pattern recognition is also aimed to support physicians in decision making by retrieving and displaying relevant past cases visually similar to the one under examination. Besides diagnostics, teaching and research are expected to improve through the use of integrated image features as visually interesting images can be chosen and can actually be found in the existing large repositories.
From the experimental results, it has been found that the proposed technique not only retrieve images having similar diagnoses but also retrieve visually similar images from other categories for different diagnoses. In teaching, the proposed technique can help lecturers as well as students to browse educational image repositories and visually inspect the results found. It can also be used to cross correlate visual and textural features of the images.
REFERENCE

R. Malini, Retro-Odontoid Pseudotumor: A Rare Entity, Int. J. Sci. R. Tech., 2024, 1 (3), 41-49. https://doi.org/10.5281/zenodo.13886424
 10.5281/zenodo.13886424