

We use cookies to ensure our website works properly and to personalise your experience. Cookies policy
Nanochemistry Research Laboratory and Department of Chemistry, Nandurbar Taluka Vidhayak Samiti’s G.T. Patil Arts, Commerce and Science College, Nandurbar-425412
Air pollution is one of the major environmental and human health issues in emerging urban and semi-urban cities. The current study is concerned with the evaluation and design of an Air Quality Index at Nandurbar, using the monitoring data regarding the following components, particulate matter (PM 2.5), Sulphur dioxide, and nitrogen oxides. The aim of the research is to explain seasonal fluctuation, distribution of pollutants, and the general air quality of the research location. The air quality data on the three monitoring stations that were used to represent different activity areas in the city were primary. The specified pollutants were measured in concentrations at-fixed time intervals through 24 hours cycle and monthly averages were obtained to assess temporal changes. The data-analysis and monitoring processes complied with the norms provided by the Maharashtra Pollution Control Board. The AQI values were calculated to estimate the level of pollution as well as to categorize health risks that are associated with it. The results show that the levels of PM2.5 were low and stable throughout the year, SO2 and NOx had moderate seasonal variations with minor peaks in winter and during festivals. AQI scores were moderate to poor in some months and it indicated that there may be health issues with susceptible groups. These findings highlight the role of anthropogenic processes, climatic environmental factors, and festival emissions in the air quality changes. The research provides the background information on air pollution management and helps in environmental planning, protection of public health, and sustainability of urban development in emerging urban areas.
Air pollution has become one of the most essential environmental and community health issues in urban and semi-urban areas all over the world. Fast industrialization, growth in vehicular traffic, urbanization level and patterns of energy consumption and use has increased atmospheric emission of harmful gases (Kepri, 2023). Among different tools, which are designed to measure and report air-pollution levels, the Air Quality Index (AQI) is one of the most widely used tools to boil down complex data on the pollutant’s concentrations into one numerical value, which reflects the overall air-quality condition and its possible health impacts. AQI systems are now being implemented in numerous countries to measure air conditions in the ambient air as well as assist in policy formulation and work on public-awareness programmes (Basumatary et al., 2022).
AQI is basically an indicator of the health risks and the cleanliness or the pollution levels of the air. It is based on the measured levels of the major atmospheric pollutants, which usually comprise of particulate matter, nitrogen oxide (NO2), sulphur dioxide (SO2), ozone (O3), carbon monoxide (CO) and other pertinent elements (Yang et al, Zhong, 2022). These pollutants are chosen because they are most common in urban atmospheres and their effects on respiratory and cardiovascular health have been well-documented. The pollutant concentrations are computed in most AQI computation systems into sub-indices and are added together to achieve a total AQI value, and thus allows a simple understanding of the environmental-risk levels by policymakers and the general population (Sahak et al, 2022).
Of the gaseous pollutants, it is especially important to note sulphur dioxide and nitrogen dioxide as important indicators of air pollution caused by the combustion process. SO2 is mainly emitted in coal-fired power plants, burning industrial fuels, and petroleum refineries, but NO2 is closely related to automobile emissions, thermal power plants, and industrial processes. These gases should be monitored as they not only cause direct respiratory irritants, but also produce secondary pollutants, including particulate matter and acid rain, therefore, worsening the environmental quality and stability in the ecosystem (Wójcik-Gront et al, Gozdowski, 2025).
The quick urbanisation and development of the industrial sector in India have caused growing concern over the quality of air in the ambience. A number of studies carried out in Indian cities have confirmed that AQI-based measurement is a convenient tool to determine the key trends of pollution and determine the main pollutants and set the mitigation measures. As an example, AQI based research in cities like Delhi have indicated seasonal changes in the pollution state, which is usually dictated by the weather effects and human activities. Likewise, real-time AQI sensors have been conducted in cities like Indore and revealed that even though gaseous pollutants like SO2 and NOx usually remain within the stipulated limit, particulate pollutants are often found to exceed the stipulated limit, indicating the necessity of constant monitoring (Chauhan et al, 2010).
The city of Nandurbar in the north-western part of Maharashtra is a developing urban centre on which ambient air quality is affected by industrial activities, growth of transport, and other factors that vary with the local climatic conditions. It has been demonstrated in air-quality monitoring studies in Nandurbar that particulate matter frequently falls above National Ambient Air-Quality Standards (NAAQS) whereas gaseous pollutants, such as SO2 and NOx tend to be within acceptable limits, but seasonal changes can be expected (Ingle et al, 2015). City-wide monitoring programmes generally imply the use of continuous sampling at several points, the gas-sampling periods being such that they can record any temporal changes in the concentration of pollutants. The findings highlight the importance of systematic AQI development based on local monitoring data on the dynamics of pollution, and on supporting environmental planning in small Indian cities (Manohar et al, 2025).
The creation of an AQI model, which is directed in particular by the monitoring of SO2 and NOx, is significant to such cities as Nandurbar since gaseous pollutants are also directly connected with the growth of urban transport and industrial emissions. AQI development based on such a pollutant can assist in determining the sources of emission, as well as assess adherence to the regulatory norms and give a timely warning about the worsening situation with the air-quality. Besides, the simplified AQI models based on the use of a few selected pollutants can be employed in localities where entire multi-pollutant monitoring infrastructure is not present (Ashari et al, 2025).
It is essential to establish the Air Quality Index using the monitoring data of sulfur dioxide and nitrogen dioxide in Nandurbar to provide location-specific environmental indicators. This system may enhance environmental management tactics, safeguard public health, and facilitate sustainable urban development planning. It may also provide further insights into the air pollution patterns in semi-urban Indian regions, where air quality studies are rather limited compared to major cities.
Problem statement
Rapid urbanization, car growth and the rise of industry have led to the spread of air pollution that has become a big environmental and health problem of the people in the developing world. It is imperative to use such scientific tools as the Air Quality Index (AQI) to measure the degree of pollution and spread information about health risks to people. In India, monitoring and standards relating to air-quality are overseen by the Maharashtra Pollution Control Board in guidelines passed by the Government of India. Nevertheless, the distribution of AQI monitoring systems is mostly focused on major cities, which does not leave smaller cities with a large number of pollutant-specific AQI models and ongoing monitoring data. Due to the increased transportation and localized industries in such areas as Nandurbar, there is the emission of sulphur dioxide (SO2) and nitrogen oxides (NOx) that are hazardous to the respiratory system and the environment. The World Health Organization has emphasized on the need to monitor such gaseous pollutants because of their long-term health effects. The lack of a localized AQI that uses SO2 and NOx data limits the assessment of pollution, awareness of the population, and sound environmental planning. This means that an urgent necessity to invent a credible AQI model on these pollutants exists in order to improve management of air quality and protect the health of the population.
Research objectives
Literature review
(Zhao et al., 2023) China used a strict lockdown approach in Wuhan and Shanghai, two of the cities most severely affected by the COVID-19 epidemic, in an effort to limit the disease. ‘The impact of these lockdowns on the air quality index (AQI) is the focus of this deep learning study. Not only do we factor in historical pollution levels and weather patterns, but we also include social and spatio-temporal factors. One approach is spatial autocorrelation (SAC), which combines geographical correlation with temporal autocorrelation, to take adjacent cities and historical data into consideration. Using our deep learning technique,’ Study forecasted that the lockdown effects in Shanghai will be -25.47 and in Wuhan, -25.88. With associated prediction errors decreased in half for Shanghai and six and a half percent for Wuhan, far more accurate AQI estimates are now feasible.
(Verma, 2022) All living need oxygen to breathe and survive. The many components balance the texture of natural air. The ratio has little seasonal variation. Deforestation, industry, and urbanization are lowering air quality. As many industries progress, natural resource utilization worsens this dilemma. Air pollution harms all life on Earth, including people and animals. Various damaging particles, molecules, gasses, chemicals, and biological factors are to blame. Airborne pollutants like PM10, SO2, and NOx may change air texture. Air quality indexes may reveal a neighborhood's air quality. PM10 and NO2 annual average concentrations were 10-15 times and 2-5 times higher than the normal standard average in all cities. NO2 concentrations are unaltered by seasons in most regions, whereas PM10 concentrations are greatest in winter compared to summer and rainy seasons. SO2 levels were below limits in every city. All cities have air quality indices above the average 0–50. All cities have annual AQIs of 101-200. This value may harm people of all ages and create many health issues. Extended exposure to moderately high AQI (>100) causes respiratory discomfort, lung sickness, and cardiovascular issues. Increased pollutant concentrations induce climate change, which harms the ecology.
(Bhunia et al, Ding, 2020) This study examines Assam district air quality spatio-temporal changes and geostatistical pollution zone identification methods. We used GIS and geostatistical analysis to estimate gaseous and particle air pollution spatio-temporal trends from 2015 to 2017. Maharashtra Pollution Control Board data from 23 permanent monitoring stations. SO2 and NOx are Assam's significant air pollutants. Exploratory data analysis estimated regional and temporal air pollution trends. Air pollution and particles determined the AQI. Assam's air quality was studied spatially and temporally using RBF interpolation. Cross-validation tests interpolation algorithms' RMSE, MAPE, NSE, and ACFT. AQI was high in 2015 in the central and northeast. For 2016, the study area's center and eastern parts had the highest AQI. State center AQI was highest in 2017. A scientific basis for air pollution management and control is its spatio-temporal fluctuation pattern. Urban planners and decision makers may control air quality for health and the environment using this air pollution aggregate data. Implications: India's most polluted city, Guwahati, showed air pollution's impacts. Poor monitoring methods prevented daily or weekly air pollutant concentrations and PM2.5 data linking. This study quantifies 2015–2017 gaseous and particle air pollution spatio-temporal variations using GIS and spatial statistics. Air quality dispersion is possibly the first to be studied geographically and temporally in Assam. Assam's air quality decreased. Businesses and mines contaminate deltaic air. Urban planners and decision makers can control air quality for health and the environment using district-wise air pollution concentration data. Geography and pollutant concentration help seasonality. Add continuous data and parameters for more precise results.
(Suman, 2019) Increased pollution is a growing problem in India's cities. From a mathematical perspective, ‘there are several ways to determine the air quality index. Numerous studies have shown a causal relationship between air pollution and adverse health outcomes for the general population. The method that CPCB created in 2014 may, however, provide a more precise way to classify the air quality. The public may be kept apprised of the dangers of air pollution and any potential changes to the air quality in real time thanks to the air quality indices developed by various government and municipal groups. Read on to learn about the air quality index (AQI) and how it may help the government curb emissions from various sources by accurately measuring pollution levels and dangers.
(Patel et al, 2017) Clean air is essential for the survival of all living things. But unregulated construction, population growth, and car traffic have made air pollution a contemporary concern. The detrimental effects of air pollutants on human health are well-documented and include particulate matter, sulfur dioxide, nitrogen dioxide, ozone, and carbon monoxide. Primary air pollutants, such as PM10, PM2.5, SO2, and NO2, were evaluated at seven locations in the Dahej area. The anticipated concentrations of particulate matter (PM), particulate matter 2.5 (PM2.5), sulphur dioxide (SO2), and nitric oxide (NO2) at each of the seven sites ranged from 67.39 to 98.75 μg/m3, 29.57 to 45.79 μg/m3, 17.76 to 22.29 μg/m3, and 28.29 to 32.42 μg/m3, respectively.’ Sulfur dioxide and nitrogen oxide levels were found to be within permissible limits, however particulate matter 2.5 levels at three sites and particulate matter 10 levels at every station were marginally over the CPCB-recommended limit. For the research area, CPCB considers AQI levels between 76.50 and 97.75 to be good.
Experimental Methods:
The current research was conducted in order to evaluate the ambient patterns of sulphur dioxide (SO2) concentration and support the Air Quality Index estimation in Nandurbar. The study utilized the method of observational and analytical research that was based on the data of main air quality monitoring with a tendency of analyzing the temporal changes in SO2 concentrations as well as constructing strong indicators of exposure to pollutants as environmental indicators.
In the city, three air quality monitoring stations were chosen to be used in data collection. These stations were selected to represent different land-use patterns: residential zones, traffic-dominated zones and mixed commercial activity zones hence providing a representative evaluation of air quality and location-specific bias. The monitoring was performed based on the general air sampling and environmental monitoring requirements provided by the Maharashtra Pollution Control Board.
The sampling of primary data was performed with the standard ambient air monitoring equipment that is aimed at sampling gaseous pollutants. The SO2 concentration level was recorded at six fixed times in a 24 - Hours monitoring cycle, 06 -10 Hours, 10 -14 Hours, 14 - 18 Hours, 18- 22 Hours, 22- 02 Hours and 02- 06 Hours. The time-based monitoring plan enabled the capturing of the diurnal pollutant concentration variation which is dependent upon the traffic flow, the timing of industrial operations, and weather conditions.
Based on the made observations, 4-hour maximum concentration values were obtained in order to determine short-term pollution peaks and the 24-hour average concentration values were obtained to determine the daily levels of exposure. Observations were done over several months to identify seasonal variation and as such included summer, monsoon, winter and festival seasons. This seasonal information was a revelation into the role of climatic variables of rainfall, temperature, and wind speed in pollutant dispersion.
The data gathered were summarized per station and then averaged in order to obtain the values of the city level in the form of the pollutant’s concentration. To explain the temporal change in SO2, descriptive statistical methods, such as the mean, maximum, minimum, and the trend analysis were used. The processed data were also used in the estimation of Air Quality Index and evaluation of the environmental quality.
The research design was able to generate comparable, reliable and systematic air quality data. The time-interval and multi-station monitoring methodology increased the accuracy of the pollution evaluation and acquiring the evidence-based environmental assessment of city air quality management and planning.
Results and Discussion:
‘The results section entails the analytical findings of the ambient air-quality monitoring that is carried out in Nandurbar, basing on the pollutants of choice such as PM 2.5, sulphur dioxide (SO2), nitrogen oxides (NOx), and the Air Quality Index (AQI).’ This part is intended to deliver a systematic report about the gathered field data, then statistical analysis and interpretation of the trends of the pollutant contents and their concentrations in various months and time periods.
|
PM2.5 |
|
|
Month |
concentration in µg/m3 |
|
January |
4.36 |
|
February |
4.3 |
|
March |
5.04 |
|
April |
4.04 |
|
May |
4.37 |
|
June |
4.42 |
|
July |
3.3 |
|
August |
4.3 |
|
September |
3.66 |
|
Diwali |
3.72 |
|
October |
5.04 |
|
November |
3.95 |
|
December |
4.02 |
Table 1: PM 2.5
Inter-annual variation in monthly PM2.5 concentration values is relatively low and the actual range is 3.3 µg /m³ to 5.04 µg /m³. It is worth noting that March and October have the highest concentration of 5.0400 -3, which is probably caused by meteorological changes in the season, increased dust mobilization, and increased anthropogenic activity during those months. On the other hand, the lowest point of 3.3 mug /m³ belongs to July and this finding can be explained by the fact that monsoonal rainfalls promote wet deposition and hence elimination of particulate matter in the air. During the winter season (November-February), the concentration of PM 2.5 is relatively constant, which cannot be explained by the fact that the atmospheric dispersion and temperature inversion conditions are less favorable, but the value is low. There is the summer period (April - June) with a little higher but constant values that can be even partially explained by drier climate and re-suspension of dust particles. In the Diwali festivities, the concentration is 3.72 µg/m³ to show no sharp increase; this finding can be interpreted as a sign of restrained use of firecrackers, favorable weather conditions, or the existence of low-level ambient pollution baseline. Overall, the data set indicates the persistently positive quality of air as there is no single measure of PM2.5 exceeding the national and international allowable levels during the calendar year.
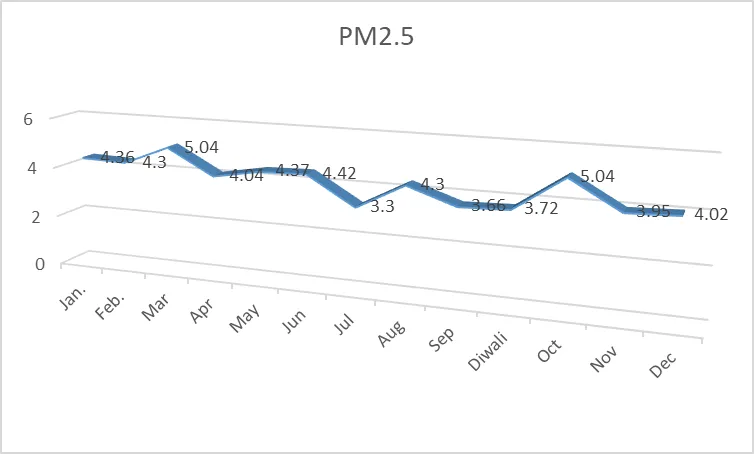
Fig 1: Graphical presentation of PM 2.5
|
SO2 |
|
|
Month |
concentration in µg/m3 |
|
January |
4 |
|
February |
4.3 |
|
March |
4.5 |
|
April |
4.58 |
|
May |
4.4 |
|
Jun |
4.84 |
|
July |
4.71 |
|
August |
5.09 |
|
September |
4.96 |
|
Diwali |
5.3 |
|
October |
5.1 |
|
November |
5.16 |
|
December |
4.87 |
Table 2: Sulphur Dioxide (SOâ‚‚)
The concentration of Sulphur dioxide (SO2) monthly shows a weak positive trend throughout the year with values that vary between 4.0 ug/m³ and 5.3 ug/m³. The lowest concentration of 4.0 µg is observed in the month of January and the highest of 5.3 µg/m³ is on the Diwali period. Such an increase linked to Diwali can possibly be explained by the increased combustion related to firecracker ignition, increased traffic and other activities that accompany the festival that led to a temporary increase in emissions. The SO2 concentration is performing a slow increase between January and April, which can be attributed to increased combustion or shifting of the seasonal atmosphere. During the summer season (May-June) the concentrations are relatively constant and there is a slight increase that may be attributed to industrial activities and burning of fuel. SO2 concentrations remain somewhat stable during the monsoon (July-September), indicating that rainfall has a minor impact on the elimination of gaseous pollutants as opposed to particulate matter. During post-monsoon and winter (October to December), the concentrations are expected to increase slightly which may be due to the large reduction in atmospheric dispersion and increased human activity. In general, the concentration of SO2 is kept within reasonable values, which means that the emissions of Sulphur and its derivatives are controlled and the quality of ambient air is usually healthy.
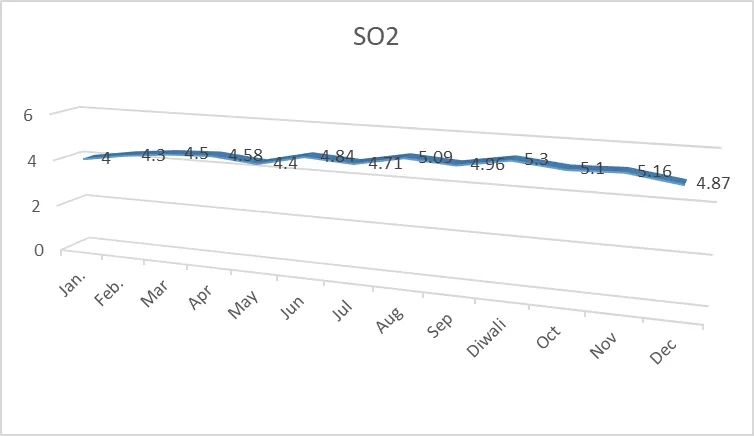
Fig 2: Graphical presentation of Sulphur Dioxide (SOâ‚‚)
|
NO2 |
|
|
Month |
concentration in µg/m3 |
|
January |
11.3 |
|
February |
12.8 |
|
March |
12.6 |
|
April |
13.19 |
|
May |
11.33 |
|
June |
12.35 |
|
July |
10.05 |
|
August |
10.27 |
|
September |
10.06 |
|
Diwali |
13.74 |
|
October |
12.74 |
|
November |
12.18 |
|
December |
12.86 |
Table 3: Nitrogen Oxides (NOx)
The monthly nitrogen oxides (NOx) concentration values show moderate seasonal variation, with concentrations ranging from 10.05 µg/m³ to 13.74 µg/m³. The lowest concentration was observed in July (10.05 µg/m³), while the highest value was recorded during the Diwali period (13.74 µg/m³). The peak during Diwali may be associated with increased vehicular movement, firecracker burning, and festive activities, which temporarily raise nitrogen oxide emissions. During the winter months (November–February), NOx levels remain relatively higher, likely due to temperature inversion conditions that reduce pollutant dispersion and increase pollutant accumulation near ground level. In the summer months (March–June), NOx concentrations remain moderately high due to increased vehicular activity and higher fuel combustion. During the monsoon season (July–September), NOx levels decline slightly, which may be attributed to improved atmospheric dispersion and rainfall-related pollutant removal. Overall, NOx concentrations remain within acceptable environmental limits, indicating moderate emission levels. However, seasonal increases during winter and festival periods highlight the need for continuous monitoring and emission control strategies to maintain good air quality (V.S.Shrivastava et.al 2025).
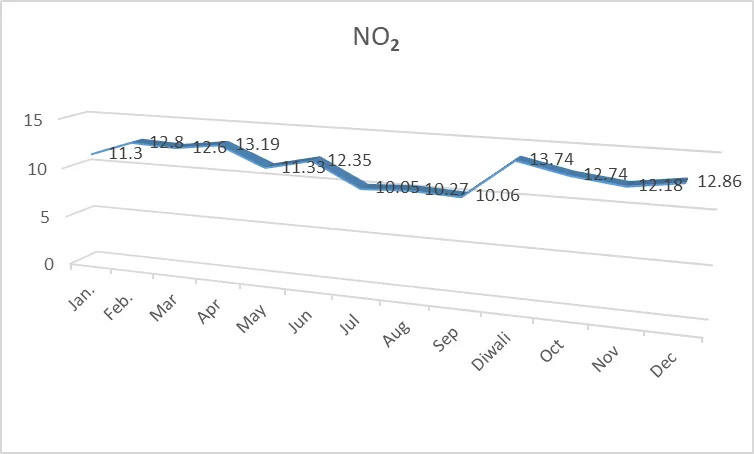
Fig 3: Graphical presentation of Nitrogen Oxides (NOx)
|
Month |
AQI |
|
January |
114 |
|
February |
114 |
|
March |
116 |
|
April |
116 |
|
May |
110 |
|
June |
87 |
|
July |
93 |
|
August |
158 |
|
September |
94 |
|
Diwali |
191 |
|
October |
144 |
|
November |
156 |
|
December |
187 |
Table 4: Air Quality Index (AQI)
The monthly values of Air Quality Index (AQI) reflect both the moderate and poor air quality conditions throughout most of the year with an index of 87 to 191. The minimum AQI of 87 is observed in June, which hints at relatively better air quality, which may be attributed to the atmospheric dispersion before the monsoons and the decreased number of pollutants into the atmosphere. With the monsoon period (July-September) in progress, the values of the AQI remain under the moderate category, which means that the air quality generally improves, which is due to rainfall and the increased distribution of pollutants. It is worth noting that the AQI of August is at 158, which is clearly an increment that could be caused by point sources of emissions or changes in weather. The maximum AQI of 191 is measured in the Diwali season, which means that the quality of air is significantly spoiled; the peak can be explained by the burning of firecrackers, increased traffic, and related events of the festival, which temporarily increase the level of pollutants. Also, it is found that the AQI scores are higher in October (144), November (156), and December (187) and it may be due to the inversion conditions and the lack of atmospheric dispersion during the winter. Taken altogether, the statistics outline a seasonal trend in AQI, whereby the air quality is comparatively higher during the monsoon, and worse during winter and festival seasons, which explains the need to continue monitoring the air quality and actively control pollution.
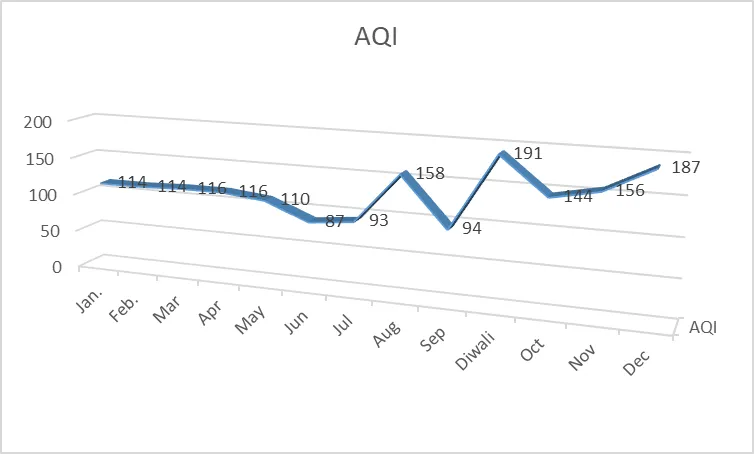
Fig 4: Graphical presentation of Air Quality Index (AQI)
DISCUSSION:
The modern air-quality evaluation based on PM 2.5, SO2, NOx, and Air Quality Index (AQI) demonstrates clear seasonal differences in the level of pollution, which can be explained by the combined effect of human activity and weather effects. The values of AQI observed in Nandurbar fell in the moderate to poor range which means that though air quality was not of critically hazardous conditions there were periods of concern when the situation was at issue, especially in the periods of festivals and during winter. Based on the standards issued by the Maharashtra Pollution Control Board, the AQI ranging 101 to 200 are considered moderate or poor and could cause respiratory discomfort in the sensitive subpopulations.
PM 2.5 concentrations were relatively low and showed no variance throughout the annual cycle, indicating a relatively low amount of fine particulate matter compared to many other urban sites in India. However, gaseous emissions like SO2 and NOx exhibited slight seasonal increases particularly at the times of Diwali and winter. Such changes are likely to be attributed to the rise in vehicular emissions, combustion-related processes, and reduced atmospheric dispersion in the cold seasons.
Such a sharp increase in the AQI in the Diwali days highlights the role of firecracker emissions and related temporary increase in traffic and commercial activity. Similar tendencies have been recorded in several cities of India, where emission due to festivals has a significant influence on the short-term air-quality indicators.
Considering the public-health perspective, it is critical that the environmental level is monitored on a continuous basis because despite the relatively low level of exposure to air pollution, the risk of respiratory and cardiovascular morbidity may increase. The World Health Organization underscores that regular monitoring and proactive measures should be put in place to reduce the health impacts of air pollution in the long run.
Altogether, the results underscore the need to implement seasonal pollution-management measures, improved emission-control policies, and awareness campaigns to the population that would help to maintain an acceptable air-quality level.
CONCLUSION
The presented investigations lead to an understanding the importance of long-term air-quality monitoring to identify the trends in pollution and apply them to environmental-management practice in Nandurbar. The data analysis of PM 2.5, SO2, NOx and AQI show that the air quality of the area is moderate to poor at certain periods, especially in winter and during festivals. Differentiation of the seasonal variation was also evident, as the air quality was comparatively better in monsoon months and level of pollution was high in the post-monsoon and winter seasons. The results of the research show that despite the fact that gaseous types of pollutants like sulphur dioxide and nitrogen oxide are mostly withheld within the acceptable levels, intermittent rises are recorded because of the activities of man, such as automobiles, fuel burning and festival releases. The values of AQI indicate possible health hazards of vulnerable population during periods of high pollution. These are observations that conform to the guidelines and classification systems published by Maharashtra Pollution Control Board. In a public-health setting, sustained surveillance and preventive strategies are mandatory which has been supported by the world health organization. The study shines light on the need to strengthen the local monitoring systems, introduce stringent emission-control strategies, as well as raise the public awareness on pollution-control procedures.
Finally, the research offers useful background information on environmental planning, air-pollution control and sustainable urban development, and highlights the importance of long-term surveillance and policy-based interventions to maintain safe levels of air-quality.
ACKNOWLEDGEMENT:
We are thankful to Maharashtra Pollution Control Board, Mumbai, and the Sub-Regional office, Nashik. Also, Prof. Dr. M. J. Raghuwanshi, Principal, Nandurbar Taluka Vidhayak Samiti’s, G. T. Patil Arts, Commerce and Science College, Nandurbar-425412 for providing all necessary facilities for work.
REFERENCES

Kalpesh C. Sawant, Manohar R. Patil*, Yogesh V. Marathe, Ganesh N. Bagul, Himmat A. Patil, Tushar R. Borane, Sandip P. Patil, Vinodshankar S. Shrivastava, Air Quality Index (AQI) Assessment Using Particulate Matter, Sulphur Dioxide And Nitrogen Dioxide Monitoring In Nandurbar City, Maharashtra, India, Int. J. Sci. R. Tech., 2026, 3 (8), 610-620. https://doi.org/10.5281/zenodo.21979736
 10.5281/zenodo.21979736