

We use cookies to ensure our website works properly and to personalise your experience. Cookies policy
Lords business School, Lords University, Alwar, Rajasthan, India
Climate-related disasters now strike India almost every year, yet their effect on property insurance claims has rarely been measured. This study examined whether such disasters change the level, frequency, severity and volatility of property insurance claims in India. Because regulators do not report a separate property line, the fire line of business, which covers storm, cyclone and flood perils, served as the proxy. Official statistics were combined with cyclone landfall records and the EM-DAT international disaster database at three levels: a national series for the financial years 2010-11 to 2024-25, district-wise claims for Cyclones Biparjoy and Michaung, and a fixed-effects panel of 36 states and union territories. Landfall counts were not associated with the fire gross incurred claims ratio (ICR) (r = 0.13, p = 0.652), whereas the annual count of climate-related disasters was (r = 0.58, p = 0.023). Controlling for a linear trend, each additional disaster raised the gross ICR by about 2.0 percentage points and the net ICR by 1.3 points. In the catastrophe year 2023-24 the average paid property claim rose to 7.89 lakh Indian rupees (INR), against INR 5.59 lakh over the previous four years, while claim frequency changed little. Average settled claims differed sharply between a cyclone on an industrial coast and an urban flood (INR 11.1 against 1.75 lakh). State fire premium did not respond to disaster exposure. Disaster frequency raises claim costs in the year of occurrence without a lasting upward trend.
Insurance markets were built on the assumption that the hazards they price are broadly stable from one decade to the next. That assumption is weakening. The Sixth Assessment Report of the Intergovernmental Panel on Climate Change concludes that the frequency and intensity of many weather and climate extremes have already increased, and it identifies South Asia as a region of high exposure [1]. Ensemble impact simulations suggest that warming has already more than doubled the share of land and population exposed to extreme climate-impact events [2], and reviews of disaster economics show that direct losses fall most heavily on economies with thin insurance cover [3], [4]. For an insurer, a changing hazard distribution means that past loss experience becomes a weaker guide to future claims [5], [6].
India is a demanding setting in which to examine this problem. Its long east coast faces the cyclone-generating waters of the Bay of Bengal, its northern plains and north-eastern valleys flood almost every monsoon, and its fast-growing cities have drainage systems that fail under intense rainfall. The 2024 monsoon alone produced three multi-day extreme precipitation events that caused major floods in western, southern and northern states [7]. An early assessment of the Indian insurance industry already warned that its exposure to such hazards was large and poorly priced [8]. Since then, the property portfolio has grown rapidly, and a sequence of named cyclones, from Phailin in 2013 to Remal, Dana and Fengal in 2024, has tested it repeatedly.
Despite this exposure, the empirical literature on climate risk and insurance in India has concentrated on crop insurance and on disaster management in general [9], [10]. Studies of how disasters move property claims, the subject of a substantial literature in the United States and Europe [11], [12], [13], have no clear Indian counterpart. Three questions therefore remain open: whether years with more disasters produce measurably higher property claims ratios; whether the effect works through the number of claims or through the cost of each claim; and whether disaster experience changes insurance demand in the states that are hit.
This paper addresses those questions with secondary data from the Indian regulator and the industry body, combined with two independent hazard measures. Its contributions are threefold. First, it assembles a fifteen-year national series of fire insurance indicators and tests their association with both cyclone landfalls and the full record of climate-related disasters. Second, it uses the only published district-level catastrophe claims data for India to compare the claim profile of two contrasting cyclones. Third, it estimates a two-way fixed-effects panel for 36 states and union territories to test whether insurance demand responds to disasters. Section 2 reviews the literature, Section 3 describes the data and methods, Section 4 reports and discusses the results, and Section 5 concludes.
2. LITERATURE REVIEW
2.1. Hazard Intensification and the Growth of Losses
The physical evidence that extremes are becoming more frequent and intense is now well established [1], [2]. Translating that evidence into monetary loss is less direct. Bouwer showed that projected increases in losses from storms and floods depend as much on the growth and concentration of exposed assets as on the climate signal itself [14]. Botzen et al. distinguished direct damage from indirect and macroeconomic effects and noted how difficult it is to attribute losses to individual events [3]. Ferreira argued that adaptation, including risk transfer, is the main instrument for containing these costs, but only when incentives keep pace with the evolving risk [4]. For insurers, Mills observed two decades ago that weather-related losses were rising faster than premiums, population and economic output, and that the industry's reliance on historical data left it vulnerable [5].
2.2. From Hazard to Claims
The mapping from hazard to claims is rarely linear. Using home insurance claims, Lyubchich and Gel identified rainfall thresholds beyond which claims escalate sharply [11]. Catastrophes also violate the independence assumption on which risk pooling rests: a single storm produces spatially correlated losses across a portfolio, and Kunreuther and Michel-Kerjan showed how such accumulation threatens the insurability of large-scale disasters [6], [15]. Gatzert and Özdil added that climate shocks can hit both sides of a non-life insurer's balance sheet at once, eroding diversification [16]. Insurers respond on the supply side. After large losses they reprice and reclassify risk [13], and where regulation restricts risk-based pricing they may withdraw capacity from exposed areas [12]. Flood cover in particular remains rare in most countries because of adverse selection, affordability and low awareness [17]. Steptoe et al. argued that catastrophe models must move away from a purely statistical representation of past events, because the historical record is a small and increasingly unrepresentative sample of possible losses [18].
2.3. Evidence for India and the Research Gap
Indian studies have documented the industry's exposure [8], the limits of indemnity-based schemes for climate-exposed farmers [9] and the barriers that keep flood insurance out of reach of poor urban households [10]. International reviews have placed India among the markets with the widest gap between economic and insured loss [19]. What is missing is a quantitative account of how disasters affect the property claims that insurers actually pay. No published study has related Indian property claims ratios to an annual hazard record, separated changes in claim frequency from changes in severity, or tested at state level whether disaster experience alters insurance demand. This paper fills that gap and tests the following hypothesis: H1, climate-related catastrophic events significantly influence the frequency, severity and volatility of property insurance claims in India. The corresponding null hypothesis, H01, is that they do not.
METHODOLOGY
3.1. Data and Study Area
The study is retrospective and non-experimental and uses only published, aggregated secondary data. The study area is India, analysed at national, event and state level. The principal window is the financial years (April to March) 2010-11 to 2024-25, which gives 15 annual observations and covers major events before and after 2020. Table 1 lists the data sets.
Table None: 1: Data Sets, Units of Analysis and Sources
| Data set | Unit and period | n | Source |
|---|---|---|---|
| National fire insurance series | India, FY 2010-11 to 2024-25 | 15 | GI Council yearbooks [20] |
| Property claim counts | India, FY 2019-20 to 2024-25 | 6 | GI Council yearbooks [20] |
| Event claims (Biparjoy, Michaung) | District, FY 2023-24 | 58 | GI Council yearbook 2023-24 [20] |
| State fire premium panel | State/UT × year, 2014-15 to 2024-25 | 391 | IRDAI Handbook 2024-25 [21] |
| Cyclone landfalls | Named storm, 2010–2025 | 35 | IMD/RSMC New Delhi [22] |
| Climate-related disasters | Event, 2000–2025 | 394 | EM-DAT [23] |
Note: FY = financial year; UT = union territory; GI Council = General Insurance Council; IRDAI = Insurance Regulatory and Development Authority of India; IMD = India Meteorological Department. Five Ladakh state-years before 2019-20 are missing.
Neither the Insurance Regulatory and Development Authority of India (IRDAI) nor the General Insurance Council (GI Council) reports a separate property line. The fire line, which covers fire and allied perils including storm, cyclone, flood and inundation, was therefore used as the proxy for property insurance. Claim counts are published only for the combined property class (fire plus engineering) and only from 2019-20. Where the regulator's handbook and the industry yearbook gave different values for the same quantity, a single source was used consistently within each analysis: the yearbooks for the national series and the handbook for the state panel [20], [21].
3.2. Variables
Claims level was measured by the fire gross incurred claims ratio (ICR), gross incurred claims divided by gross earned premium, and the net ICR, net incurred claims divided by net earned premium. Claim frequency was defined as property claims reported per 1,000 policies, and severity as the amount paid divided by the number of claims paid, in lakh Indian rupees (INR; one lakh = 100,000 and one crore = 10 million). Volatility was measured by the standard deviation and the coefficient of variation (CV) of the ICR within a period.
India has no official register of disasters by state and year, so hazard exposure was measured in two independent ways. One counts named cyclones of cyclonic-storm intensity or above that crossed the Indian coast, from the records of the Regional Specialised Meteorological Centre in New Delhi [22]; storms that affected India without landfall were excluded. The other counts all climate-related disasters that EM-DAT lists for India [23], covering floods, storms, landslides, extreme temperature, drought, glacial lake outbursts and wildfires. Because most cyclones and monsoon floods occur between April and December, calendar year t was matched to financial year t/(t + 1). For the state panel, a state-year was coded as affected when a named cyclone made landfall there or a major flood occurred (landfall measure), or when at least one EM-DAT event named the state (EM-DAT measure).
3.3. Statistical Analysis
National series were described by means, standard deviations and CVs, and compared across three five-year periods with the Kruskal–Wallis test [24]. Monotonic trends were tested by ordinary least squares (OLS) on a time index and by the Mann–Kendall test [25], [26]. Associations between claims ratios and hazard measures were estimated with Pearson's correlation and, as a robustness check, Spearman's rank correlation [27]; years at or above the median number of landfalls were compared with the remaining years by the Mann–Whitney U test [28]. Because both claims ratios and hazard counts may drift over time, the association was then estimated with a linear trend:
ICRt = β0 + β1Et + β2t + εt
(1)
where ICRt is the gross or net claims ratio in year t, Et is the number of EM-DAT climate-related disasters, t is a time index and εt is the error. Heteroskedasticity-robust (HC1) standard errors were used [29]. A further specification entered floods and storms separately.
For the two cyclones with district data, the settlement ratio (claims settled divided by claims reported) and the average settled claim were computed for each district, and geographic concentration was measured by the Herfindahl–Hirschman index (HHI) of district shares:
H = ∑dsd2
(2)
where sd is the share of district d in the claims of an event. Districts with at least 10 reported claims were compared between the two events with the Mann–Whitney U test. Finally, a two-way fixed-effects panel was estimated for states and union territories:
Yst = αs + γt + β1Cst + β2Cs,t-1 + εst
(3)
where Yst is the natural logarithm of fire gross direct premium income (GDPI) or the fire share of total premium in state s and year t, αs and γt are state and year fixed effects, and Cst is the disaster exposure of the state. Year dummies remove nationwide shocks, including detariffing effects and the pandemic years. Standard errors were clustered by state [30], [31]. With no state-wise claims in the public domain, this panel captures how insurance demand reacts, not how claims do. Coastal and non-coastal states were also compared with the Mann–Whitney U test. All tests were two-tailed at the 5% level. Analyses were run in Python with pandas, SciPy [32], statsmodels [33] and pyMannKendall [34].
RESULTS AND DISCUSSION
4.1. Claims Level, Trend and Volatility
Table 2 summarises the national fire portfolio. Gross written premium (GWP) grew from INR 6,051 crore in 2010-11 to a peak of INR 30,697 crore in 2023-24, about 11.8% a year. The claims ratios moved in a far narrower band: the gross ICR averaged 59.9% (CV 0.205) and the net ICR 77.1% (CV 0.131). Engineering, which shares many perils with fire, was the most volatile series (CV 0.345).
Table None: 2: National Fire Insurance Indicators and Trend Tests, 2010-11 to 2024-25 (N = 15)
| Indicator | Mean | SD | CV | MK τ | p |
|---|---|---|---|---|---|
| Fire GWP (INR crore) | 16,690 | 8,578 | 0.514 | 0.981 | <0.001 |
| Fire gross ICR (%) | 59.9 | 12.3 | 0.205 | −0.333 | 0.092 |
| Fire net ICR (%) | 77.1 | 10.1 | 0.131 | −0.314 | 0.113 |
| Engineering gross ICR (%) | 46.8 | 16.1 | 0.345 | −0.200 | 0.322 |
Note: SD = standard deviation; CV = coefficient of variation; MK τ = Mann–Kendall tau. Source: computed from GI Council yearbooks 2019-20 and 2024-25 [20].
Fig. 1 shows that the claims ratio does not drift upwards. It rises sharply in particular years, 2013-14, 2014-15, 2016-17, 2018-19 and 2023-24, and falls back in the next. Each peak coincides with major cyclones or floods: Phailin (2013), Hudhud and the Jammu and Kashmir floods (2014), Vardah (2016), the Kerala floods with Titli and Gaja (2018), and Biparjoy and Michaung (2023). Neither ratio has a significant monotonic trend (Table 2). Split into five-year periods, the gross ICR was lowest on average in 2020-25 (50.5%, against 62.9% and 66.4%) but most volatile then (CV 0.219, against 0.201 and 0.127); the Kruskal–Wallis test found the difference in level only marginally significant (H = 6.02, p = 0.049) and the net ICR difference not significant (p = 0.063). Recent years thus combine lower average ratios with larger annual swings.
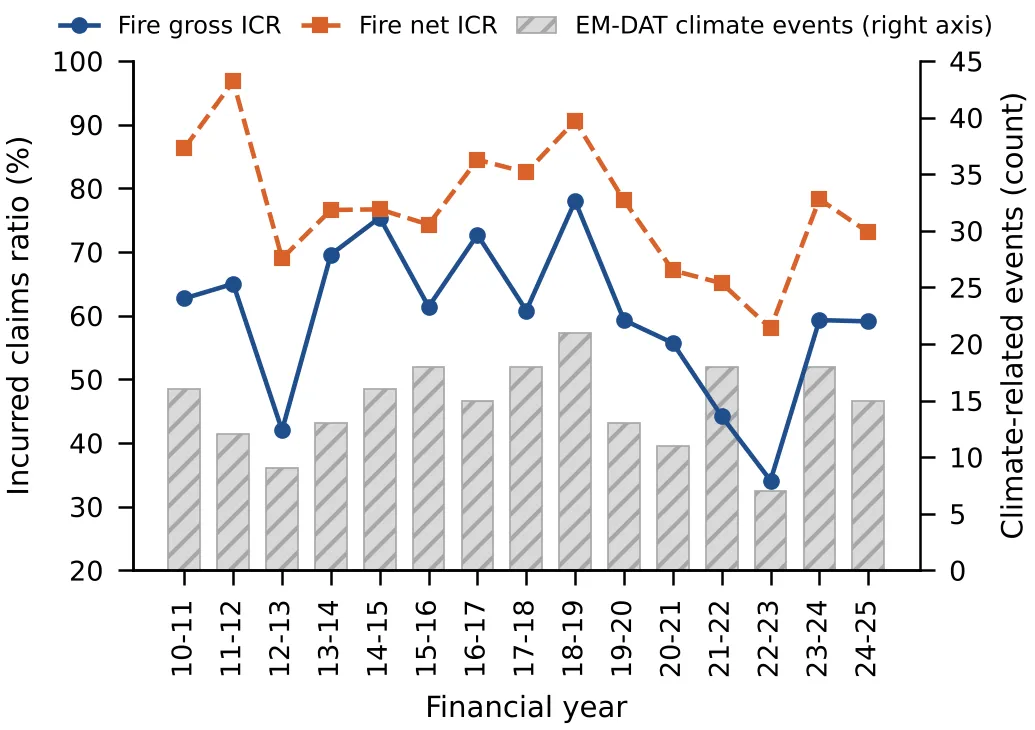
Figure None: 1: Fire Gross and Net Incurred Claims Ratios and the Annual Number of Climate-Related Disasters Recorded for India in EM-DAT, 2010-11 to 2024-25. Source: GI Council Yearbooks and EM-DAT [20], [23].
4.2. Association between Hazard Activity and Claims Ratios
Thirty named cyclones made landfall in India between 2010 and 2024, 25 of them severe or stronger, and since 2018 there have been at least two landfalls every year. EM-DAT records 220 climate-related disasters in India over the study period, from seven in 2022-23 to 21 in 2018-19. Table 3 reports the correlations between the claims ratios and the two families of hazard measures. No landfall-based measure is significantly associated with either ratio. The lagged landfall coefficients are negative, which is consistent with repricing after a bad year, but they too are not significant. Median claims ratios in years with two or more landfalls were almost identical to those in quieter years (59.2% against 61.4%; Mann–Whitney p = 0.679).
Table None: 3: Pearson Correlations Between Fire Claims Ratios and Hazard Measures
| Hazard measure | r (gross) | p | r (net) | p |
|---|---|---|---|---|
| Indian cyclone landfalls | 0.127 | 0.652 | −0.091 | 0.748 |
| Severe landfalls | 0.154 | 0.584 | −0.076 | 0.788 |
| North Indian Ocean named cyclones | 0.262 | 0.346 | 0.101 | 0.720 |
| Landfalls, previous year (n = 14) | −0.320 | 0.265 | −0.360 | 0.207 |
| EM-DAT climate events | 0.581 | 0.023 | 0.454 | 0.089 |
| EM-DAT floods | 0.464 | 0.082 | 0.470 | 0.077 |
| EM-DAT storms | 0.517 | 0.048 | 0.408 | 0.131 |
| EM-DAT people affected | 0.402 | 0.138 | 0.025 | 0.929 |
| EM-DAT economic damage | 0.203 | 0.469 | −0.192 | 0.493 |
Note: n = 15 unless stated. Hazard data from IMD/RSMC and EM-DAT [22], [23]; claims ratios from GI Council yearbooks [20].
The broader EM-DAT measure tells a different story. The annual number of climate-related disasters is significantly and positively correlated with the gross ICR (r = 0.58, p = 0.023), and storm counts show a similar link (r = 0.52, p = 0.048). Deaths and reported economic damage are not correlated with claims, which is unsurprising given that EM-DAT records damage for only 111 of its 394 Indian events. The Spearman coefficient for event counts is smaller and significant only at 10% (ρ = 0.45, p = 0.090). Fig. 2 sets the two measures side by side. Landfall counts capture a single peril at a single moment, whereas EM-DAT also records inland floods, cloudbursts and landslides in the Gangetic and Himalayan states.
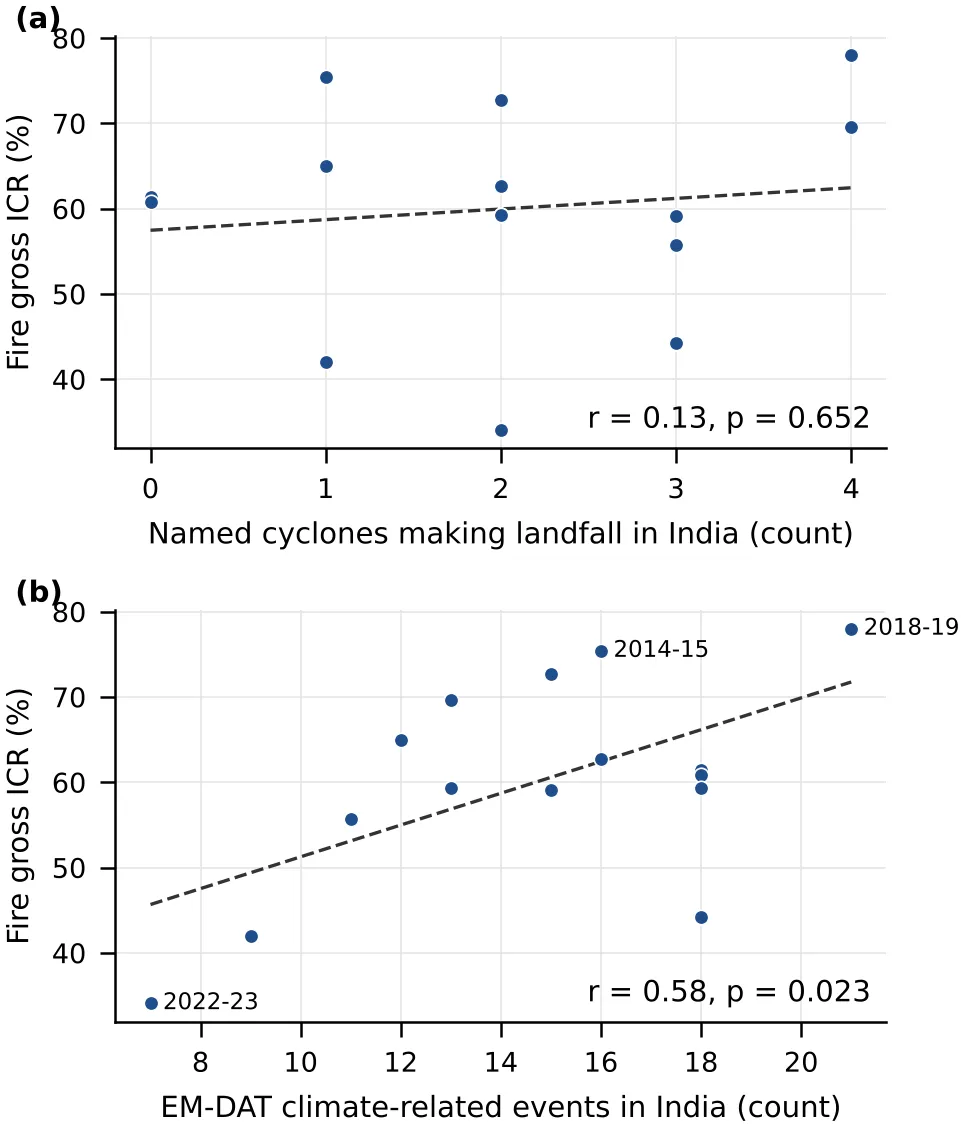
Figure None: 2: Fire Gross Incurred Claims Ratio Against (a) Named Cyclone Landfalls in India and (B) EM-DAT Climate-Related Disasters, 2010-11 to 2024-25, with Least-Squares Lines.
Table 4 reports the regressions of Eq. (1). Once the linear trend is controlled, each additional climate-related disaster is associated with a rise of about 2.0 percentage points in the gross ICR (p = 0.002) and 1.3 points in the net ICR (p = 0.005). When floods and storms enter separately, the effect comes from storms (2.8 points per event, p = 0.010). Because the trend coefficient is negative, a gradual decline in claims ratios conceals the disaster effect unless both terms enter together. With 15 observations these estimates are indicative, but they are the clearest national evidence in this study that disaster frequency moves the fire claims ratio.
Table None: 4: OLS Regressions of Fire Claims Ratios on EM-DAT Disaster Frequency, 2010-11 To 2024-25
| Variable | (1) Gross | (2) Gross | (3) Net | (4) Gross |
|---|---|---|---|---|
| EM-DAT climate events | 0.0186** | 0.0197*** | 0.0132*** | – |
| (0.0073) | (0.0063) | (0.0047) | ||
| EM-DAT floods | – | – | – | 0.0127 |
| (0.0170) | ||||
| EM-DAT storms | – | – | – | 0.0279** |
| (0.0109) | ||||
| Linear time trend | – | −0.0106** | −0.0122** | −0.0092 |
| (0.0051) | (0.0048) | (0.0072) | ||
| Observations | 15 | 15 | 15 | 15 |
| R² | 0.337 | 0.486 | 0.496 | 0.464 |
Note: ICR measured as a fraction (0.01 = one percentage point). HC1 robust standard errors in parentheses. * p < 0.01, p < 0.05.
4.3. Claim Frequency and Severity
Claim counts show how the effect operates (Fig. 3). In 2023-24, the year of Biparjoy and Michaung, property claims reported rose to 266,613 from an average of 181,680 in the previous four years. Frequency per 1,000 policies rose only modestly, to 26.4 against an average of 23.7, because the number of policies was also growing. Severity rose much more: the average paid claim reached INR 7.89 lakh against a previous average of INR 5.59 lakh, about 2.7 standard deviations above it, and claims paid rose from 36.3% to 47.6% of premium. In a catastrophe year the larger change is therefore in the cost of each claim rather than in the number of claims. With six observations this is descriptive evidence rather than a formal test.
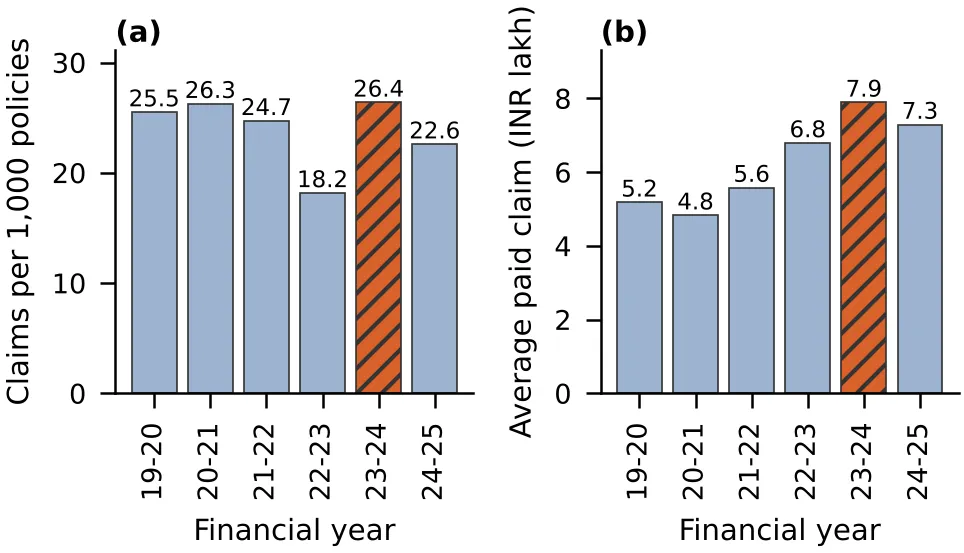
Figure None: 3: Property (Fire Plus Engineering) Claims: (A) Frequency per 1,000 Policies and (B) Average Paid Claim, 2019-20 to 2024-25. the Hatched bar Marks 2023-24. Source: GI Council Yearbooks [20].
4.4. Event-Level Evidence: Cyclones Biparjoy and Michaung
The two cyclones of 2023-24 produced very different claim profiles (Table 5, Fig. 4). Biparjoy, a severe cyclone that crossed the sparsely populated Kutch coast of Gujarat, generated 4,381 claims; 3,134 were settled by 31 March 2024 for INR 348.8 crore, an average of INR 11.1 lakh each. Michaung, which flooded Chennai, generated more than 11 times as many claims (49,370), but the average settled claim was only INR 1.75 lakh. Losses were highly concentrated: Kutch accounted for 57% of Gujarat's Biparjoy claims and Chennai for 80% of Tamil Nadu's Michaung claims, and the HHI of district shares for Michaung was 0.64.
Table None: 5: Claims Arising from Cyclones Biparjoy and Michaung by State (as of 31 March 2024)
| Event / state | Reported | Settled | INR crore | Settled ÷ reported | Avg. (INR lakh) |
|---|---|---|---|---|---|
| Biparjoy: Gujarat | 3,910 | 2,803 | 326.5 | 71.7% | 11.65 |
| Biparjoy: Rajasthan | 471 | 331 | 22.3 | 70.3% | 6.74 |
| Biparjoy total | 4,381 | 3,134 | 348.8 | 71.5% | 11.13 |
| Michaung: Tamil Nadu | 48,774 | 33,252 | 579.0 | 68.2% | 1.74 |
| Michaung: Andhra Pradesh | 461 | 175 | 7.5 | 38.0% | 4.29 |
| Michaung: Puducherry | 133 | 64 | 1.0 | 48.1% | 1.56 |
| Michaung total | 49,370 | 33,492 | 587.6 | 67.8% | 1.75 |
Note: all lines of business combined. Event totals include one claim each in Kerala and Telangana. Source: GI Council yearbook 2023-24, Section 06 [20].
District-level tests confirm that the contrast is not driven by Kutch and Chennai alone. Across districts with at least 10 claims (19 for Biparjoy and 20 for Michaung), the median average settled claim was INR 5.27 lakh for Biparjoy against INR 1.61 lakh for Michaung (U = 282.5, p = 0.010), and the median share of reported claims already settled was 73.8% against 57.5% (U = 267.0, p = 0.032). Michaung struck later in the financial year, which left less time for settlement. The most likely explanation for the severity contrast is the exposure struck: a few large industrial and port risks around Kutch against a dense mass of small commercial, residential and motor risks in Chennai.
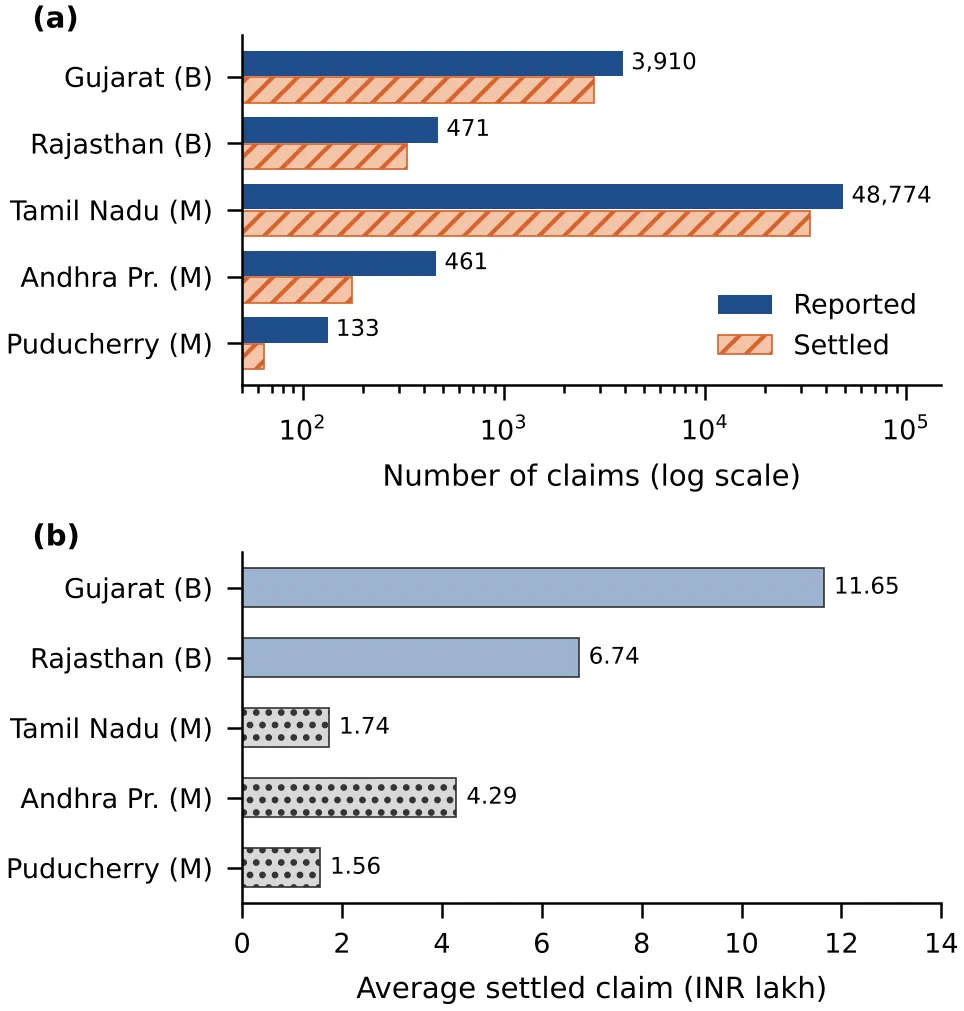
Figure None: 4: Cyclones Biparjoy (B) and Michaung (M) by State: (A) Claims Reported and Settled (Log Scale) and (B) Average Settled Claim. Source: GI Council Yearbook 2023-24 [20].
4.5. State Panel: Does Insurance Demand Respond?
Table 6 reports the two-way fixed-effects estimates of Eq. (3). None of the disaster coefficients is significant. In model (1), fire premium in an affected state is about 6% lower in the event year than its own trend and the national year effect would predict, but with wide uncertainty (p = 0.338). A positive but insignificant lag term is compatible with repricing or a demand response one year later. Separating perils, major floods carry a larger negative coefficient than cyclones (−0.210 against 0.025), again without significance. The EM-DAT measure, under which 216 of 396 state-years were affected, leads to the same conclusion, and the fire share of total premium does not respond to any measure.
Table None: 6: Two-way Fixed-Effects Estimates for Ln Fire GDPI of States and Union Territories, 2014-15 To 2024-25
| Variable | (1) | (2) | (3) | (4) | (5) |
|---|---|---|---|---|---|
| Cat event, t | −0.061 | −0.052 | |||
| (0.063) | (0.071) | ||||
| Cat event, t−1 | 0.055 | ||||
| (0.058) | |||||
| Cyclone landfalls | 0.025 | ||||
| (0.051) | |||||
| Major floods | −0.210 | ||||
| (0.137) | |||||
| EM-DAT event, t | −0.005 | ||||
| (0.087) | |||||
| EM-DAT event, t−1 | 0.034 | ||||
| (0.102) | |||||
| EM-DAT count, t | −0.007 | ||||
| (0.020) | |||||
| EM-DAT count, t−1 | 0.017 | ||||
| (0.027) | |||||
| Observations | 391 | 356 | 391 | 356 | 356 |
| R² | 0.929 | 0.925 | 0.929 | 0.925 | 0.925 |
Note: all models include state and year fixed effects; state-clustered standard errors in parentheses. No coefficient is significant at 10%. Source: computed from IRDAI Handbook 2024-25 [21], IMD/RSMC [22] and EM-DAT [23].
The regional difference that does stand out is structural. Fire business is a larger share of general insurance premium in coastal states (median 12.5% against 10.3%; Mann–Whitney p = 0.005), reflecting the concentration of industry, ports and commercial property on the coast, while premium growth rates do not differ (p = 0.421). The geography of disasters also differs from the geography of fire business: Uttar Pradesh, Bihar and Assam, among the states most often affected in EM-DAT, carry a small share of fire premium, whereas the coastal industrial states that dominate fire business face mainly cyclone risk.
4.6. Discussion
Taken together, the results support H1 in part. H01 is rejected for claim severity and for the year-to-year level of the claims ratio, but not for a long-run trend or for state-level insurance demand. Three points deserve comment. First, the choice of hazard measure matters. Landfall counts, the measure most often cited in industry commentary, showed no association with claims, whereas a broader count of disasters did. This is consistent with the argument that a narrow, peril-specific historical record is a poor basis for anticipating losses [18], and with evidence that floods and other secondary perils now generate a large share of insured losses [35]. Second, the effect operates mainly through severity, and the event comparison shows that severity depends on what is struck. This matches Bouwer's finding that the exposed asset base, not the hazard alone, drives losses [14], and the threshold behaviour reported by Lyubchich and Gel [11]. Third, the absence of a long-run upward trend contrasts with the steady rise of insured catastrophe losses in mature markets [5], [35]. In India, rapid premium growth and the transfer of large risks to reinsurers appear to have kept claims ratios in check, and the negative lagged correlations suggest that insurers reprice after bad years, as observed in other markets [13], [12].
The findings also carry a practical message. Because catastrophe years raise severity more than frequency, claims capacity after an event depends on the ability to assess and settle large commercial losses quickly, while urban floods such as Michaung create a surge of small claims that strains settlement capacity instead. Insurers and the regulator could use the annual EM-DAT count, which is freely available, as a simple early indicator of claims pressure in the fire account.
The study has limitations. The fire line mixes catastrophe and ordinary fire claims, which weakens national tests. The national series has 15 observations, so the regression estimates are indicative. District claims exist for one year only, state-wise claims are not published, and EM-DAT records smaller events incompletely. The design is observational, and the results are associations rather than causal effects.
CONCLUSION
This study examined how climate-related disasters influence property insurance claims in India, using the fire line as a proxy and three levels of analysis over 2010-11 to 2024-25. Years with more disasters had significantly higher fire claims ratios: each additional event raised the gross ratio by about 2.0 percentage points and the net ratio by 1.3 points once the trend was controlled, whereas cyclone landfall counts alone showed no association. In the catastrophe year 2023-24 the average paid property claim rose by about two-fifths while frequency barely changed, and the two cyclones of that year produced average settled claims of INR 11.1 lakh and 1.75 lakh, reflecting an industrial coast and an urban flood. Disasters did not produce a lasting upward trend in claims ratios or a measurable change in state fire premium. Disaster frequency therefore raises the cost of property claims in the year it occurs, and the nature of the exposed property determines whether the burden falls on severity or on volume. Future work should use peril-wise and state-wise claims, if the regulator publishes them, to separate catastrophe losses from ordinary fire claims and to extend the event analysis to other years.
DECLARATIONS
Acknowledgement:
The authors acknowledge the Insurance Regulatory and Development Authority of India (IRDAI), the General Insurance Council, the India Meteorological Department / RSMC New Delhi, and the EM-DAT international disaster database (CRED, UCLouvain) for making the underlying insurance statistics, cyclone records, and disaster-event data publicly available. This article develops work originating in the author’s ongoing doctoral thesis on climate-driven catastrophic events and property insurance claims trends in India, with subsequent revisions and extensions to the data compilation, analytical methods, and validation checks reported here.
Author Contribution:
Harshit Upadhyay conducted the study, carried out the research and data collection, performed the formal analysis, prepared the visualizations, ensured the reproducibility of the research, and drafted and revised the manuscript. Ghanshyam Saini supervised the research, provided scientific and methodological guidance, and critically reviewed and edited the manuscript.
Data Availability Statement: The data analysed are publicly available in the IRDAI Handbook on Indian Insurance Statistics 2024-25, the IRDAI Annual Report 2024-25, the GI Council Indian Non-Life Insurance Industry Yearbooks 2019-20 to 2024-25 and EM-DAT (free registration required). The compiled insurer panel, the data-gap register and the Python scripts are available from the corresponding author on reasonable request.
Conflict of Interest:
The authors declare that they have no known competing financial interests or personal relationships that could have appeared to influence the work reported in this paper.
REFERENCES

Harshit Upadhyay, Dr. Ghanshyam Saini, Climate-Related Disasters and Property Insurance Claims in India: National, Event-Level and State Panel Evidence, Int. J. Sci. R. Tech., 2026, 3 (11), 680-691. https://doi.org/10.5281/zenodo.24216909
 10.5281/zenodo.24216909