

We use cookies to ensure our website works properly and to personalise your experience. Cookies policy
Lords Business School, Lords University, Alwar, Rajasthan, India
Indian insurers rely on reinsurance and regulation to absorb climate catastrophe losses, but whether these instruments stabilise claims has not been tested. This study assessed whether reinsurance, insurer strategy and the 2021 standard fire products stabilised the fire (property) claims experience of Indian general insurers, and audited the public data needed to model catastrophe claims. A national series for 2010-11 to 2024-25, industry underwriting accounts and an insurer panel of 24 companies (203 insurer-years) were analysed with paired, variance and rank tests and fixed-effects regressions. Net retention of fire premium fell from 54.2% to 29.2%. The net incurred claims ratio (ICR) exceeded the gross ratio in every year (paired t = 8.25, p < 0.001), and its coefficient of variation was lower (0.131 against 0.205), but the variances did not differ significantly (Levene p = 0.673). Across insurers, average retention was unrelated to claims volatility (Spearman ? = ?0.02, p = 0.942), and within insurers retention had no significant effect on the ICR. Public sector insurers carried higher claims ratios than private insurers (median 76.7% against 55.4%) with similar volatility. After the 2021 standard products, mean gross ICR fell but volatility rose, neither significantly. In 2023-24 the retained underwriting surplus fell from 1,801 to 137 crore Indian rupees. Insured losses covered 8.8% of economic damage in the 15 events with both figures, and the audit found 11 material data gaps. Reinsurance shifts catastrophe losses without measurably stabilising claims.
When catastrophes become more frequent, the question for an insurer is not only how large its claims will be but who will bear them and how predictable they will be. Primary insurers answer that question mainly through reinsurance, which caps the losses they retain, and increasingly through capital-market instruments that pass extreme risks to investors [1], [2]. Regulators shape the answer through solvency rules, disclosure requirements and product design [3], [4]. Whether these instruments actually make claims experience more stable is an empirical question, and it matters most where hazard exposure is high and insurance penetration is low.
India is such a market. Global reinsurers estimate that most natural catastrophe losses worldwide remain uninsured [5], and the gap is far wider in India than in mature markets [6]. The country's fire insurance business, which covers storm, cyclone, flood and inundation as allied perils and therefore serves as its property line, has grown rapidly since 2010. Over the same period insurers have ceded an ever larger share of fire premium to reinsurers, and from 1 April 2021 the Insurance Regulatory and Development Authority of India (IRDAI) required general insurers to offer three standard fire products for homes and micro and small enterprises [7]. These changes are often presented as means of strengthening resilience to climate risk, but their effect on the stability of claims has not been measured.
A second obstacle concerns data. Forward-looking catastrophe models need hazard, exposure and claims information at a fine spatial and temporal resolution [8], and parametric products need objective, reliable indices [9], [10]. How far the public Indian data meet these requirements is not documented. This paper therefore pursues two aims: to test whether reinsurance, insurer strategy and the 2021 standard products have stabilised the fire claims experience of Indian general insurers, and to identify the gaps in public hazard and claims data that prevent the accurate prediction of catastrophe claims. Its contributions are an insurer-level test of the link between reinsurance reliance and claims volatility, a before-and-after comparison around the 2021 products, an estimate of the insured share of catastrophe losses from event data, and a structured audit of the public data. Section 2 reviews the literature, Section 3 sets out the methods, Section 4 presents and discusses the results, and Section 5 concludes.
2. LITERATURE REVIEW
2.1. Risk Transfer as a Stabiliser
Reinsurance has long been the main instrument through which primary insurers protect their capital against accumulated catastrophe losses. Cummins and Weiss traced how rising catastrophe severity and inefficiencies in the underwriting cycle drove the growth of hybrid and securitised risk transfer alongside traditional reinsurance [1]. Dionne and Desjardins showed that the capacity of an insurance market to pay very large losses depends on how its capital is structured relative to correlated exposures, and especially on access to reinsurance [2]. Kunreuther and Michel-Kerjan argued that risk transfer must be combined with longer-term contracts and mitigation incentives if large-scale catastrophe risk is to remain insurable [11], and Clarke and Dercon showed for developing countries that pre-arranged, layered finance shortens recovery compared with post-disaster borrowing or aid [12]. Gatzert and Özdil warned that climate shocks can strike the asset and liability sides of a non-life insurer together, weakening the diversification that reinsurance arrangements assume [13].
2.2. Regulation, Product Design and Disclosure
Regulation can support or hinder the supply of catastrophe cover. Born and Klimaszewski-Blettner found that restrictions on risk-based pricing reduced the willingness of United States property insurers to keep writing business after disasters [14]. Mandatory climate-risk disclosure reached most property premiums in the United States but left out many small and less diversified insurers [3], and insurers improved their climate-risk management mainly after experiencing disasters in their home state [15]. Standardised and index-based products are another regulatory lever. They lower transaction costs and speed up settlement, but they create basis risk, the mismatch between payout and actual loss [16], [9], [17]. Surminski et al. argued that insurance supports climate resilience only when it is linked to risk reduction rather than treated purely as compensation [4].
2.3. The Protection Gap and the Data Problem
The protection gap, the share of economic loss that is not insured, is the clearest measure of how far risk transfer falls short. Bellia et al. showed that raising flood insurance penetration materially reduces the fiscal burden of floods, at a quantifiable cost in premium [18], while evidence from the United States flood programme shows that cover often lapses within a few years of purchase [19]. Closing the gap requires reliable data. Steptoe et al. argued that catastrophe modelling is moving from purely statistical representations of past losses towards physically based, open models that need detailed exposure and claims information [8]; satellite-based flood indices offer a route for regional parametric cover where ground data are scarce [10]. Government-supported schemes in developing countries have often been weakened by poor data and slow payouts [20].
Two gaps follow for India. The effect of reinsurance and regulation on the stability of property claims has not been tested with Indian insurer data, and the adequacy of public data for catastrophe modelling has not been documented. The study therefore tests two hypotheses. H2: IRDAI guidelines and insurer strategies significantly improve the management and stability of property insurance claims under climate risk (null H02: they do not). H3: gaps in hazard data, catastrophe modelling and claims loss estimation significantly obstruct the accurate prediction and assessment of property claims trends (null H03: they do not).
METHODOLOGY
3.1. Data
The study uses published secondary data only (Table 1). The fire line was used as the proxy for property insurance because neither the regulator nor the General Insurance Council (GI Council) reports a separate property line. The national series covers the financial years (April to March) 2010-11 to 2024-25. The insurer panel was built from the regulator's handbook for public and private general insurers; standalone health insurers and specialised public insurers that write no fire business were excluded, as were insurer-years with fire gross direct premium income (GDPI) below 10 crore Indian rupees (INR; one crore = 10 million), net earned premium below INR 5 crore, or a retention proxy above 1.5, because very small portfolios produce meaningless ratios.
Table None: 1: Data Sets Used in the Analysis
| Data set | Unit and period | n | Source |
|---|---|---|---|
| National fire series (ICR, retention) | India, FY 2010-11 to 2024-25 | 15 | GI Council [21] |
| Fire underwriting accounts | India, FY 2020-21 to 2024-25 | 5 | GI Council [21] |
| Insurer fire panel | Insurer × year, 2015-16 to 2024-25 | 203 | IRDAI [22] |
| Insured and economic loss | Event, 2000–2025 | 15 | EM-DAT [23] |
| Documentary sources | Reports and tables, 2019–2026 | – | [22], [24], [21] |
Note: FY = financial year; ICR = incurred claims ratio. The insurer panel covers 24 public and private general insurers after exclusions.
3.2. Measures
The gross incurred claims ratio (ICR) is gross incurred claims divided by gross earned premium, and the net ICR is net incurred claims divided by net earned premium. The industry net retention ratio is net written premium divided by gross written premium. Insurer-wise fire retention is not published annually, so a proxy was constructed:
RPit = NEPit/GDPIit
(1)
where NEPit and GDPIit are the fire net earned premium and fire gross direct premium of insurer i in year t. A low value indicates that more of the fire premium is ceded. Claims volatility was measured by the standard deviation s of the ICR and by its coefficient of variation:
CV = s/x̄
(2)
where x̄ is the mean ICR over the period or over an insurer's years.
3.3. Statistical Analysis
The difference between gross and net ICRs was tested with the paired t-test and the Wilcoxon signed-rank test [25], and the equality of their variances with Levene's test [26] and a variance-ratio F-test. Trends in retention were tested by OLS on a time index and by the Mann–Kendall test [27], [28], and the three five-year periods were compared with the Kruskal–Wallis test [29]. Public and private insurers were compared with the Mann–Whitney U test [30]. At insurer level, the fire net ICR was regressed on the retention proxy:
ICRit = αi + β1RPit + β2Lt + β3(RPit×Lt)+ β4ln GDPIit + εit
(3)
where αi is an insurer fixed effect, Lt is the number of named cyclones making landfall in India and ln GDPIit is the logarithm of the insurer's total premium. One specification added year fixed effects, and a pooled specification added a public-sector indicator. Standard errors were clustered by insurer [31], [32]. The central question, whether insurers that cede more business have more stable results, was examined by correlating, with Spearman's ρ [33], each company's mean retention proxy with the dispersion of its ICR, and by contrasting companies on either side of the median retention.
The effect of the 2021 standard products was examined by comparing the means and CVs of the claims ratios for 2015-16 to 2020-21 (six years) with 2021-22 to 2024-25 (four years). The protection gap was measured as the insured share of economic damage for every Indian climate-related event in EM-DAT that reports both values [23]. Data gaps were assessed with a structured matrix that records, for each variable a catastrophe-claims analysis requires, its public availability, its consistency across sources and the consequence of its absence; each entry refers to a specific source and table [22], [24], [21]. All tests were two-tailed at 5%. Analyses used Python with SciPy [34] and statsmodels [35].
RESULTS AND DISCUSSION
4.1. Reinsurance and the Gross–Net Gap
Fig. 1 shows that fire insurers retained 54.2% of gross written premium in 2010-11 but only 29.2% in 2024-25. The decline is steady (about 2.0 percentage points a year; Mann–Kendall τ = −0.943, p < 0.001) and differs strongly across the three five-year periods (means 52.3%, 41.7% and 32.5%; Kruskal–Wallis H = 12.02, p = 0.002). Most fire risk in India is now carried by reinsurers.
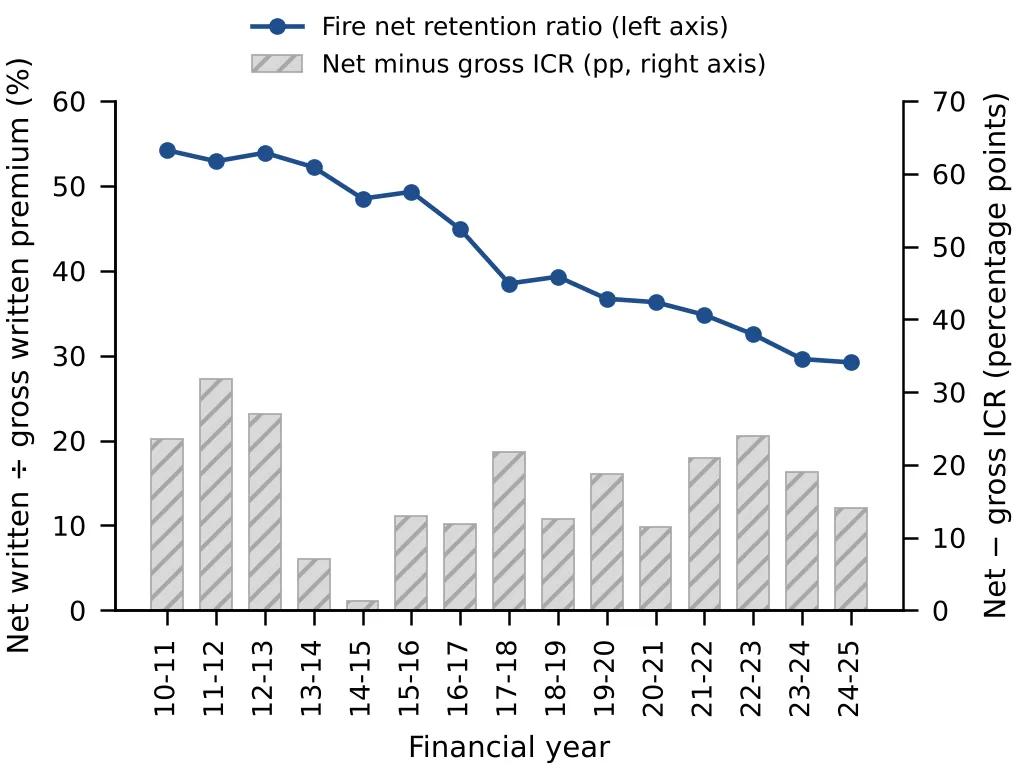
Figure None: 1: Fire Net Retention Ratio and the Difference Between Net and Gross Incurred Claims Ratios, 2010-11 to 2024-25. Source: Computed from GI Council Yearbooks [21].
Table 2 tests what this shift has done to the claims experience. The net ICR exceeded the gross ICR in all 15 years, by 17.2 points on average, and the difference is highly significant. Cedants pass on proportionally more premium than losses, because the big commercial and industrial accounts that reinsurers absorb run at lower loss ratios than the retail and small-business books that stay with the primary insurer. Net results were less volatile than gross results, as reinsurance theory predicts, but the reduction in variance was not statistically significant. Retention was positively but not significantly correlated with the net ICR (r = 0.40, p = 0.138).
Table None: 2: Gross Versus Net Fire ICR, 2010-11 to 2024-25 (N = 15)
| Statistic | Gross ICR | Net ICR | Test (p) |
|---|---|---|---|
| Mean (%) | 59.9 | 77.1 | Paired t = 8.25 (<0.001) |
| Median difference | – | – | Wilcoxon W = 0 (<0.001) |
| Standard deviation (pp) | 12.3 | 10.1 | Levene F = 0.18 (0.673) |
| Coefficient of variation | 0.205 | 0.131 | Variance ratio F = 1.47 (0.478) |
Note: pp = percentage points. Source: computed from GI Council yearbooks 2019-20 and 2024-25 [21].
4.2. Underwriting Results in a Catastrophe Year
The fire underwriting accounts for 2020-21 to 2024-25 show how far reinsurance protected insurers when catastrophes struck (Table 3). In 2023-24, the year of Cyclones Biparjoy and Michaung, gross direct claims nearly doubled, from INR 9,735 crore to INR 18,202 crore, and the gross underwriting surplus fell from INR 8,773 crore to INR 3,313 crore. The net surplus, which insurers bear themselves, fell from INR 1,801 crore to only INR 137 crore, or 1.5% of net earned premium, before recovering to 9.3% in 2024-25. Even with about 70% of premium ceded, the retained fire account came close to break-even in a single bad year.
Table None: 3: Fire Underwriting Experience of the Industry, 2020-21 To 2024-25
| FY | GWP (INR cr) | Gross claims (INR cr) | Net ICR (%) | Retention (%) | Net UW surplus (% NEP) |
|---|---|---|---|---|---|
| 2020-21 | 23,679 | 11,799 | 67.1 | 36.3 | 8.4 |
| 2021-22 | 25,643 | 10,058 | 65.1 | 34.8 | 7.3 |
| 2022-23 | 28,543 | 9,735 | 58.0 | 32.5 | 20.2 |
| 2023-24 | 30,697 | 18,202 | 78.3 | 29.6 | 1.5 |
| 2024-25 | 28,896 | 17,067 | 73.1 | 29.2 | 9.3 |
Note: GWP = gross written premium; gross claims = gross direct claims; UW = underwriting; NEP = net earned premium. Source: GI Council yearbook 2024-25, Tables 22.1.A and 22.1.B [21]; ratios computed by the authors.
4.3. Public and Private Insurers
The four public sector insurers carried a much higher fire claims ratio than private insurers (Table 4), a highly significant difference. A likely reason is that public insurers hold older and larger industrial portfolios. The dispersion of the ratio, however, was similar in the two sectors, and both moved together in the catastrophe years 2018-19 and 2023-24. Differences in strategy therefore change the level of losses but not their sensitivity to events.
Table None: 4: Fire Net ICR of Public and Private Sector Insurers, 2014-15 To 2024-25
| Statistic | Public sector | Private sector |
|---|---|---|
| Insurer-years | 44 | 138 |
| Median fire ICR (%) | 76.7 | 55.4 |
| Mean fire ICR (%) | 80.6 | 55.5 |
| Standard deviation (pp) | 19.8 | 21.0 |
| Median of insurer-level SD (pp) | 21.6 | 19.0 |
Note: insurer-years with fire NEP of at least INR 25 crore. Mann–Whitney U = 4900, p < 0.001; Levene F = 0.61, p = 0.435. Insurer-level SD uses insurers with at least eight years of data. Source: computed from IRDAI Handbook 2024-25 [22].
4.4. Retention and Claims Volatility across Insurers
The retention proxy of Eq. (1) averaged 33.0% (SD 21.9%) across the 203 insurer-years. Table 5 reports the regressions of Eq. (3). In the pooled model, a higher retention proxy is associated with a lower fire ICR and public insurers have a claims ratio about 43 points higher than private insurers. The pooled association reflects who the insurers are rather than what retention does: with insurer fixed effects, which compare each company only with its own history, the coefficient loses significance (p = 0.224). Nor does retention amplify cyclone years, since the retention-by-landfall term is far from significant (p = 0.751).
Table None: 5: Insurer-level Regressions of Fire Net ICR on the Retention Proxy, 2015-16 To 2024-25
| Variable | (1) FE | (2) FE | (3) FE + year | (4) Pooled |
|---|---|---|---|---|
| Retention proxy | −0.153 | −0.192 | −0.155 | −0.599** |
| (0.126) | (0.163) | (0.168) | (0.240) | |
| Cyclone landfalls | −0.006 | −0.007 | – | −0.034* |
| (0.015) | (0.016) | (0.018) | ||
| Retention × landfalls | – | 0.024 | 0.004 | 0.028 |
| (0.075) | (0.079) | (0.065) | ||
| Public sector (1/0) | – | – | – | 0.434*** |
| (0.090) | ||||
| ln total GDPI | −0.089 | −0.087 | −0.161* | 0.027 |
| (0.057) | (0.055) | (0.084) | (0.034) | |
| Observations | 203 | 203 | 203 | 203 |
| R² | 0.417 | 0.417 | 0.527 | 0.222 |
Note: FE = insurer fixed effects. Retention proxy centred; ICR as a fraction. Insurer-clustered standard errors in parentheses. * p < 0.01, p < 0.05, * p < 0.10.
The direct test is shown in Fig. 2 and Table 6. Heavier cession does not buy steadier results: across insurers, the rank correlation of mean retention with ICR dispersion is essentially nil, and high- and low-retention groups are equally volatile. In Fig. 2 the widest swings belong to small private writers that pass on most of their fire premium, while the public insurers keep the largest shares and sit near the middle of the volatility range. Indian fire reinsurance therefore looks like a purchase of capacity for big industrial risks, not a device for smoothing the cedant's annual results.
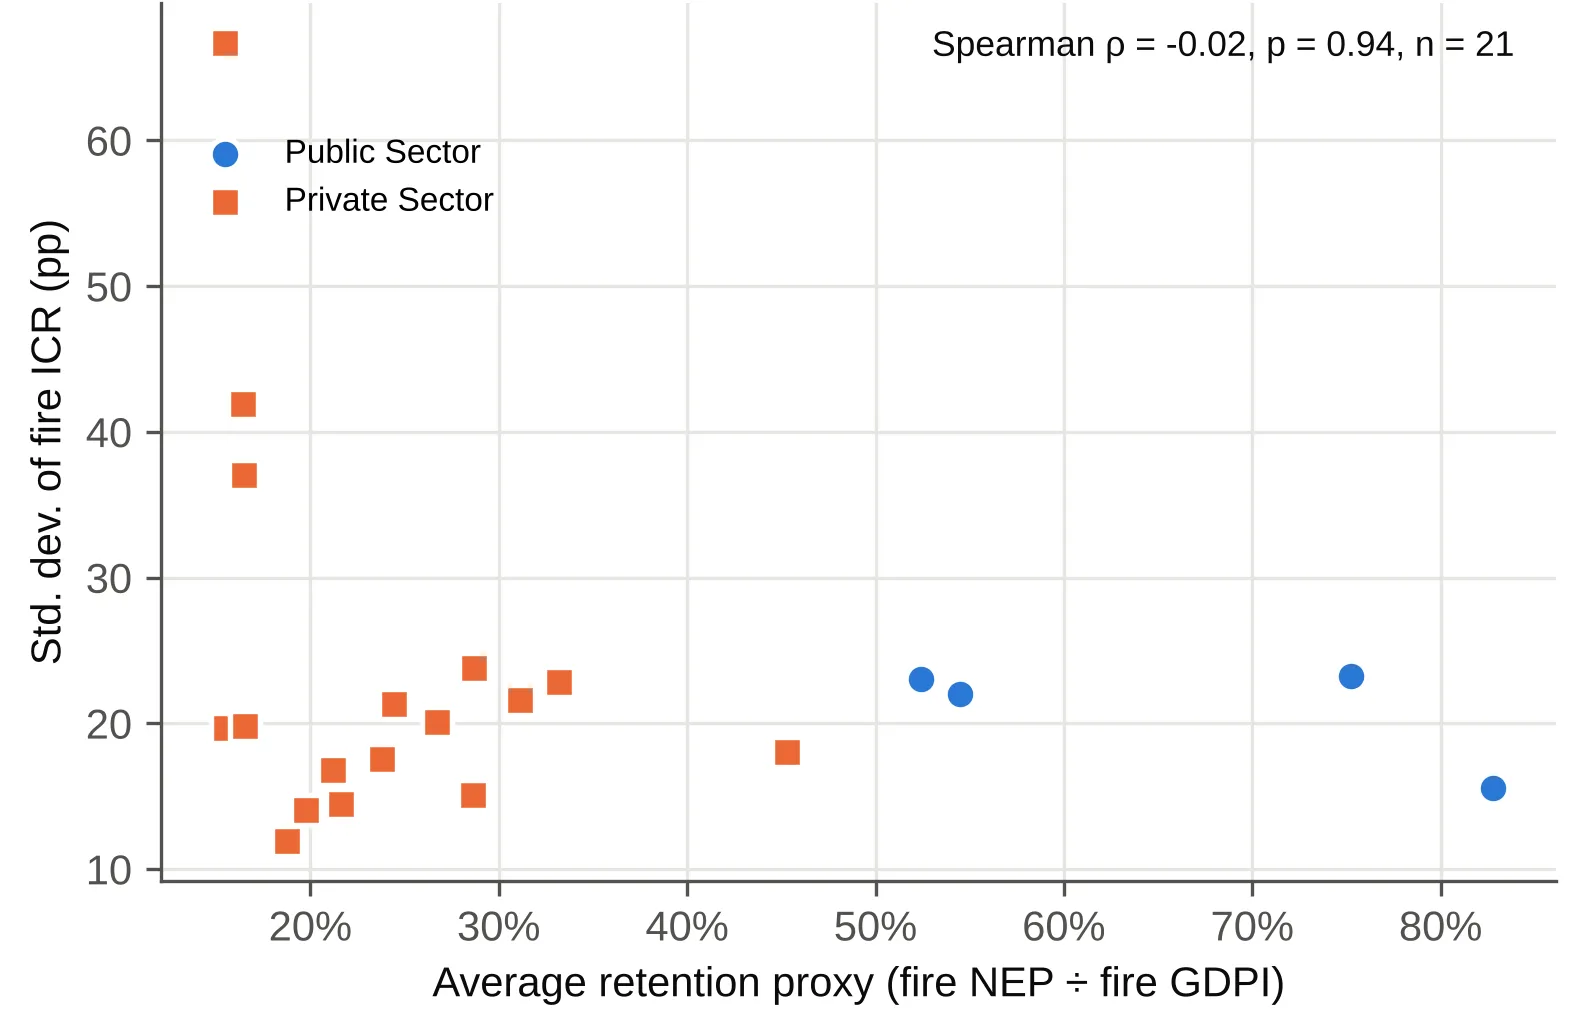
Figure None: 2: Average Retention Proxy and Standard Deviation of the Fire Net Incurred Claims Ratio for 21 Insurers with at Least Six Years of Data, 2015-16 to 2024-25 (Circles: Public Sector; Squares: Private Sector). Source: Computed from IRDAI Handbook 2024-25 [22].
Table None: 6: Fire ICR Volatility of Insurers with High and Low Retention
| Statistic | High retention | Low retention |
|---|---|---|
| Insurers (≥ 6 years of data) | 10 | 11 |
| Median insurer SD of ICR (pp) | 21.8 | 19.7 |
| SD of within-insurer deviations (pp) | 19.7 | 26.3 |
Note: split at the median average retention proxy (24.4%). Spearman ρ between average retention and ICR SD = −0.02, p = 0.942 (n = 21); Mann–Whitney U = 66, p = 0.460; Levene F = 0.91, p = 0.342.
4.5. Before and After the 2021 Standard Fire Products
Table 7 compares the four years after the introduction of the standard products with the six years before. Average gross claims ratios dropped after the reform without reaching significance, and dispersion increased instead of narrowing. The only significant change is the continued fall in retention. Four post-reform observations, including a catastrophe year, are too few to attribute any change in stability to the standard products.
Table None: 7: Fire Claims Experience Before (2015-16 to 2020-21) and After (2021-22 to 2024-25) the Standard Products
| Indicator | Mean pre | Mean post | CV pre | CV post | MW p | Levene p |
|---|---|---|---|---|---|---|
| Gross ICR | 64.6% | 49.2% | 0.135 | 0.250 | 0.067 | 0.352 |
| Net ICR | 79.4% | 68.6% | 0.103 | 0.130 | 0.114 | 0.787 |
| Net retention | 40.8% | 31.5% | 0.127 | 0.083 | 0.010 | 0.469 |
Note: MW = Mann–Whitney U test; pre-period n = 6, post-period n = 4. Source: computed from GI Council yearbooks [21].
4.6. The Protection Gap
EM-DAT reports insured damage for only 15 Indian climate-related disasters since 2000 (Fig. 3). Across them, insured losses of about US$7.4 billion covered 8.8% of economic damage of US$83.5 billion, and the median event had 11.7% insured. The share varied widely: about 45% for the June 2013 floods centred on Uttarakhand and about one-third for the 2015 Chennai floods, but only 0.9% for the 2014 Jammu and Kashmir floods and 2.0% for the multi-state monsoon floods of 2019. These figures are consistent with industry estimates that the great majority of catastrophe losses in emerging markets are uninsured [5], and they show that reinsurance, however extensive, operates on a small insured base.
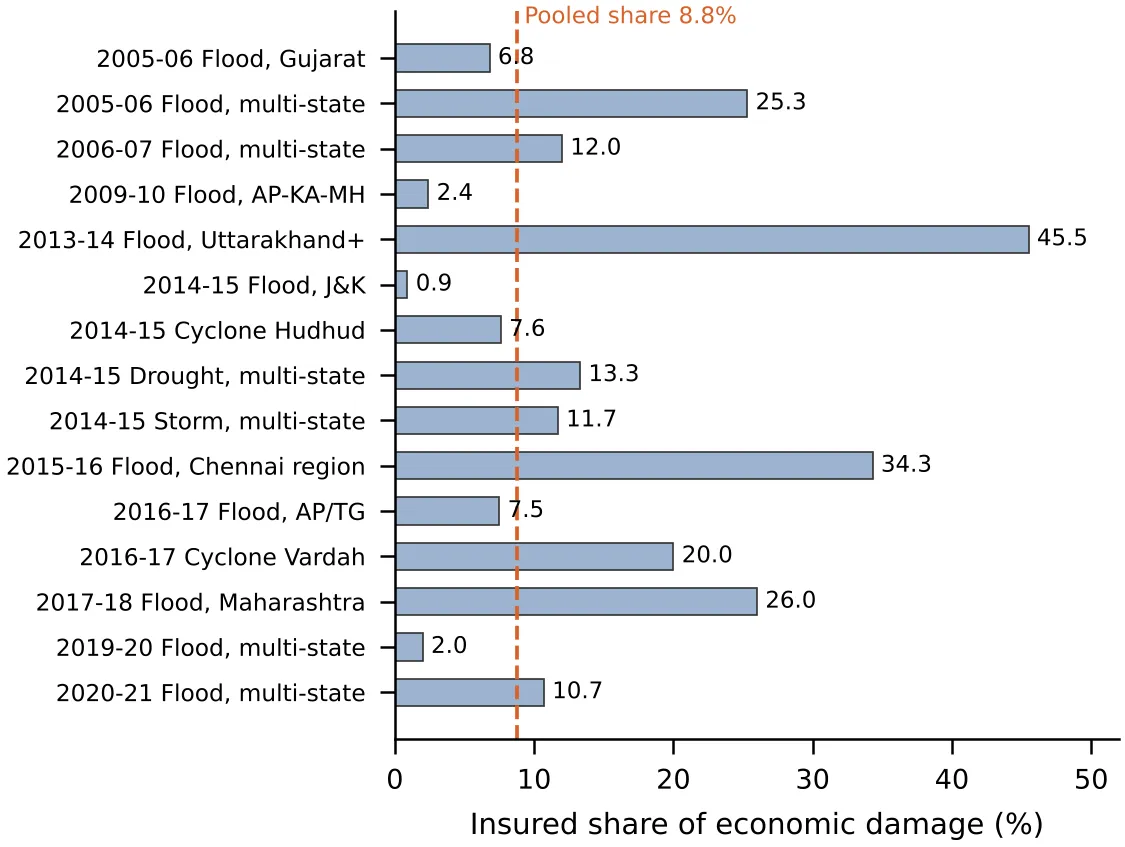
Figure None: 3: Insured Share of Economic Damage for the 15 Indian Climate-Related Disasters for Which EM-DAT Reports Both Values, 2000–2025 (CPI-adjusted Us$). Source: EM-DAT [23].
4.7. Gaps in Public Hazard and Claims Data
Table 8 summarises the data audit. Eleven material gaps were found. Three matter most. First, the published statistics do not distinguish catastrophe losses from attritional fire claims, which dilutes event signals in every national ratio. Second, claims are not published by state, so regional analysis must rely on premium. Third, official sources disagree: the fire net ICR for 2019-20 is 78.1% in the GI Council yearbook and 90.0% in the IRDAI handbook, and the regulator's handbook, its annual report and the yearbook each print a different fire premium total for 2024-25. District catastrophe claims exist for one year only, and no catastrophe section was published for 2024-25, the year of Cyclones Remal, Dana and Fengal and the Wayanad landslides.
Table None: 8: Data-gap Matrix for Predicting Property Claims Under Climate Risk
| Variable required | Public availability, 2010–2025 | Consequence |
|---|---|---|
| Catastrophe vs ordinary claims | Not published | Event effects diluted in national ICR |
| State-wise claims | Ranges in yearbook maps only | Regional models must use premium |
| Event-level insured claims | Two events, FY 2023-24 only | No time series of event losses |
| Line-of-business split of event claims | All lines combined | Property share of event claims unknown |
| Fire-only claim counts | Fire plus engineering, from 2019-20 | Frequency analysis descriptive only |
| Consistent official figures | Net ICR 2019-20: 78.1% vs 90.0%; three premium totals for 2024-25 | Results depend on source choice |
| Insured vs economic loss | EM-DAT: damage for 111 of 394 events, insured for 15 | Protection gap measurable for few events |
| Landfall and hazard database | No open state-year dataset | Hazard variables built manually |
| Settlement time | Not published | Speed of settlement cannot be assessed |
| Monthly segment premium | Segment-wise only from January 2024 | No monthly series for time-series models |
| Insurer-wise fire retention | Quarterly company disclosures only | Proxy required (Eq. (1)) |
Source: authors’ review of IRDAI Handbook 2024-25, IRDAI Annual Report 2024-25, GI Council yearbooks 2019-20 to 2024-25 and IMD/RSMC records [22], [24], [21], [36].
At least three of these gaps prevented analyses that a catastrophe-claims study would normally include: a series of catastrophe losses alone, claims models at state level, and event studies spanning several years. With 15 annual observations and no monthly fire series, forecasting models such as ARIMA or machine-learning predictors could not be estimated reliably, and reporting their accuracy would have had no meaning.
4.8. Discussion
On this evidence H02 cannot be rejected in its stability form. Reinsurance clearly reshapes the fire account: insurers now cede about 70% of premium, and net results differ significantly from gross results. But the reduction in volatility from gross to net is not significant, insurers that cede more do not have steadier results, the 2021 products were not followed by greater stability, and the two ownership groups differ in loss level but not in dispersion. These findings fit the view that reinsurance in emerging markets is primarily a source of capacity for large risks [1], [2], and they echo evidence that insurers adapt their risk management mainly after loss experience [15]. The near break-even of the retained account in 2023-24 also shows that heavy cession does not remove the exposure of the ceding insurer to correlated catastrophe losses [13], [11].
H03, by contrast, is rejected in substance: the documented gaps directly obstructed the prediction of claims trends. This matters for policy. Calls for forward-looking catastrophe models and parametric products [8], [9], [17] presuppose peril-wise, spatially explicit and timely claims data, which the public Indian record does not provide. Mandatory, peril-wise and state-wise reporting of catastrophe claims, a standing catastrophe section in the industry yearbook and reconciliation of the regulator's and the industry's figures would cost little and would enable the modelling that disclosure regimes elsewhere are designed to support [3]. The small insured share of losses also suggests that the main policy challenge is penetration rather than risk transfer by insurers [18], [6].
The study has limitations. The retention proxy is based on earned rather than written premium, the national series is short, and only four post-reform years were available. The data audit reflects public sources only; insurers and reinsurers hold richer internal data. The results are associations and do not identify causal effects of reinsurance or regulation.
CONCLUSION
This study tested whether reinsurance, insurer strategy and the 2021 standard fire products have stabilised the property claims experience of Indian general insurers, and audited the public data needed to model catastrophe claims. Fire retention fell from 54.2% to 29.2% over 15 years and net claims ratios exceeded gross ratios in every year, but the lower volatility of net results was not significant, average retention was unrelated to claims volatility across 21 insurers, and claims volatility did not fall after the 2021 products. In the catastrophe year 2023-24 the retained underwriting surplus fell to INR 137 crore, and only 8.8% of economic damage was insured in the events with both figures. Eleven material data gaps, led by the absence of peril-wise and state-wise claims, prevented reliable prediction. Reinsurance therefore changes who bears catastrophe losses without making claims measurably more stable, and better public data are a precondition for climate-adaptive pricing and product design. Future work should use insurers' internal claims and treaty data to measure the stabilising effect of specific reinsurance structures and to evaluate parametric pilots.
DECLARATIONS
Acknowledgement:
The authors acknowledge the Insurance Regulatory and Development Authority of India (IRDAI), the General Insurance Council, the India Meteorological Department / RSMC New Delhi, and the EM-DAT international disaster database (CRED, UCLouvain) for making the underlying insurance statistics, cyclone records, and disaster-event data publicly available. This article develops work originating in the author’s ongoing doctoral thesis on climate-driven catastrophic events and property insurance claims trends in India, with subsequent revisions and extensions to the data compilation, analytical methods, and validation checks reported here.
Author Contribution:
Harshit Upadhyay conducted the study, carried out the research and data collection, performed the formal analysis, prepared the visualizations, ensured the reproducibility of the research, and drafted and revised the manuscript. Ghanshyam Saini supervised the research, provided scientific and methodological guidance, and critically reviewed and edited the manuscript.
Data Availability Statement: The data analysed are publicly available in the IRDAI Handbook on Indian Insurance Statistics 2024-25, the IRDAI Annual Report 2024-25, the GI Council Indian Non-Life Insurance Industry Yearbooks 2019-20 to 2024-25 and EM-DAT (free registration required). The compiled insurer panel, the data-gap register and the Python scripts are available from the corresponding author on reasonable request.
Conflict of Interest:
The authors declare that they have no known competing financial interests or personal relationships that could have appeared to influence the work reported in this paper.
Funding: [Removed for blind review]
REFERENCES

Harshit Upadhyay, Dr. Ghanshyam Saini, Reinsurance, Regulation and Data Gaps in Managing Climate Catastrophe Risk: Evidence from the Indian Fire Insurance Market, Int. J. Sci. R. Tech., 2026, 3 (11), 692-702. https://doi.org/10.5281/zenodo.24216985
 10.5281/zenodo.24216985