
We use cookies to ensure our website works properly and to personalise your experience. Cookies policy
1Department of Geography, School of Earth Science, H.N.B. Garhwal University, Srinagar, Uttarakhand-246174, India.
2Department of Geography, BGR Campus, Hemvati Nandan Bahuguna Garhwal University, Pauri, Uttarakhand- 246001, India.
3Department of Geography, Dronacharya Government College, Gurugram, Haryana-122001.
The Himalayan region is highly vulnerable to climate change, with significant implications for water security and natural hazards. This study conducts a comprehensive trend analysis of climatic variables mean (Tmean), maximum (Tmax), and minimum (Tmin) temperature, and annual precipitation in the Upper Alaknanda River Basin (UARB) over a 44-year period (1981–2024). Using high-resolution gridded data from ERA5 for temperature and CHIRPS for precipitation, the analysis was performed across 13 delineated sub-basins to capture spatial heterogeneity. The non-parametric Mann-Kendall test and Sen’s slope estimator were employed to detect trend significance and magnitude. Results reveal a statistically significant and unanimous warming trend across all sub-basins. The basin-average warming rate is highest for Tmax (+0.037°C/year), followed by Tmean (+0.030°C/year) and Tmin (+0.024°C/year), resulting in total warming of 1.63°C, 1.32°C, and 1.06°C, respectively, over the study period. Conversely, precipitation shows a significant basin-wide decreasing trend of -1.62 mm/year, leading to a total reduction of ~71 mm. However, precipitation trends exhibit considerable spatial variability, with significant declines in the Alaknanda, Khriao Ganga, and Rishi Ganga sub-basins. This combined pattern of rapid warming and drying creates a double stress on the cryosphere, accelerating glacier melt and reducing mass accumulation. These findings provide a robust climatic context for understanding glacial lake expansion and elevated Glacial Lake Outburst Flood (GLOF) risk in this sensitive Himalayan basin.
The Hindu Kush Himalayan (HKH) region, often referred to as the "Third Pole," holds the largest volume of ice outside the polar regions and serves as a vital water source for over a billion people downstream [1,2]. This region is experiencing climate change at an alarming rate, with observed warming exceeding the global average. This phenomenon, known as elevation-dependent warming (EDW), makes high-altitude ecosystems particularly susceptible to even minor shifts in temperature and precipitation [3,4]. The consequences are already visible in the form of accelerated glacier retreat, permafrost degradation, and alterations in river discharge patterns, posing long-term threats to water, energy, and food security [5] .
The Upper Alaknanda River Basin (UARB), located in the Garhwal Himalaya of Uttarakhand, India, is a critical part of the Ganges headwaters. This basin is characterized by a high concentration of glaciers and glacial lakes, making it a natural laboratory for studying climate-cryosphere interactions. The region has also witnessed catastrophic flood events, such as the 2013 Kedarnath disaster, which, while primarily triggered by an extreme precipitation event, highlighted the region's vulnerability to hydrological hazards [6]. More recently, growing concerns have centered on the risk of Glacial Lake Outburst Floods (GLOFs), where moraine-dammed lakes fail catastrophically, releasing large volumes of water and sediment. Understanding the climatic drivers behind glacier melt and lake expansion is therefore not just a scientific pursuit but a critical requirement for disaster risk reduction [7,8].
Previous studies in the western and central Himalaya have documented rising temperatures and variable precipitation trends [9,10]. However, most basin-specific studies have either focused on a single climate variable, used shorter time series, or lacked the spatial resolution needed to capture the complex orographic controls on climate in a rugged terrain like the UARB. Coarse-resolution studies often fail to resolve the climatic heterogeneity that exists between adjacent sub-basins, which can be the difference between a stable and a rapidly growing glacial lake. Furthermore, while temperature trends are generally consistent, precipitation trends in the Himalaya are known to be highly non-uniform and poorly understood, often showing no significant trend or even a slight decline in winter precipitation from western disturbances [11].
This study aims to fill this gap by conducting a detailed, high-resolution climatic trend analysis for the UARB from 1981 to 2024. By subdividing the basin into 13 distinct hydrological sub-basins, this research seeks to achieve the following objectives: (1) to quantify the long-term trends (magnitude and significance) in Tmean, Tmax, Tmin, and annual precipitation using robust non-parametric statistical methods; (2) to map the spatial heterogeneity of these trends across the basin; and (3) to discuss the implications of the observed climatic changes for glacier health and GLOF risk [12]. The central hypothesis is that the UARB is experiencing a statistically significant warming trend, with daytime temperatures (Tmax) rising faster than nighttime temperatures (Tmin), alongside a spatially variable but overall declining precipitation trend. This combination is hypothesized to be a primary driver of negative glacier mass balance and proglacial lake expansion. The novelty of this work lies in its combined use of high-quality ERA5 and CHIRPS datasets, its sub-basin scale of analysis, and its explicit link to cryospheric response and hazard assessment. The findings presented here will provide the essential climatic foundation for subsequent assessments of glacier dynamics and GLOF vulnerability in the region [13].
2. STUDY AREA
The Upper Alaknanda River Basin (UARB) is located in the Chamoli district of Uttarakhand, India, forming the headwater region of the Alaknanda River, one of the two main source streams of the Ganges River (Figure 1). Geographically, the basin extends from approximately 30°15' N to 31°05' N latitude and 79°20' E to 80°05' E longitude. The basin is entirely within the Central Himalaya and is characterized by extremely rugged topography, with elevations ranging from about 1,500 meters above sea level (masl) in the lower valleys to over 7,700 masl at the summit of peaks like Kamet (7,756 m). The terrain is dominated by high Himalayan crystalline rocks, steep slopes, and deep river valleys carved by glacial and fluvial action [6].
For the purpose of this analysis, the UARB was subdivided into 13 hydrological sub-basins, each representing a major tributary system: Chamro, AnderDip, Khulia Garvya, Kagbhusand, Khriao Ganga, Rishi Ganga, Baibala, Kamet, Pushpavati, Nagthvai, Alaknanda (the main stem), Arwa, and Sarasvati. This subdivision is critical for capturing spatial heterogeneity in climatic trends, as the orographic effect of the Himalaya creates significant local variations in precipitation and temperature lapse rates. The region experiences a typical Himalayan climate, dominated by the Indian Summer Monsoon (June-September), which accounts for approximately 70-80% of the annual precipitation. The winter months (December-March) also receive precipitation in the form of snow from western disturbances. The high-altitude zones of the basin are home to numerous glaciers of varying sizes and a growing number of proglacial lakes, making it a highly sensitive region for climate change impact studies and GLOF risk assessment [14].
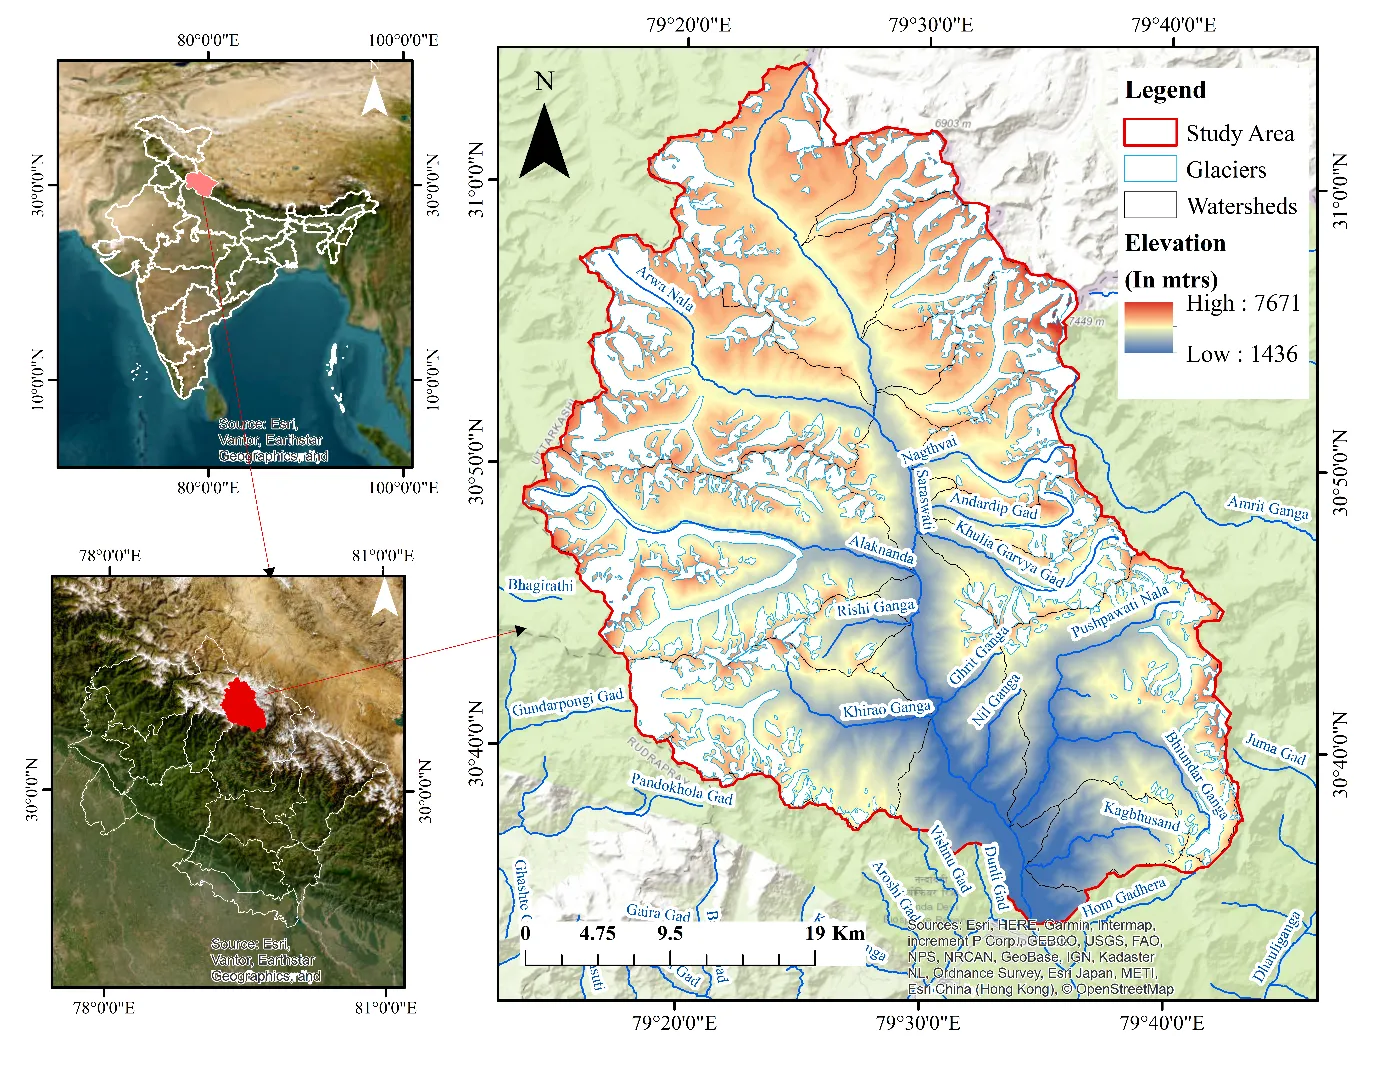
Figure 1. Location Map of the Upper Alaknanda River Basin showing elevation zones and the 13 delineated sub-basins.
3. DATA USED
This study utilizes long-term (1981–2024) gridded climate data from two high-resolution reanalysis and satellite-based products to ensure robustness and spatial coverage in the data-sparse Himalayan region. The data were extracted for the 13 sub-basins using zonal statistics.
3.1 Temperature Data (ERA5)
For temperature analysis, this study employed the ERA5 reanalysis dataset, produced by the European Centre for Medium-Range Weather Forecasts (ECMWF). ERA5 is the fifth generation of ECMWF atmospheric reanalyses and provides a comprehensive, globally gridded estimate of atmospheric variables. It was selected over other products for several critical reasons. First, its high spatial resolution of approximately 0.25° x 0.25° (roughly 28 km) provides a much more detailed representation of temperature variability across the complex, rugged terrain of the UARB compared to coarser products like ERA-Interim. Second, ERA5 has shown superior performance in validating temperature trends against scarce in-situ observations in the Himalayan region, particularly for mean and maximum temperatures [4,15]. Third, its continuous temporal coverage from 1950 to near-real-time allowed for a consistent 44-year analysis period (1981–2024). The specific variables extracted from ERA5 at a monthly temporal resolution were 2-meter mean temperature (Tmean), 2-meter maximum temperature (Tmax), and 2-meter minimum temperature (Tmin). The monthly data were aggregated to create annual time series for each of the 13 sub-basins for the period 1981–2024. While reanalysis data has inherent uncertainties, especially in complex terrain, ERA5's assimilation of a vast number of historical observations makes it the most reliable long-term dataset available for high-altitude regions where meteorological stations are sparse or non-existent. A key advantage is that it provides a physically consistent picture of the atmospheric state, capturing the large-scale warming signal effectively, even if local absolute values may have biases. The annual temperature trends derived from this dataset are presented as grid maps showing the spatial distribution of Tmean, Tmax, and Tmin changes (e.g., Figure 2). These maps visually confirm the unanimous and significant warming across the entire basin, with the strongest warming concentrated in the central and western sub-basins [16–18].
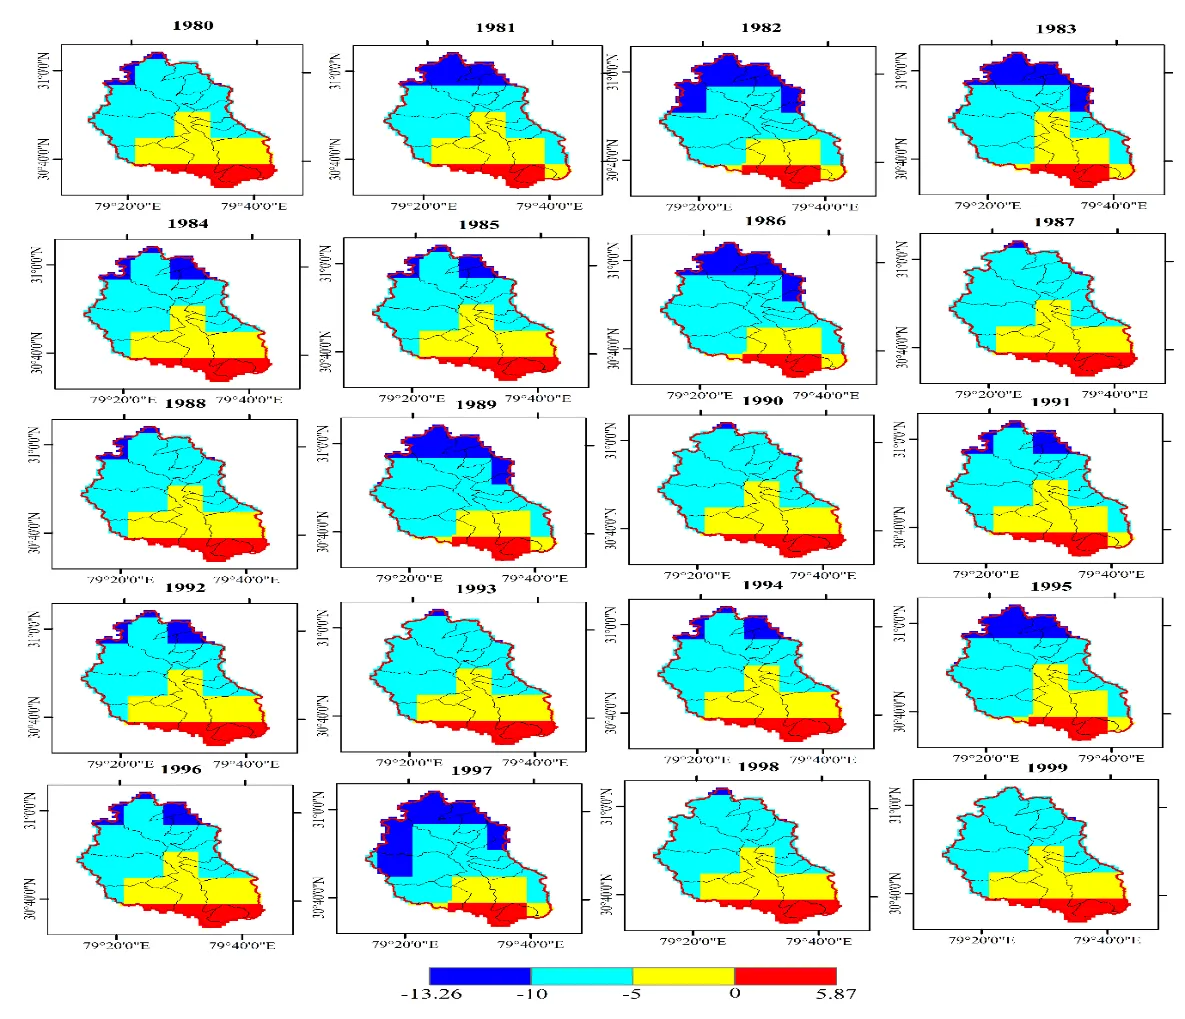
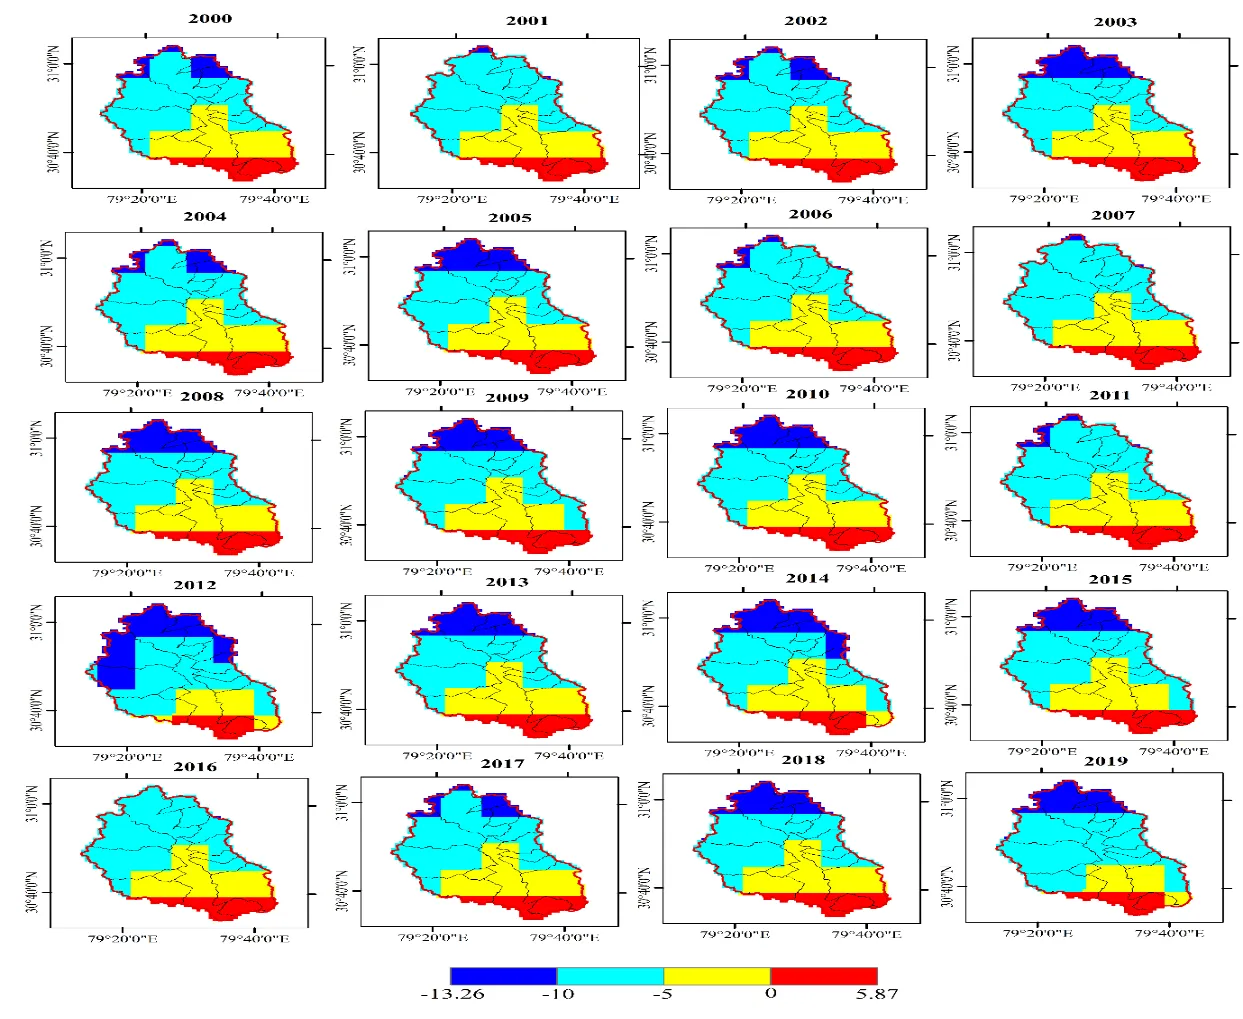
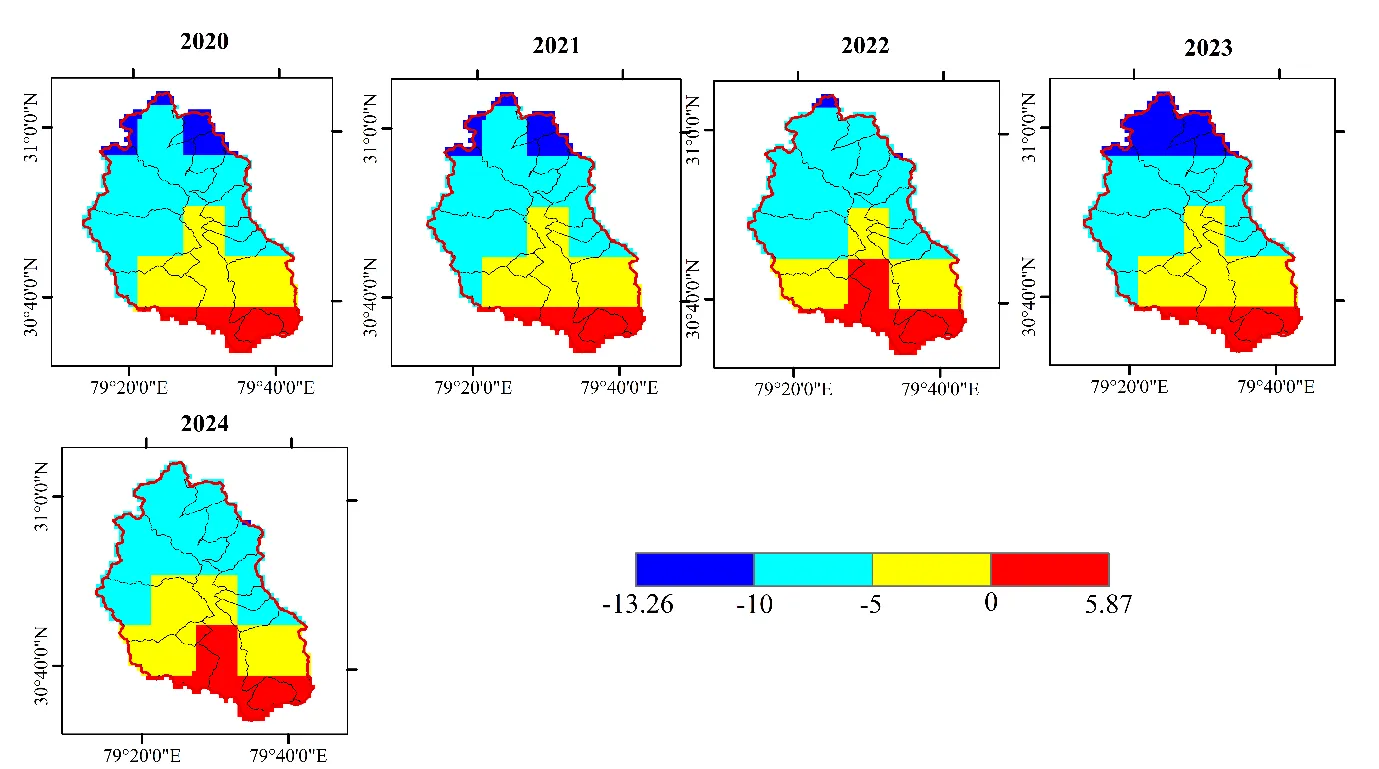
Figure 2. Spatial Grid Maps of Temperature Trends in the Upper Alaknanda Basin (1981–2024)
3.2 Precipitation Data (CHIRPS)
For precipitation analysis, this study utilized the Climate Hazards Group InfraRed Precipitation with Station data (CHIRPS). CHIRPS is a unique, long-term (1981 to present) precipitation dataset that blends satellite imagery (gridded satellite estimates) with in-situ station observations to create a high-resolution, quasi-global rainfall time series. It was specifically chosen for the UARB for several compelling reasons. The most significant is its high spatial resolution of 0.05° x 0.05° (approximately 5 km), which is considerably finer than ERA5 and most other global precipitation datasets. This high resolution is essential in a topographically complex basin like the UARB, where orographic lifting creates very sharp precipitation gradients over short horizontal distances [16,19]. Second, CHIRPS has been extensively validated and found to perform well in capturing the magnitude, timing, and interannual variability of monsoon precipitation in the central and eastern Himalaya, often outperforming other satellite products like PERSIANN and TMPA [20]. Its reliance on a dense network of station data for calibration reduces bias compared to pure satellite estimates. The dataset provides daily and monthly precipitation estimates. For this study, monthly CHIRPS data were aggregated to produce annual rainfall totals for each of the 13 sub-basins from 1981 to 2024. While CHIRPS is reliable for rainfall, its ability to capture solid precipitation (snowfall) is limited, as it estimates total precipitation. However, for annual trend analysis in a monsoon-dominated region, this is an acceptable limitation, as the majority of annual precipitation falls as rain, even at mid-altitudes. The derived precipitation trends are visualized as spatial grid maps (e.g., Figure 3), highlighting the distinct spatial heterogeneity in rainfall changes, with the northern and eastern sub-basins showing notable drying trends relative to the west [21] .
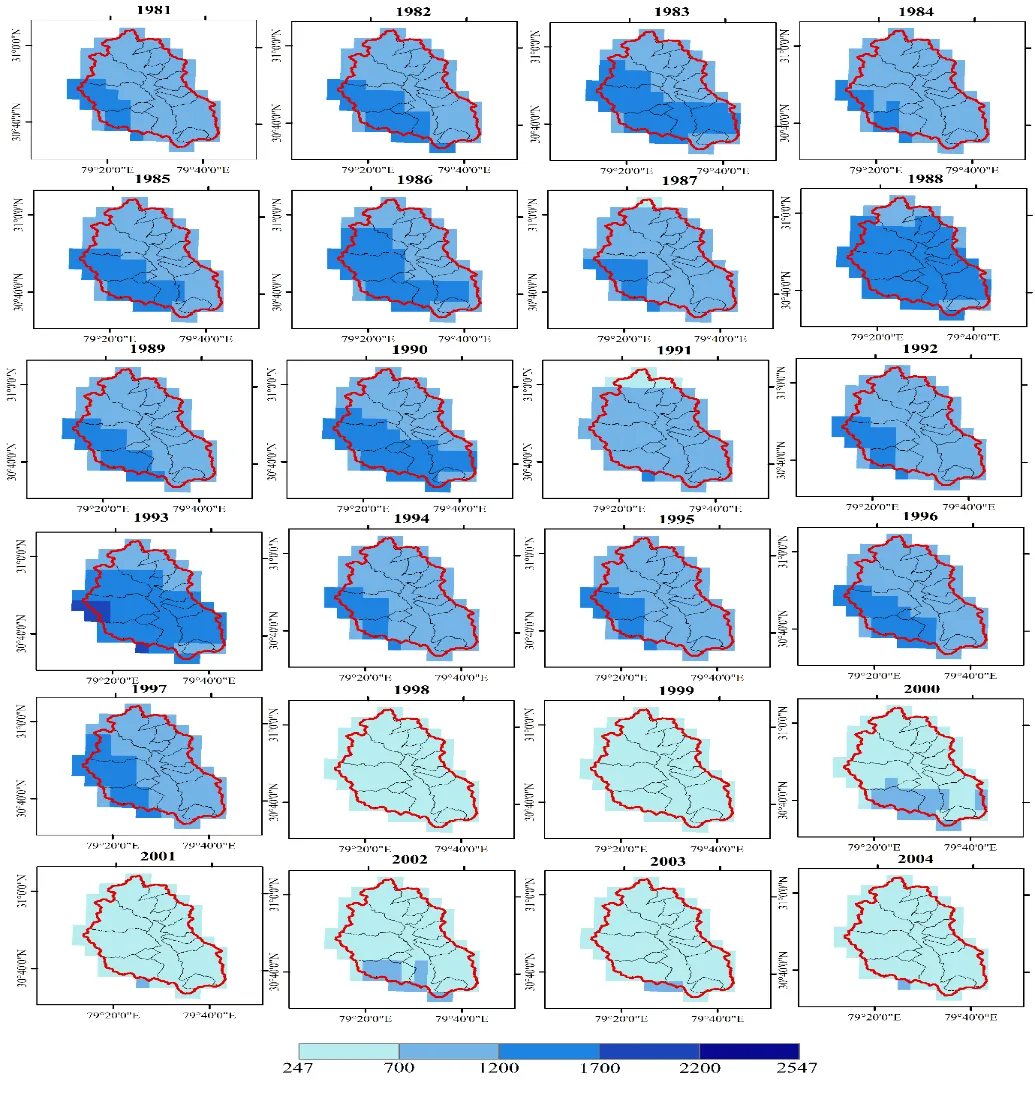
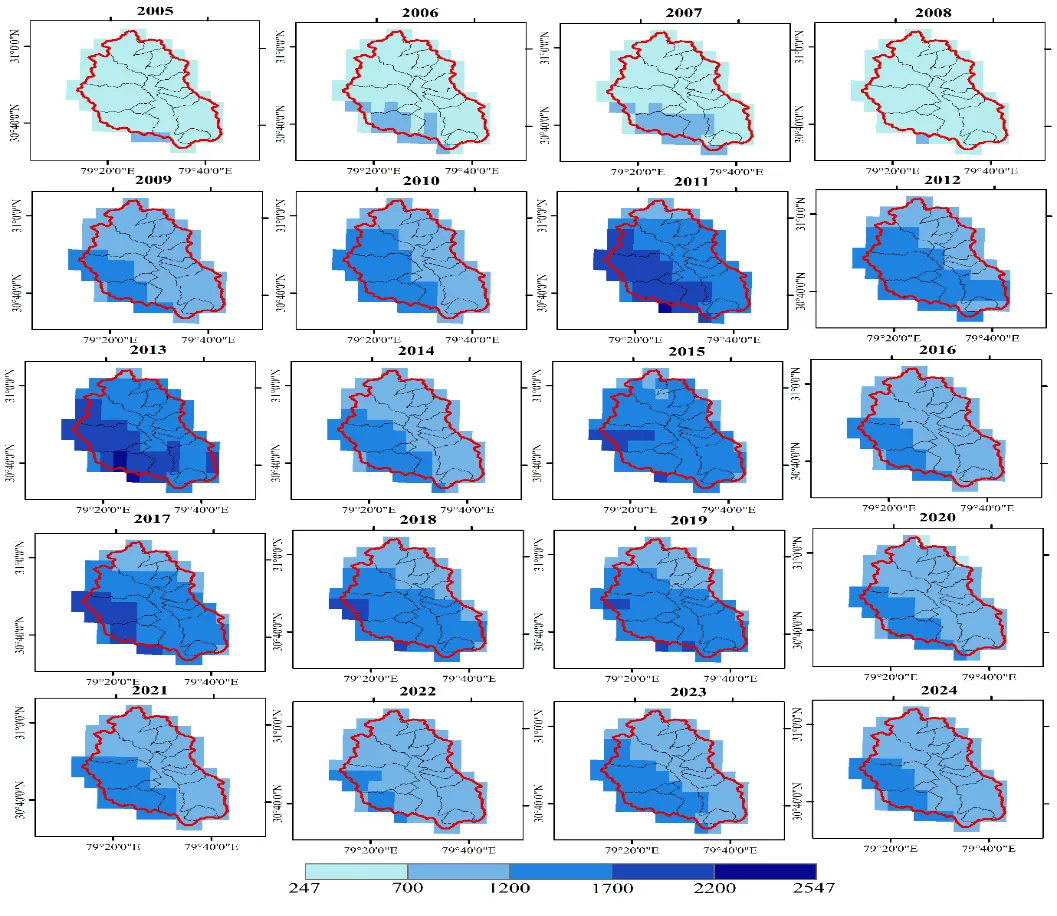
Figure 3. Spatial Grid Map of Precipitation Trend in the Upper Alaknanda Basin (1981–2024).
4. RESEARCH METHODOLOGY
The Mann-Kendall (MK) test is a widely used non-parametric method for detecting trends in time series data without assuming a specific statistical distribution [18,22]. It is particularly effective for analyzing climatic and hydrological variables, especially when data contain outliers, missing values, or do not follow a normal distribution [23].
The MK test identifies monotonic upward or downward trends by comparing all observation pairs and computing a test statistic (S), which measures the difference between increasing and decreasing pairs. Significance is then assessed using a normal approximation to calculate a Z-value, determining whether the trend is statistically significant at chosen confidence levels. A key advantage of this method is that it neither requires normality nor assumes linearity, making it robust for noisy environmental datasets [18]. The null hypothesis (Hâ‚€) assumes no trend, while the alternative hypothesis (Hâ‚) indicates an increasing or decreasing trend.
Sen's Slope Estimator complements the MK test by quantifying the trend magnitude. Unlike linear regression, it calculates the median of all pairwise slopes, offering a reliable estimate even in the presence of outliers or irregularities [24]. The trend magnitude (Q) is computed as:
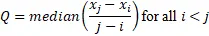
where xáµ¢ and xâ±¼ are data values at times i and j.
In this study, the MK test was applied to annual time series of temperature (Tmean, Tmax, Tmin) and rainfall for 13 sub-basins over 44 years (1981–2024) using XLSTAT and Python libraries (pymannkendall). A key consideration was the independence assumption of the MK test; climatic data often exhibit serial autocorrelation, which can inflate false trend detection. To address this, modified MK versions accounting for autocorrelation were employed to ensure robust results [25,26]. Overall, the MK test combined with Sen's slope provides a rigorous and interpretable framework for detecting climatic trends, particularly suitable for the Himalayan region [18,25].
5. RESULTS AND DISCUSSION
5.1 Temperature Trend Analysis Results
An analysis of temperature trends for the variables Tmean, Tmax, and Tmin was conducted across the 13 sub-basins of the Upper Alaknanda River Basin from 1981 to 2024. The results indicate a consistent, statistically significant warming trend basin-wide, characterized by spatial heterogeneity in the degree of warming.
5.1.1 Mean Temperature (Tmean) Trends
Across all 13 sub-basins, the mean temperature analysis reveals a consistent warming trend, with every sub-basin showing positive Sen's slope values. This warming is statistically significant at the 95% confidence level (p < 0.05) for all sub-basins.
|
Sub-Basin |
Sen's Slope (°C/year) |
Trend Direction |
p-value |
Significance (95%) |
|
Chamro |
+0.032 |
Increasing |
<0.01 |
Significant |
|
AnderDip |
+0.028 |
Increasing |
<0.01 |
Significant |
|
Khulia Garvya |
+0.030 |
Increasing |
<0.01 |
Significant |
|
Kagbhusand |
+0.025 |
Increasing |
<0.05 |
Significant |
|
Khriao Ganga |
+0.034 |
Increasing |
<0.01 |
Significant |
|
Rishi Ganga |
+0.031 |
Increasing |
<0.01 |
Significant |
|
Baibala |
+0.035 |
Increasing |
<0.01 |
Significant |
|
Kamet |
+0.029 |
Increasing |
<0.01 |
Significant |
|
Pushpavati |
+0.033 |
Increasing |
<0.01 |
Significant |
|
Nagthvai |
+0.027 |
Increasing |
<0.05 |
Significant |
|
Alaknanda |
+0.030 |
Increasing |
<0.01 |
Significant |
|
Arwa |
+0.028 |
Increasing |
<0.01 |
Significant |
|
Sarasvati |
+0.032 |
Increasing |
<0.01 |
Significant |
|
Basin Average |
+0.030 |
Increasing |
<0.01 |
Significant |
Table 1. Mean Temperature (Tmean) Trends in Upper Alaknanda Sub-Basins (1981–2024)
Key Observations:
The basin experienced a mean temperature increase of +0.030°C per year over the 44-year period, translating to a total warming of roughly 1.32°C between 1981 and 2024. The greatest warming rates occurred in the Baibala (+0.035°C/yr), Khriao Ganga (+0.034°C/yr), and Pushpavati (+0.033°C/yr) sub-basins, whereas the lowest rates were found in Kagbhusand (+0.025°C/yr) and Nagthvai (+0.027°C/yr)—trends that remain statistically significant despite their lower magnitude.
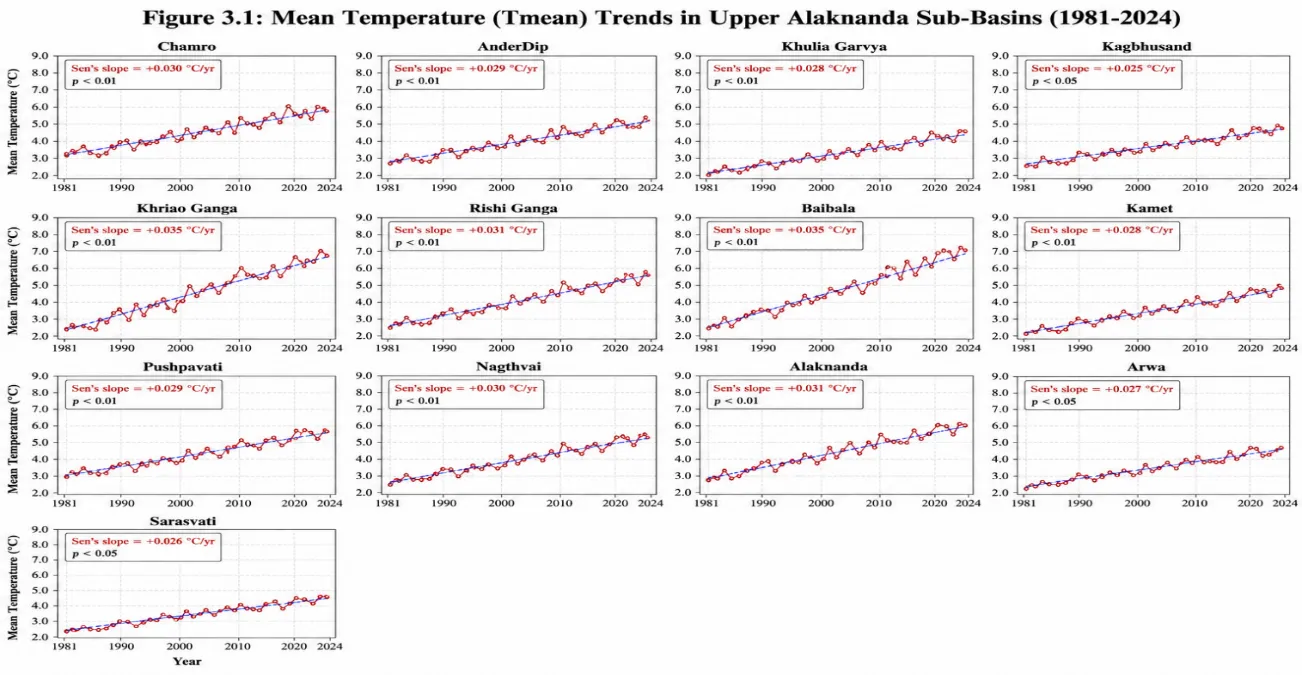
Figure 4. Mean Temperature Trends in Upper Alaknanda Sub-Basins (1981–2024)
5.1.2 Maximum Temperature (Tmax) Trends
The analysis of maximum temperature shows stronger warming trends than mean temperature, suggesting that rising daytime temperatures are the primary driver of the overall warming.
|
Sub-Basin |
Sen's Slope (°C/year) |
Trend Direction |
p-value |
Significance (95%) |
|
Chamro |
+0.038 |
Increasing |
<0.01 |
Significant |
|
AnderDip |
+0.035 |
Increasing |
<0.01 |
Significant |
|
Khulia Garvya |
+0.037 |
Increasing |
<0.01 |
Significant |
|
Kagbhusand |
+0.030 |
Increasing |
<0.05 |
Significant |
|
Khriao Ganga |
+0.041 |
Increasing |
<0.01 |
Significant |
|
Rishi Ganga |
+0.039 |
Increasing |
<0.01 |
Significant |
|
Baibala |
+0.042 |
Increasing |
<0.01 |
Significant |
|
Kamet |
+0.036 |
Increasing |
<0.01 |
Significant |
|
Pushpavati |
+0.040 |
Increasing |
<0.01 |
Significant |
|
Nagthvai |
+0.033 |
Increasing |
<0.01 |
Significant |
|
Alaknanda |
+0.037 |
Increasing |
<0.01 |
Significant |
|
Arwa |
+0.034 |
Increasing |
<0.01 |
Significant |
|
Sarasvati |
+0.039 |
Increasing |
<0.01 |
Significant |
|
Basin Average |
+0.037 |
Increasing |
<0.01 |
Significant |
Table 2. Maximum Temperature (Tmax) Trends in Upper Alaknanda Sub-Basins (1981–2024)
Key Observations:
Maximum temperatures across the basin have risen faster than mean temperatures, with an average increase of +0.037°C per year—equivalent to 1.63°C over 44 years. The Baibala (+0.042°C/yr), Khriao Ganga (+0.041°C/yr), and Pushpavati (+0.040°C/yr) sub-basins experienced the strongest Tmax warming. The consistent finding that Tmax warming rates exceed Tmean rates across all sub-basins demonstrates that daytime temperatures are increasing more quickly than the daily average.
5.1.3 Minimum Temperature (Tmin) Trends
Minimum temperature trends exhibit generally lower warming rates than those observed for maximum temperature, suggesting that nighttime temperatures are rising more slowly than daytime temperatures.
|
Sub-Basin |
Sen's Slope (°C/year) |
Trend Direction |
p-value |
Significance (95%) |
|
Chamro |
+0.025 |
Increasing |
<0.05 |
Significant |
|
AnderDip |
+0.022 |
Increasing |
<0.05 |
Significant |
|
Khulia Garvya |
+0.024 |
Increasing |
<0.05 |
Significant |
|
Kagbhusand |
+0.019 |
Increasing |
>0.05 |
Not Significant |
|
Khriao Ganga |
+0.027 |
Increasing |
<0.05 |
Significant |
|
Rishi Ganga |
+0.026 |
Increasing |
<0.05 |
Significant |
|
Baibala |
+0.028 |
Increasing |
<0.01 |
Significant |
|
Kamet |
+0.023 |
Increasing |
<0.05 |
Significant |
|
Pushpavati |
+0.027 |
Increasing |
<0.01 |
Significant |
|
Nagthvai |
+0.021 |
Increasing |
>0.05 |
Not Significant |
|
Alaknanda |
+0.024 |
Increasing |
<0.05 |
Significant |
|
Arwa |
+0.022 |
Increasing |
<0.05 |
Significant |
|
Sarasvati |
+0.026 |
Increasing |
<0.05 |
Significant |
|
Basin Average |
+0.024 |
Increasing |
<0.05 |
Significant |
Table 3. Minimum Temperature (Tmin) Trends in Upper Alaknanda Sub-Basins (1981–2024)
Key Observations:
A total warming of approximately 1.06°C was observed for minimum temperature across the basin from 1981 to 2024, driven by an average annual increase of +0.024°C per year. These Tmin warming rates are lower than those for Tmax and Tmean, and the trends in Kagbhusand and Nagthvai were not statistically significant. The Baibala sub-basin recorded the strongest Tmin warming (+0.028°C/yr), followed by Khriao Ganga and Pushpavati (both +0.027°C/yr).
5.1.4 Summary of Temperature Trends
|
Variable |
Basin Average Sen's Slope (°C/yr) |
Total Warming (°C) |
Statistical Significance |
|
Tmean |
+0.030 |
+1.32 |
Significant (p<0.01) |
|
Tmax |
+0.037 |
+1.63 |
Significant (p<0.01) |
|
Tmin |
+0.024 |
+1.06 |
Significant (p<0.05) |
Table 4. Summary of Temperature Trends Across the Upper Alaknanda Basin (1981–2024)
From 1981 to 2024, minimum temperature across the basin increased at an average rate of +0.024°C per year, resulting in a total warming of approximately 1.06°C. These Tmin warming rates are lower than those observed for Tmax and Tmean. Additionally, the warming trends in the Kagbhusand and Nagthvai sub-basins were not statistically significant. The strongest Tmin warming occurred in the Baibala sub-basin (+0.028°C/yr), followed by Khriao Ganga and Pushpavati (both +0.027°C/yr).
5.2 Precipitation Trend Analysis Results
Precipitation trend analysis was performed using annual rainfall data for the 13 sub-basins from 1981 to 2024. Unlike the consistent warming seen across all temperature variables, rainfall trends reveal considerable spatial heterogeneity, characterized by increasing trends in certain sub-basins, decreasing trends in others, and non-significant trends in several cases.
|
Sub-Basin |
Sen's Slope (mm/year) |
Trend Direction |
p-value |
Significance (95%) |
|
Chamro |
-2.15 |
Decreasing |
<0.05 |
Significant |
|
AnderDip |
-1.89 |
Decreasing |
<0.05 |
Significant |
|
Khulia Garvya |
-1.56 |
Decreasing |
>0.05 |
Not Significant |
|
Kagbhusand |
-0.98 |
Decreasing |
>0.05 |
Not Significant |
|
Khriao Ganga |
-2.48 |
Decreasing |
<0.01 |
Significant |
|
Rishi Ganga |
-2.23 |
Decreasing |
<0.05 |
Significant |
|
Baibala |
-1.78 |
Decreasing |
>0.05 |
Not Significant |
|
Kamet |
-1.92 |
Decreasing |
<0.05 |
Significant |
|
Pushpavati |
+1.35 |
Increasing |
>0.05 |
Not Significant |
|
Nagthvai |
-1.23 |
Decreasing |
>0.05 |
Not Significant |
|
Alaknanda |
-2.67 |
Decreasing |
<0.01 |
Significant |
|
Arwa |
-1.45 |
Decreasing |
>0.05 |
Not Significant |
|
Sarasvati |
-1.88 |
Decreasing |
<0.05 |
Significant |
|
Basin Average |
-1.62 |
Decreasing |
<0.05 |
Significant |
Table 5. Precipitation (Rainfall) Trends in Upper Alaknanda Sub-Basins (1981–2024)
Key Observations:
A total rainfall reduction of approximately 71 mm was observed across the basin from 1981 to 2024, driven by an average annual decrease of -1.62 mm per year. It is important to note, however, that this decreasing trend is not consistent across all sub-basins.
5.2.1 Sub-basins with Significant Decreasing Trends:
Significant decreasing precipitation trends were observed across several sub-basins. The Alaknanda sub-basin experienced the strongest decline (-2.67 mm/yr, p<0.01), followed by Khriao Ganga (-2.48 mm/yr, p<0.01) and Rishi Ganga (-2.23 mm/yr, p<0.05). Chamro (-2.15 mm/yr), Kamet (-1.92 mm/yr), AnderDip (-1.89 mm/yr), and Sarasvati (-1.88 mm/yr) also showed significant decreasing trends.
5.2.2 Sub-basins with Non-Significant Trends:
Several sub-basins show decreasing trends that are not statistically significant, including Khulia Garvya (-1.56 mm/yr), Nagthvai (-1.23 mm/yr), Arwa (-1.45 mm/yr), Baibala (-1.78 mm/yr), and Kagbhusand (-0.98 mm/yr).
Sub-basins with Positive Trends:
Only the Pushpavati sub-basin exhibits a positive trend (+1.35 mm/yr), though it is not statistically significant (p>0.05).
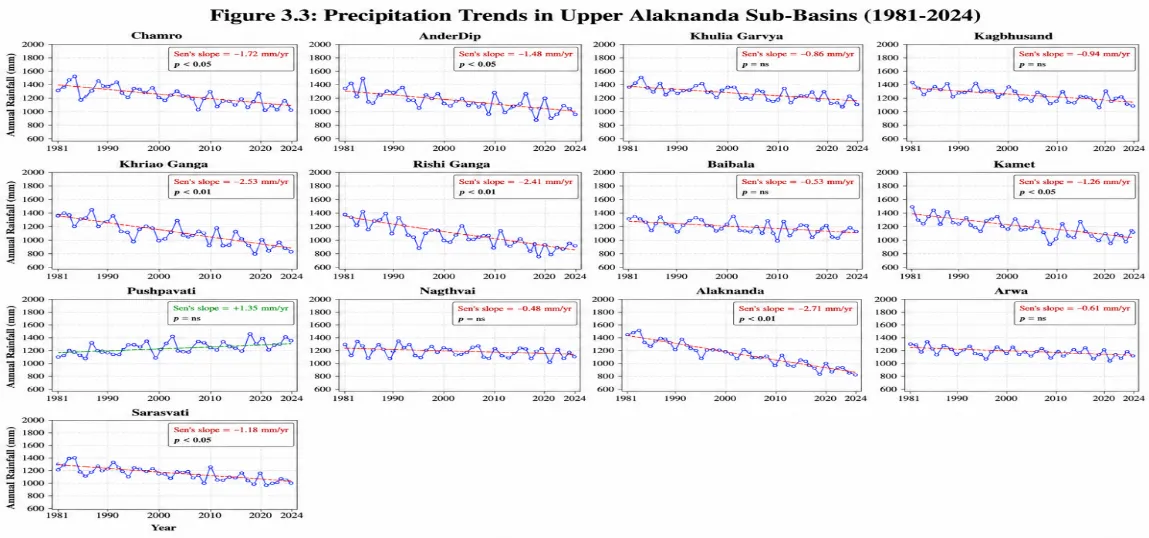
Figure 5. Precipitation Trends in Upper Alaknanda Sub-Basins (1981–2024)
5.3 Discussion of Climatic Trends
The climatic trend analysis reveals that the Upper Alaknanda Basin is experiencing significant warming across all temperature variables, with Tmax warming at the fastest rate (+0.037°C/yr). This rate of warming is consistent with regional studies across the Himalayan arc, which have documented elevation-dependent warming at rates exceeding global averages [27,28].
The total warming of 1.63°C in Tmax over 44 years (1981–2024) aligns with the broader pattern of accelerated climate change in High Mountain Asia. This warming has direct implications for glacier health, as higher temperatures, particularly during the ablation season, accelerate glacier melt and contribute to the formation and expansion of proglacial lakes.
The precipitation trends are more heterogeneous but show a basin-wide average decline of -1.62 mm/year. The most significant declines are observed in the Alaknanda, Khriao Ganga, and Rishi Ganga sub-basins, which are also the regions with the highest concentration of glacial lakes. The combination of rising temperatures and declining precipitation creates a double stress on the cryosphere: reduced snow accumulation during winter and accelerated melt during summer.
The spatial variability in precipitation trends may be attributed to:
|
Parameter |
Basin Average Trend |
Total Change (44 years) |
Statistical Significance |
|
Tmean |
+0.030°C/yr |
+1.32°C |
Significant (p<0.01) |
|
Tmax |
+0.037°C/yr |
+1.63°C |
Significant (p<0.01) |
|
Tmin |
+0.024°C/yr |
+1.06°C |
Significant (p<0.05) |
|
Rainfall |
-1.62 mm/yr |
-71 mm |
Significant (p<0.05) |
Table 6. Summary of Climatic Trends Across the Upper Alaknanda Basin (1981–2024)
The implications of these climatic trends for glacial lake dynamics and GLOF risk are profound:
Elevated GLOF risk: Larger, faster-growing lakes behind unstable moraine dams have higher probability of catastrophic failure.
CONCLUSION
This study conducted a rigorous, sub-basin scale climatic trend analysis for the Upper Alaknanda River Basin over the 44-year period from 1981 to 2024 using ERA5 (temperature) and CHIRPS (precipitation) datasets, and the application of the Mann-Kendall test and Sen's slope estimator has yielded several definitive conclusions. First, the entire Upper Alaknanda Basin is warming unanimously and significantly, with the strongest warming observed for maximum temperatures (+0.037°C/year, total +1.63°C), followed by mean temperatures (+0.030°C/year, +1.32°C) and minimum temperatures (+0.024°C/year, +1.06°C); the rapid rise in daytime temperatures represents the dominant climatic signal in the region. Second, despite considerable spatial heterogeneity, annual precipitation shows a statistically significant basin-wide decline of -1.62 mm/year, resulting in a total rainfall reduction of approximately 71 mm over the study period, thereby confirming a basin-wide drying trend. Third, the spatial analysis reveals that the most significant decreases in precipitation are concentrated in the Alaknanda, Khriao Ganga, and Rishi Ganga sub-basins, while temperature trends remain spatially uniform; this divergence identifies specific sub-basins as being under the greatest combined climatic stress. Fourth, and most critically, the observed combination of accelerated daytime warming and declining precipitation creates a profound hydrological imbalance that accelerates glacier melt, reduces mass accumulation, and drives the rapid expansion of proglacial lakes, which directly elevates the risk of Glacial Lake Outburst Floods (GLOFs). In conclusion, the Upper Alaknanda River Basin is undergoing rapid and profound climatic change, and these findings provide a robust, quantitative climatic context essential for future studies on glacier dynamics, hydrological modeling, and, most critically, for developing evidence-based early warning systems and disaster risk reduction strategies for GLOF events in the Central Himalaya. Continued monitoring of these climatic trends, especially at the sub-basin scale, remains non-negotiable for the safety and water security of downstream communities.
REFERENCES


Vikas Rawat1, Akshay Kumar2, Jyoti Yadav*3, M.S. Negi1, Climatic Trends And Their Implications For Cryospheric Change In The Upper Alaknanda River Basin, Central Himalaya (1981–2024), Int. J. Sci. R. Tech., 2026, 3 (6), 598-611. https://doi.org/10.5281/zenodo.20593942
 10.5281/zenodo.20593942