

We use cookies to ensure our website works properly and to personalise your experience. Cookies policy
Dept. of Commerce, Sri Dharmasthala Manjunatheshwara College (Autonomous), Ujire - 574240
Digital transformation has significantly reshaped consumer behaviour and created new opportunities for promoting sustainable consumption. This study examines the relationship between Online Shopping Digitalisation (OSD), Green Technology Adoption (GTA), and Sustainable Consumption (SC) among online consumers. The study aims to assess the relationships among these constructs and examine the potential mediating role of GTA in the relationship between OSD and SC. A quantitative, cross-sectional research design was adopted, and primary data were collected from 220 online consumers using a structured questionnaire and five-point Likert scale. Data were analysed using SPSS through descriptive statistics, correlation, and regression analysis, while PLS-SEM is proposed for further assessment of the measurement and structural models. The findings indicate significant positive relationships between OSD and GTA (? = .261, p < .001), OSD and SC (? = .299, p < .001), and GTA and SC (? = .465, p < .001). The study highlights the importance of integrating digitalisation and green technology to promote sustainable consumption.
The rapid diffusion of digital technologies has transformed consumer behaviour, particularly through the expansion of online shopping. E-commerce platforms increasingly integrate digital payments, mobile applications, personalised recommendations, online reviews and data-driven product information, making digitalisation an important component of contemporary consumption systems. However, the environmental implications of online shopping are complex. While digital commerce may improve convenience and certain logistical efficiencies, it can also contribute to packaging waste, last-mile delivery emissions, reverse logistics and increased consumption.
At the same time, digital platforms provide opportunities to promote environmentally responsible consumption through eco-labels, sustainability information, paperless transactions, digital receipts, green delivery options and technology-enabled recycling and return systems. This creates an emerging intersection between digital transformation and environmental sustainability. However, limited consumer-level research has examined how online shopping digitalisation may contribute to sustainable consumption through the adoption of green technologies. Therefore, this study examines Online Shopping Digitalisation (OSD), Green Technology Adoption (GTA), and Sustainable Consumption (SC) within an integrated PLS-SEM framework. Specifically, it examines the relationships among these constructs and investigates whether green technology adoption mediates the relationship between online shopping digitalisation and sustainable consumption. The study contributes to understanding the consumer-level mechanisms through which digital commerce may support the transition towards more sustainable consumption practices.
|
Sl. No. |
Author(s) & Year |
Study Focus |
Methodology |
Key Findings |
Research Gap / Relevance |
|
1 |
Frick & Matthies (2020) |
Online shopping efficiency and consumption |
Cross-sectional studies; N=883, 860, 976 |
Online shopping changes consumption behaviour, with both sustainability opportunities and risks. |
Does not examine green technology adoption as a mechanism. |
|
2 |
Rao et al. (2021) |
E-commerce and environmental sustainability |
Questionnaire; 303 respondents |
Environmental attitudes are important for sustainable e-commerce behaviour. |
Focuses on e-commerce sustainability rather than the digitalisation–GTA–sustainability pathway. |
|
3 |
Islam et al. (2023) |
Environmental-impact information in e-commerce |
Quasi-randomised experiment; 98 participants |
Environmental-impact information improved eco-friendly online behaviour. |
Examines a specific digital intervention rather than overall online shopping digitalisation. |
|
4 |
Bharani, Roy & Tawde (2024) |
Sustainable e-commerce practices in India |
Survey; 301 consumers |
Environmental concerns influenced sustainable delivery and purchase intentions. |
Does not examine green technology adoption as a mediator. |
|
5 |
Klein & Popp (2023) |
Online vs. physical retail sustainability perceptions |
Literature review + four empirical studies |
Consumers' perceptions of e-commerce sustainability differ from expert assessments. |
Does not explain how digitalisation influences sustainable consumption through technology. |
|
6 |
Li, Yang & Arshad (2026) |
AI, social influence and eco-friendly online shopping |
Consumer empirical research |
AI-mediated information and social influence can support eco-friendly shopping decisions. |
Does not test the OSD → GTA → SC pathway. |
|
7 |
Gattupalli, Ashrafunnisa & Krishna (2026) |
eWOM and green purchase intentions in India |
Survey; 512 respondents |
Information quality and credibility strengthened eWOM adoption and green purchase intention. |
Focuses on eWOM rather than green technology adoption and sustainable consumption. |
|
8 |
Wang et al. (2025) |
E-commerce and green consumption transformation |
Chinese provincial panel data, 2012–2023 |
E-commerce was associated with green consumption transformation. |
Macro-level study; does not explain individual consumer behaviour. |
|
9 |
2025 – From Cues to Choices |
Eco-labels and sustainable online consumption |
SEM, NCA and fsQCA |
Eco-labels and quality cues influence sustainable online consumption. |
Does not examine GTA as a mediating mechanism. |
|
10 |
Hassan et al. (2026) |
Drivers of green consumer behaviour |
Empirical consumer research |
Highlights the challenge of translating environmental concern into green behaviour. |
Does not specifically address digital commerce and GTA. |
|
11 |
Bi et al. (2026) |
Digital green transformation of online retailing |
Game-theoretic model and simulation |
Consumer eco-consciousness and policy support influence retailers' green transformation. |
Focuses on retailers, not the consumer-level pathway. |
|
12 |
Digital Service Nudges (2026) |
Digital nudges and reusable packaging |
Survey, choice experiment and simulated checkout |
Digital nudges and convenient return systems can encourage sustainable practices. |
Focuses on reusable packaging rather than broader green technology adoption. |
Source: Author's compilation based on the reviewed literature (2020–2026).
Table:1 Brief Review of Literature on Online Shopping Digitalisation, Green Technology Adoption and Sustainable Consumption
Recent research highlights the growing interrelationship between digital transformation, environmental sustainability, green technology and responsible consumer behaviour. Poojari N. (2026) examined digital inclusion, rural youth capabilities and inclusive growth, highlighting the broader role of digital transformation in enhancing capabilities and supporting inclusive development, while Poojari N. (2026) also examined digital transformation and rural youth empowerment, providing a relevant foundation for understanding how digital technologies can influence socio-economic behaviour and development. In the area of environmental sustainability, Poojari N. (2026) examined sustainable green entrepreneurship and the role of green product innovation, thereby emphasising the importance of green innovation in achieving sustainable economic outcomes. Similarly, Poojari N. (2024) examined the role of organic products in achieving a sustainable green economy and the relationship between consumers’ environmental and health concerns and the use of green products (Poojari, N. 2024). Earlier studies by Poojari N. (2019) addressed consumer decision-making regarding solar energy usage and environmental protection, while Poojari N. (2018) examined economic and environmental sustainability, providing further conceptual support for linking technology adoption, environmental awareness and sustainable behaviour. Building on these strands of literature, the present study extends the discussion to the online shopping environment by examining whether Online Shopping Digitalisation (OSD) contributes to Green Technology Adoption (GTA) and Sustainable Consumption (SC), and whether GTA functions as a mediating mechanism between OSD and SC. Methodologically, the study adopts a quantitative, cross-sectional research design and collects primary data from online consumers using a structured questionnaire based on a five-point Likert scale. The relationships among OSD, GTA and SC are examined using descriptive statistics, reliability analysis, Pearson correlation and regression analysis in SPSS, followed by Partial Least Squares Structural Equation Modelling (PLS-SEM) using SmartPLS to assess the measurement model, structural relationships and the mediating effect of GTA. This approach enables the study to examine both the direct relationship between digitalised online shopping and sustainable consumption and the indirect pathway through green technology adoption.
5. RESEARCH GAP:
Therefore, the present study addresses the identified gap by developing and empirically testing a consumer-level PLS-SEM framework in which Green Technology Adoption is proposed as a mediating mechanism linking Online Shopping Digitalisation with Sustainable Consumption.
6. STATEMENT OF THE PROBLEM
The rapid expansion of online shopping has significantly transformed consumer purchasing behaviour through digital platforms, mobile applications, digital payments, personalised recommendations, and technology-enabled services. While such digitalisation offers greater convenience, accessibility, and information, its contribution to green technology adoption and sustainable consumption remain inadequately understood. Online shopping may facilitate environmentally responsible choices through digital receipts, eco-friendly product information, sustainable delivery options, and technology-supported recycling systems; however, it may also increase packaging waste, frequent deliveries, product returns, and excessive consumption. Existing studies have largely examined e-commerce sustainability, green purchasing behaviour, digital technologies, and environmental practices independently, leaving limited evidence on their integrated consumer-level relationships. Particularly, the mechanism through which Online Shopping Digitalisation (OSD) influences Sustainable Consumption (SC) through Green Technology Adoption (GTA) requires further empirical investigation. Therefore, this study employs PLS-SEM to examine these relationships and determine whether Green Technology Adoption mediates the relationship between Online Shopping Digitalisation and Sustainable Consumption.
7. SCOPE OF THE STUDY
The study focuses on online consumers and examines how Online Shopping Digitalisation (OSD) influences Green Technology Adoption (GTA) and Sustainable Consumption (SC). It covers consumers' use of digital shopping platforms, technology-enabled green practices and environmentally responsible purchasing behaviour. The study specifically investigates the direct relationships among OSD, GTA and SC and the mediating role of GTA in the relationship between OSD and SC. Primary data will be collected from online shopping consumers through a structured questionnaire and analysed using descriptive statistics and PLS-SEM. The study is limited to consumer-level perceptions and behaviours associated with online shopping and does not examine retailer-level supply chains, logistics or broader macroeconomic effects.
8. JUSTIFICATION OF THE STUDY
The study is justified by the growing integration of digital transformation and environmental sustainability in e-commerce. Although previous research has examined online shopping and green consumption, limited attention has been given to the mechanism through which digitalisation may encourage green technology adoption and sustainable consumption. Examining GTA as a mediating variable provides a more comprehensive understanding of this relationship. The findings can contribute to academic literature and provide useful insights for e-commerce platforms, consumers and sustainability-oriented policymakers seeking to promote environmentally responsible digital consumption.
8. SIGNIFICANCE OF THE STUDY:
The study is significant because it examines the growing intersection of digital transformation and environmental sustainability in online shopping. It contributes to academic literature by integrating Online Shopping Digitalisation, Green Technology Adoption and Sustainable Consumption within a single empirical framework. The study is particularly relevant because it examines Green Technology Adoption as a mediating mechanism, providing a deeper understanding of how digitalised shopping environments may influence sustainable consumer behaviour.
The findings may help e-commerce platforms and digital retailers understand how technology-enabled green practices can encourage environmentally responsible consumption. For consumers, the study may increase awareness of the environmental implications of digital purchasing and the role of green technologies. For policymakers and sustainability practitioners, the findings can provide empirical insights for developing strategies that encourage sustainable digital commerce. Methodologically, the application of PLS-SEM provides empirical evidence on both direct and indirect relationships among the study variables.
9. THEORETICAL AND CONCEPTUAL FRAMEWORK
1. Theoretical Framework: The study can be grounded in Unified Theory of Acceptance and Use of Technology (UTAUT) and Value–Belief–Norm (VBN) Theory to explain the relationship between digitalised online shopping, green technology adoption and sustainable consumption.
Unified Theory of Acceptance and Use of Technology (UTAUT) : UTAUT provides a theoretical basis for understanding consumers' acceptance and use of digital technologies. In the present study, the theory helps explain how consumers' interaction with online shopping platforms, digital payments, mobile applications, digital information and technology-enabled services contributes to the adoption of green technologies. Higher acceptance and use of digital technologies may create opportunities for consumers to engage with environmentally oriented digital services.
Thus, UTAUT provides theoretical support for the relationship: Online Shopping Digitalisation → Green Technology Adoption
Value–Belief–Norm (VBN) Theory : VBN theory explains environmentally responsible behaviour through individuals' values, environmental beliefs and personal norms. In the context of this study, consumers who recognise environmental consequences may be more willing to adopt green technologies and engage in environmentally responsible consumption practices.
Thus, VBN provides theoretical support for: Green Technology Adoption → Sustainable Consumption
It also helps explain how digital environments can provide information and opportunities that facilitate environmentally responsible consumer behaviour.
2. Conceptual Framework
The conceptual framework integrates Online Shopping Digitalisation (OSD), Green Technology Adoption (GTA), and Sustainable Consumption (SC).
Online Shopping Digitalisation (OSD) : OSD represents consumers' use of digital platforms and technologies for online purchasing, including digital payments, mobile applications, online product information, reviews and personalised digital services.
Green Technology Adoption (GTA) : GTA represents consumers' willingness to adopt or support technology-enabled environmentally friendly practices associated with online shopping, such as paperless transactions, digital receipts, green delivery options, recycling and technology-enabled returns.
2.3 Sustainable Consumption (SC): SC represents environmentally responsible consumer behaviour, including preference for eco-friendly products, reduced waste, consideration of product durability and packaging, and environmental considerations in purchasing decisions.
2.4 Mediating Role of Green Technology Adoption: The framework proposes that OSD may influence SC directly and indirectly through GTA. GTA therefore functions as the mediating variable.
10. Objective
11. Research Hypotheses:
H1: Online Shopping Digitalisation has a significant positive effect on Green Technology Adoption.
H2: Online Shopping Digitalisation has a significant positive effect on Sustainable Consumption.
H3: Green Technology Adoption has a significant positive effect on Sustainable Consumption.
H4: Green Technology Adoption significantly mediates the relationship between Online Shopping Digitalisation and Sustainable Consumption.
12. RESEARCH METHODOLOGY:
The present study adopts a quantitative, cross-sectional research design to examine the relationship between Online Shopping Digitalisation (OSD), Green Technology Adoption (GTA), and Sustainable Consumption (SC) among online consumers. Primary data were collected from respondents having experience with online shopping through a structured questionnaire comprising demographic variables and 30 measurement items covering OSD, GTA, and SC, measured on a five-point Likert scale ranging from 1 = Strongly Disagree to 5 = Strongly Agree. The study uses 220 valid responses for the empirical analysis. Descriptive statistics were employed to understand the central tendency and dispersion of the major constructs, while Cronbach’s alpha was used to assess the internal consistency of the measurement items.
Pearson correlation analysis was conducted to examine the associations among OSD, GTA, and SC. Subsequently, simple linear regression analysis using SPSS was employed to test the direct relationships corresponding to H1 (OSD → GTA), H2 (OSD → SC), and H3 (GTA → SC). The results indicate statistically significant positive relationships for all three paths, with OSD explaining 6.8% of the variance in GTA, OSD explaining 8.9% of the variance in SC, and GTA explaining 21.6% of the variance in SC. To examine the proposed mediating role of GTA in the relationship between OSD and SC (H4), the study further proposes Partial Least Squares Structural Equation Modelling (PLS-SEM) using SmartPLS, including assessment of the measurement model, structural model, path coefficients, coefficient of determination (R²), and bootstrapped indirect effect with confidence intervals. Thus, the methodology integrates SPSS-based statistical analysis with PLS-SEM to assess both the direct and indirect relationships among digitalised online shopping, green technology adoption, and sustainable consumption.
13. DATA ANALYSIS OF THE STUDY:
|
Experience with Online Shopping by Frequency of Online Shopping |
||||||||||
|
Experience with Online Shopping |
Frequency of Online Shopping |
|||||||||
|
Less than once a month |
1–2 times a month |
3–5 times a month |
6–10 times a month |
More than 10 times a month |
||||||
|
F |
% |
F |
% |
F |
% |
F |
% |
F |
% |
|
|
Less than 1 year |
1 |
13% |
12 |
48% |
27 |
31% |
21 |
35% |
13 |
33% |
|
1–3 years |
3 |
38% |
8 |
32% |
18 |
20% |
13 |
22% |
14 |
36% |
|
4–6 years |
2 |
25% |
1 |
4% |
23 |
26% |
16 |
27% |
5 |
13% |
|
7–10 years |
1 |
13% |
3 |
12% |
10 |
11% |
2 |
3% |
2 |
5% |
|
More than 10 years |
1 |
13% |
1 |
4% |
10 |
11% |
8 |
13% |
5 |
13% |
|
Total |
8 |
100% |
25 |
100% |
88 |
100% |
60 |
100% |
39 |
100% |
|
Source: Author’s computation based on primary survey data using SPSS. |
||||||||||
Table: 2-Experience with Online Shopping by Frequency of Online Shopping
Table 2 presents the distribution of respondents according to their online shopping experience and frequency of online shopping. Among respondents shopping 3–5 times a month, those with less than one year of experience constituted the largest group (31%), followed by those with 4–6 years of experience (26%). Among respondents shopping 6–10 times a month, the highest proportion had less than one year of experience (35%), followed by 4–6 years (27%). In the more than 10 times a month category, respondents with 1–3 years of experience formed the largest proportion (36%), followed by those with less than one year (33%). Overall, the data indicate considerable variation in online shopping frequency across different levels of shopping experience, with frequent online shopping reported by consumers from both relatively new and more experienced user groups.
|
Gender-wise Distribution of Respondents by Frequency of Online Shopping |
||||
|
Frequency of Online Shopping |
Gender |
|||
|
Male |
Female |
|||
|
F |
% |
F |
% |
|
|
Less than once a month |
4 |
3% |
4 |
4% |
|
1–2 times a month |
17 |
15% |
8 |
8% |
|
3–5 times a month |
43 |
37% |
45 |
43% |
|
6–10 times a month |
33 |
29% |
27 |
26% |
|
More than 10 times a month |
18 |
16% |
21 |
20% |
|
Total |
115 |
100% |
105 |
100% |
|
Source: Author’s computation based on primary survey data using SPSS. |
||||
Table: 3- Gender-wise Distribution of Respondents by Frequency of Online Shopping
Table 3 presents the gender-wise distribution of respondents according to their frequency of online shopping. Among male respondents, the highest proportion (37%) reported shopping online 3–5 times a month, followed by 29% who shopped 6–10 times a month.Similarly, among female respondents, the largest proportion (43%) reported shopping 3–5 times a month, followed by 26% who shopped 6–10 times a month. Only a small proportion of both male (3%) and female (4%) respondents reported shopping online less than once a monthOverall, the distribution indicates that 3–5 online shopping occasions per month was the most common frequency among both male and female respondents.
|
Age-wise Distribution of Respondents by Experience with Online Shopping |
|||||||||||
|
Age |
|||||||||||
|
Experience with Online Shopping |
18–25 years |
26–35 years |
36–45 years |
46–55 years |
Above 55 years |
||||||
|
F |
% |
F |
% |
F |
% |
F |
% |
F |
% |
|
|
|
Less than 1 year |
20 |
48% |
18 |
35% |
22 |
29% |
7 |
25% |
7 |
30% |
|
|
1–3 years |
12 |
29% |
9 |
18% |
23 |
30% |
5 |
18% |
7 |
30% |
|
|
4–6 years |
7 |
17% |
11 |
22% |
17 |
22% |
8 |
29% |
4 |
17% |
|
|
7–10 years |
2 |
5% |
5 |
10% |
6 |
8% |
4 |
14% |
1 |
4% |
|
|
More than 10 years |
1 |
2% |
8 |
16% |
8 |
11% |
4 |
14% |
4 |
17% |
|
|
42 |
100% |
51 |
100% |
76 |
100% |
28 |
100% |
23 |
100% |
|
|
|
Source: Author’s computation based on primary survey data using SPSS. |
|||||||||||
Table 4: Age-wise Distribution of Respondents by Experience with Online Shopping
Table 4 presents the age-wise distribution of respondents according to their experience with online shopping. Among respondents aged 18–25 years, the largest proportion (48%) had less than one year of online shopping experience. In the 26–35 years group, less than one year of experience was also the largest category (35%), while among respondents aged 36–45 years, 1–3 years of experience accounted for the highest proportion (30%). For the 46–55 years group, 4–6 years of experience was the largest category (29%). Among respondents aged above 55 years, both less than one year and 1–3 years of experience accounted for 30% each. Overall, the table indicates variation in online shopping experience across age groups, with relatively shorter experience being more prominent among younger respondents.
|
Educational Qualification-wise Distribution of Respondents by Experience with Online Shopping |
||||||||
|
Educational Qualification |
||||||||
|
Experience with Online Shopping |
Higher Secondary |
Under graduate |
Post graduate |
M.Phil. /Ph.D. |
||||
|
F |
% |
F |
% |
F |
% |
F |
% |
|
|
Less than 1 year |
5 |
11% |
14 |
25% |
3 |
4% |
4 |
8% |
|
1–3 years |
19 |
42% |
17 |
30% |
23 |
34% |
17 |
33% |
|
4–6 years |
7 |
16% |
13 |
23% |
21 |
31% |
10 |
20% |
|
7–10 years |
11 |
24% |
6 |
11% |
9 |
13% |
10 |
20% |
|
More than 10 years |
3 |
7% |
7 |
12% |
11 |
16% |
10 |
20% |
|
Total |
45 |
100% |
57 |
100% |
67 |
100% |
51 |
100% |
|
Source: Author’s computation based on primary survey data using SPSS. |
||||||||
Table 5: Educational Qualification-wise Distribution of Respondents by Experience with Online Shopping
Table 5 presents the distribution of respondents according to educational qualification and experience with online shopping. Among respondents with Higher Secondary education, the largest proportion (42%) had 1–3 years of online shopping experience. Similarly, among undergraduate respondents, 30% had 1–3 years of experience, while postgraduate respondents recorded the highest proportion (34%) in the same category. Among respondents with M.Phil./Ph.D. qualifications, 33% had 1–3 years of experience. Overall, 1–3 years of online shopping experience was the most prominent category across all educational groups, indicating that this level of experience was relatively common irrespective of educational qualification.
|
Occupation-wise Distribution of Respondents by Experience with Online Shopping |
||||||||||
|
Experience with Online Shopping |
Occupation |
|||||||||
|
Student |
Government Employee |
Private Employee |
Self-employed /Business |
Professional |
||||||
|
F |
% |
F |
% |
F |
% |
F |
% |
F |
% |
|
|
Less than 1 year |
1 |
13% |
4 |
16% |
7 |
8% |
8 |
13% |
6 |
15% |
|
1–3 years |
0 |
0% |
11 |
44% |
33 |
38% |
21 |
35% |
11 |
28% |
|
4–6 years |
6 |
75% |
4 |
16% |
21 |
24% |
8 |
13% |
12 |
31% |
|
7–10 years |
1 |
13% |
3 |
12% |
13 |
15% |
13 |
22% |
6 |
15% |
|
More than 10 years |
0 |
0% |
3 |
12% |
14 |
16% |
10 |
17% |
4 |
10% |
|
8 |
100% |
25 |
100% |
88 |
100% |
60 |
100% |
39 |
100% |
|
|
Source: Author’s computation based on primary survey data using SPSS |
||||||||||
Table 6: Occupation-wise Distribution of Respondents by Experience with Online Shopping
Interpretation: Table 6 presents the occupational distribution of respondents according to their experience with online shopping. Among students, the highest proportion (75%) reported 4–6 years of online shopping experience. For government employees, 44% had 1–3 years of experience. Among private employees, the largest proportion (38%) also reported 1–3 years of experience. For self-employed/business respondents, 35% had 1–3 years of experience, while among professionals, 31% reported 4–6 years of experience. Overall, the distribution shows variation in online shopping experience across occupational groups, with 1–3 years and 4–6 years emerging as the more prominent experience categories.
|
Monthly Household Income-wise Distribution of Respondents by Experience with Online Shopping |
||||||||||
|
Experience with Online Shopping |
Monthly Household Income |
|||||||||
|
Below 25,000 |
25,001– 50,000 |
50,001– 75,000 |
75,001– 1,00,000 |
Above 1,00,000 |
||||||
|
F |
% |
F |
% |
F |
% |
F |
% |
F |
% |
|
|
Less than 1 year |
1 |
2% |
7 |
13% |
6 |
12% |
1 |
6% |
2 |
10% |
|
1–3 years |
26 |
39% |
13 |
23% |
19 |
38% |
9 |
50% |
9 |
43% |
|
4–6 years |
14 |
21% |
16 |
29% |
11 |
22% |
5 |
28% |
5 |
24% |
|
7–10 years |
10 |
15% |
13 |
23% |
9 |
18% |
2 |
11% |
2 |
10% |
|
More than 10 years |
15 |
23% |
7 |
13% |
5 |
10% |
1 |
6% |
3 |
14% |
|
66 |
100% |
56 |
100% |
50 |
100% |
18 |
100% |
21 |
100% |
|
|
Source: Author’s computation based on primary survey data using SPSS |
||||||||||
Table 7: Monthly Household Income-wise Distribution of Respondents by Experience with Online Shopping
Table 7 presents the distribution of respondents according to monthly household income and experience with online shopping. Among respondents with a monthly household income below ₹25,000, the largest proportion (39%) had 1–3 years of online shopping experience. Similarly, among those earning ₹25,001–₹50,000, 29% reported 4–6 years of experience, while 1–3 years was the largest category among respondents earning ₹50,001–₹75,000 (38%), ₹75,001–₹1,00,000 (50%), and above ₹1,00,000 (43%). Overall, the findings indicate that 1–3 years of online shopping experience was particularly prominent among respondents in the higher income groups, while experience varied across income categories.
|
Scale Statistics |
||||
|
Mean |
Variance |
Std. Deviation |
Cronbach's Alpha |
N of Items |
|
118.5227 |
173.420 |
13.16889 |
0.616 |
37 |
|
Source: Author’s computation based on primary survey data using SPSS. |
||||
Table 8: Reliability Statistics of the Overall Research Scale
Table 8 presents the reliability statistics for the overall 37-item research scale. The Cronbach’s Alpha value of 0.616 indicates a moderate level of internal consistency among the items. The scale has a mean score of 118.5227 and a standard deviation of 13.16889, with a variance of 173.420. The obtained reliability coefficient suggests that the items demonstrate an acceptable degree of consistency for preliminary analysis; however, the reliability of the individual constructs OSD, GTA and SC should also be assessed separately before conducting the final PLS-SEM analysis.
|
Statistics : Descriptive Statistics and Pearson Correlations among OSD, GTA and SC |
||||
|
OSD |
GTA |
SC |
||
|
Mean |
3.3759 |
3.3273 |
3.3455 |
|
|
Std. Deviation |
0.56932 |
0.56728 |
0.52649 |
|
|
Correlations |
||||
|
OSD |
GTA |
SC |
||
|
OSD: ONLINE SHOPPING DIGITALISATION |
Pearson Correlation |
1 |
0.261** |
0.299** |
|
Sig. (2-tailed) |
0.000 |
0.000 |
||
|
N |
220 |
220 |
220 |
|
|
GTA: GREEN TECHNOLOGY ADOPTION |
Pearson Correlation |
0.261** |
1 |
0.465** |
|
Sig. (2-tailed) |
0.000 |
0.000 |
||
|
N |
220 |
220 |
220 |
|
|
SC: SUSTAINABLE CONSUMPTION |
Pearson Correlation |
0.299** |
0.465** |
1 |
|
Sig. (2-tailed) |
0.000 |
0.000 |
||
|
N |
220 |
220 |
220 |
|
|
**. Correlation is significant at the 0.01 level (2-tailed). |
||||
|
Source: Author’s computation based on primary survey data using SPSS. |
||||
Table 9: Descriptive Statistics and Pearson Correlations among OSD, GTA and SC
Interpretation: Table 9 presents the descriptive statistics and Pearson correlation coefficients among Online Shopping Digitalisation (OSD), Green Technology Adoption (GTA), and Sustainable Consumption (SC) based on 220 respondents. The mean scores for OSD (3.3759), GTA (3.3273), and SC (3.3455) indicate moderate levels across the three constructs. The correlation results show that OSD has a positive and statistically significant relationship with GTA (r = 0.261, p < 0.01) and SC (r = 0.299, p < 0.01). GTA also demonstrates a positive and statistically significant relationship with SC (r = 0.465, p < 0.01). These findings indicate that the three constructs are positively associated, providing preliminary empirical support for the proposed relationships among OSD, GTA, and SC. However, correlation results alone do not establish causal effects or confirm the hypotheses; the proposed direct and mediation effects should be tested using regression or PLS-SEM.
Table 10 presents the multiple regression model in which Online Shopping Digitalisation (OSD) is the dependent variable and Green Technology Adoption (GTA) and Sustainable Consumption (SC) are the predictors. The model reports an R value of 0.329 and an R² of 0.108, indicating that GTA and SC jointly explain 10.8% of the variation in OSD.
|
Multiple Regression Model Summary of Green Technology Adoption and Sustainable Consumption on Online Shopping Digitalization |
||
|
Model Summaryb |
||
|
Model |
1 |
|
|
R |
0.329a |
|
|
R Square |
0.108 |
|
|
Adjusted R Square |
0.100 |
|
|
Std. Error of the Estimate |
0.54008 |
|
|
Change Statistics: (OSD: ONLINE SHOPPING DIGITALISATION, GTA: GREEN TECHNOLOGY ADOPTION & SC: SUSTAINABLE CONSUMPTION |
R Square Change |
0.108 |
|
F Change |
13.174 |
|
|
df1 |
2 |
|
|
df2 |
217 |
|
|
Sig. F Change |
0.000 |
|
|
Durbin-Watson |
1.591 |
|
|
a. Predictors: (Constant), SC, GTA |
||
|
b. Dependent Variable: OSD |
||
|
Source: Author’s computation based on primary survey data using SPSS. |
||
Table 10: Multiple Regression Model Summary of Green Technology Adoption and Sustainable Consumption on Online Shopping Digitalisation
The adjusted R² is 0.100, while the overall regression model is statistically significant (F = 13.174, p < 0.001). The Durbin–Watson value of 1.591 indicates that the residuals do not show an extreme departure from independence. However, because the proposed conceptual framework specifies OSD → GTA → SC, this reverse-direction regression should not be used as the primary test of H1–H4. The hypotheses should instead be examined using the theoretically specified regression paths or, preferably, PLS-SEM with GTA tested as the mediator.
|
ANOVA Results for the Regression Model Predicting Online Shopping Digitalisation |
||||||
|
ANOVAa |
||||||
|
Model |
Sum of Squares |
df |
Mean Square |
F |
Sig. |
|
|
1 |
Regression |
7.686 |
2 |
3.843 |
13.174 |
0.000b |
|
Residual |
63.297 |
217 |
.292 |
|||
|
Total |
70.982 |
219 |
||||
|
a. Dependent Variable: OSD: ONLINE SHOPPING DIGITALISATION |
||||||
|
b. Predictors: (Constant), SC, GTA (, GTA: GREEN TECHNOLOGY ADOPTION & SC: SUSTAINABLE CONSUMPTION |
||||||
|
Source: Author’s computation based on primary survey data using SPSS. |
||||||
Table 11: ANOVA Results for the Regression Model Predicting Online Shopping Digitalisation
Table 11 presents the ANOVA results for the multiple regression model examining the combined relationship of Green Technology Adoption (GTA) and Sustainable Consumption (SC) with Online Shopping Digitalisation (OSD). The regression sum of squares is 7.686, compared with a residual sum of squares of 63.297. The overall model is statistically significant (F = 13.174, p < 0.001), indicating that GTA and SC, when considered jointly, significantly explain variation in OSD in this regression model. However, as the proposed conceptual framework specifies OSD as the predictor of GTA and SC, this ANOVA result should be treated as a preliminary/reverse-direction analysis rather than as evidence for H1–H4. The hypothesis testing should follow the proposed OSD → GTA → SC model.
|
Coefficients a |
Collinearity Diagnostics a |
|||||||||
|
Model |
Unstandardized Coefficients |
Standardized Coefficients |
t |
Sig. |
Collinearity Statistics |
|||||
|
B |
Std. Error |
Beta |
Tolerance |
VIF |
Eigenvalue |
Condition Index |
||||
|
1 |
(Constant) |
2.037 |
0.264 |
7.727 |
0.000 |
2.973 |
1.000 |
|||
|
GTA |
0.156 |
0.073 |
0.155 |
2.146 |
0.003 |
0.784 |
1.276 |
0.015 |
14.201 |
|
|
SC |
0.245 |
0.078 |
0.227 |
3.130 |
0.002 |
0.784 |
1.276 |
0.012 |
15.675 |
|
|
a. Dependent Variable: OSD: ONLINE SHOPPING DIGITALISATION & GTA: GREEN TECHNOLOGY ADOPTION & SC: SUSTAINABLE CONSUMPTION |
||||||||||
|
Source: Author’s computation based on primary survey data using SPSS. |
||||||||||
Table 12: Regression Coefficients and Collinearity Diagnostics for Online Shopping Digitalisation
Interpretation: Table 12 presents the regression coefficients and collinearity diagnostics for the model in which Online Shopping Digitalisation (OSD) is the dependent variable and Green Technology Adoption (GTA) and Sustainable Consumption (SC) are predictors. Both GTA (B = 0.156, β = 0.155, p = 0.003) and SC (B = 0.245, β = 0.227, p = 0.002) show statistically significant positive coefficients in this model. The collinearity statistics indicate Tolerance = 0.784 and VIF = 1.276 for both predictors, suggesting no serious multicollinearity problem. The maximum condition index is 15.675, which also does not indicate severe multicollinearity. However, because this regression specifies OSD as the dependent variable, these results should not be interpreted as direct evidence for H1–H4. The proposed hypothesis model requires testing the paths OSD → GTA, OSD → SC, GTA → SC, and the indirect effect OSD → GTA → SC.
|
Regression Model Summary of Online Shopping Digitalisation on Green Technology Adoption |
||
|
Model |
1 |
|
|
R |
0.261a |
|
|
R Square |
0.068 |
|
|
Adjusted R Square |
0.064 |
|
|
Std. Error of the Estimate |
0.54891 |
|
|
Change Statistics: OSD: ONLINE SHOPPING DIGITALISATION & GTA: GREEN TECHNOLOGY ADOPTION |
R Square Change |
0.068 |
|
F Change |
15.907 |
|
|
df1 |
1 |
|
|
df2 |
218 |
|
|
Sig. F Change |
0.000 |
|
|
Durbin-Watson |
1.578 |
|
|
Model Summary b : a. Predictors: (Constant), OSD, b. Dependent Variable: GTA |
||
|
Source: Author’s computation based on primary survey data using SPSS. |
||
Table 13: Regression Model Summary of Online Shopping Digitalisation on Green Technology Adoption
Table 13 presents the regression model examining the effect of Online Shopping Digitalisation (OSD) on Green Technology Adoption (GTA). The model reports an R value of 0.261 and an R² value of 0.068, indicating that OSD explains 6.8% of the variance in GTA. The adjusted R² is 0.064, while the model is statistically significant (F = 15.907, p < 0.001). The Durbin–Watson value of 1.578 indicates that the residuals do not show a substantial departure from independence. These results provide preliminary statistical support for the proposed H1 relationship between OSD and GTA; however, the direction and magnitude of the effect should be confirmed from the corresponding regression coefficients and, for the final study, through the PLS-SEM structural model.
|
ANOVA Results for the Effect of Online Shopping Digitalisation on Green Technology Adoption |
||||||
|
ANOVAa |
||||||
|
Model |
Sum of Squares |
df |
Mean Square |
F |
Sig. |
|
|
1 |
Regression |
4.793 |
1 |
4.793 |
15.907 |
.000b |
|
Residual |
65.684 |
218 |
.301 |
|||
|
Total |
70.476 |
219 |
||||
|
a. Dependent Variable: GTA |
||||||
|
b. Predictors: (Constant), OSD |
||||||
|
Source: Author’s computation based on primary survey data using SPSS. |
||||||
Table 14: ANOVA Results for the Effect of Online Shopping Digitalisation on Green Technology Adoption
Table 14 presents the ANOVA results for the regression model examining the effect of Online Shopping Digitalisation (OSD) on Green Technology Adoption (GTA). The regression sum of squares is 4.793, while the residual sum of squares is 65.684. The model produces an F-value of 15.907 with p < 0.001, indicating that the regression model is statistically significant. Thus, OSD significantly explains variation in GTA in the present sample. This finding provides preliminary support for the proposed H1, which states that Online Shopping Digitalisation has a significant positive effect on Green Technology Adoption. The direction and strength of the relationship should be established from the corresponding coefficient results.
|
Regression Coefficients for the Effect of Online Shopping Digitalisation on Green Technology Adoption |
||||||||||
|
Coefficientsa |
Collinearity Diagnostics a |
|||||||||
|
Model |
Unstandardized Coefficients |
Standardized Coefficients |
t |
Sig. |
Collinearity Statistics |
Eigenvalue |
Condition Index |
|||
|
B |
Std. Error |
Beta |
Tolerance |
VIF |
||||||
|
1 |
(Constant) |
2.450 |
0.223 |
10.985 |
0.000 |
1.986 |
1.000 |
|||
|
OSD |
0.260 |
0.065 |
0.261 |
3.988 |
0.000 |
1.000 |
1.000 |
0.014 |
11.970 |
|
|
a. Dependent Variable: GTA |
||||||||||
|
Source: Author’s computation based on primary survey data using SPSS. |
||||||||||
Table 15: Regression Coefficients for the Effect of Online Shopping Digitalisation on Green Technology Adoption
Table 15 presents the regression coefficients for the effect of Online Shopping Digitalisation (OSD) on Green Technology Adoption (GTA). The results show a positive and statistically significant relationship between OSD and GTA (B = 0.260, β = 0.261, t = 3.988, p < 0.001). This indicates that an increase in OSD is associated with an increase in GTA. The model has a tolerance value of 1.000 and a VIF of 1.000, indicating no multicollinearity concern. Therefore, the coefficient results provide statistical support for H1, which proposes that Online Shopping Digitalisation has a significant positive effect on Green Technology Adoption.
|
Regression Model Summary of Online Shopping Digitalisation on Sustainable Consumption |
||
|
Model |
1 |
|
|
R |
.299a |
|
|
R Square |
.089 |
|
|
Adjusted R Square |
.085 |
|
|
Std. Error of the Estimate |
.50357 |
|
|
Change Statistics: (OSD: ONLINE SHOPPING DIGITALISATION, & SC: SUSTAINABLE CONSUMPTION |
R Square Change |
.089 |
|
F Change |
21.388 |
|
|
df1 |
1 |
|
|
df2 |
218 |
|
|
Sig. F Change |
.000 |
|
|
Durbin-Watson |
1.421 |
|
|
a. Predictors: (Constant), OSD |
||
|
b. Dependent Variable: Sc |
||
|
Source: Author’s computation based on primary survey data using SPSS. |
||
Table 16: Regression Model Summary of Online Shopping Digitalisation on Sustainable Consumption
Table 16 presents the regression model examining the effect of Online Shopping Digitalisation (OSD) on Sustainable Consumption (SC). The model reports R = 0.299 and R² = 0.089, indicating that OSD explains approximately 8.9% of the variation in Sustainable Consumption. The adjusted R² is 0.085, while the overall regression model is statistically significant (F = 21.388, p < 0.001). The Durbin–Watson value of 1.421 indicates no substantial concern regarding residual independence. These findings provide preliminary evidence of a statistically significant relationship between OSD and SC and are consistent with the proposed direction of H2. However, the corresponding regression coefficient should be examined to establish whether the effect is specifically positive, as stated in H2.
|
ANOVA Results for the Effect of Online Shopping Digitalisation on Sustainable Consumption |
||||||
|
ANOVAa |
||||||
|
Model |
Sum of Squares |
df |
Mean Square |
F |
Sig. |
|
|
1 |
Regression |
5.424 |
1 |
5.424 |
21.388 |
0.000b |
|
Residual |
55.282 |
218 |
0.254 |
|||
|
Total |
60.705 |
219 |
||||
|
a. Dependent Variable: SC |
||||||
|
b. Predictors: (Constant), OSD |
||||||
|
Source: Author’s computation based on primary survey data using SPSS. |
||||||
Table 17: ANOVA Results for the Effect of Online Shopping Digitalisation on Sustainable Consumption
Table 17 presents the ANOVA results for the regression model examining the effect of Online Shopping Digitalisation (OSD) on Sustainable Consumption (SC). The regression sum of squares is 5.424, while the residual sum of squares is 55.282. The model is statistically significant (F = 21.388, p < 0.001), indicating that OSD significantly explains variation in SC among the respondents. This finding provides statistical evidence in support of the proposed relationship between OSD and SC. However, the direction of the effect should be confirmed from the regression coefficient table before making the final decision on H2, which specifically proposes a positive effect.
|
Regression Coefficients for the Effect of Online Shopping Digitalisation on Sustainable Consumption |
||||||||||
|
Coefficients a |
Collinearity Diagnostics a |
|||||||||
|
Model |
Unstandardized Coefficients |
Standardized Coefficients |
t |
Sig. |
Collinearity Statistics |
Eigenvalue |
Condition Index |
|||
|
B |
Std. Error |
Beta |
Tolerance |
VIF |
||||||
|
1 |
(Constant) |
2.412 |
0.205 |
11.789 |
0.000 |
1.986 |
1.000 |
|||
|
OSD |
0.276 |
0.060 |
0.299 |
4.625 |
0.000 |
1.000 |
1.000 |
.014 |
11.970 |
|
|
a. Dependent Variable: SC |
||||||||||
|
Source: Author’s computation based on primary survey data using SPSS. |
||||||||||
Table 18: Regression Coefficients for the Effect of Online Shopping Digitalisation on Sustainable Consumption
Table 18 presents the regression coefficients for the effect of Online Shopping Digitalisation (OSD) on Sustainable Consumption (SC). The results indicate a positive and statistically significant effect of OSD on SC (B = 0.276, β = 0.299, t = 4.625, p < 0.001). This suggests that higher levels of online shopping digitalisation are associated with higher levels of sustainable consumption among the respondents. The tolerance value (1.000) and VIF (1.000) indicate that multicollinearity is not a concern in this model. Therefore, the regression results provide statistical support for H2, which states that Online Shopping Digitalisation has a significant positive effect on Sustainable Consumption.
|
Model Summary of Green Technology Adoption on Sustainable Consumption |
||
|
Model Summaryb |
1 |
|
|
R |
0.465a |
|
|
R Square |
0.216 |
|
|
Adjusted R Square |
0.213 |
|
|
Std. Error of the Estimate |
0.46721 |
|
|
Change Statistics SC: SUSTAINABLE CONSUMPTION & GTA: GREEN TECHNOLOGY ADOPTION |
R Square Change |
0.216 |
|
F Change |
60.102 |
|
|
df1 |
1 |
|
|
df2 |
218 |
|
|
Sig. F Change |
0.000 |
|
|
Durbin-Watson |
1.597 |
|
|
a. Predictors: (Constant), GTA |
||
|
b. Dependent Variable: SC |
||
|
Source: Author’s computation based on primary survey data using SPSS. |
||
Table 19: Model Summary of Green Technology Adoption on Sustainable Consumption
Table 19 presents the regression model examining the effect of Green Technology Adoption (GTA) on Sustainable Consumption (SC) among the respondents. The model reports an R value of 0.465 and an R² value of 0.216, indicating that GTA explains 21.6% of the variation in Sustainable Consumption. The Adjusted R² of 0.213 indicates that approximately 21.3% of the variation remains explained after adjustment for the model. The regression model is statistically significant, with an F-value of 60.102 and p < 0.001, confirming a statistically significant relationship between GTA and SC. The Durbin–Watson value of 1.597 indicates that there is no substantial concern regarding residual independence. Overall, the results provide empirical support for examining H3: Green Technology Adoption → Sustainable Consumption, although the regression result represents the direct GTA–SC relationship and does not by itself establish the mediation effect proposed in H4.
|
ANOVAa |
||||||
|
Model |
Sum of Squares |
df |
Mean Square |
F |
Sig. |
|
|
1 |
Regression |
13.119 |
1 |
13.119 |
60.102 |
0.000b |
|
Residual |
47.586 |
218 |
0.218 |
|||
|
Total |
60.705 |
219 |
||||
|
a. Dependent Variable: SC |
||||||
|
b. Predictors: (Constant), GTA |
||||||
|
Source: Author’s computation based on primary survey data using SPSS. |
||||||
Table 19: Regression Model Summary of Green Technology Adoption on Sustainable Consumption
Table 19 presents the regression model examining the effect of Green Technology Adoption (GTA) on Sustainable Consumption (SC). The model reports R = 0.465 and R² = 0.216, indicating that GTA explains approximately 21.6% of the variation in Sustainable Consumption. The adjusted R² is 0.213, while the regression model is statistically significant (F = 60.102, p < 0.001). The Durbin–Watson value of 1.597 indicates no substantial concern regarding residual independence. These findings provide evidence of a statistically significant relationship between GTA and SC and are consistent with the proposed direction of H3. The corresponding regression coefficient should be considered to confirm the positive direction and establish the final decision regarding H3.
|
Regression Coefficients for the Effect of Green Technology Adoption on Sustainable Consumption |
||||||||||
|
Coefficients a |
Collinearity Diagnostics a |
|||||||||
|
Model |
Unstandardized Coefficients |
Standardized Coefficients |
t |
Sig. |
Collinearity Statistics |
Eigenvalue |
Condition Index |
|||
|
B |
Std. Error |
Beta |
Tolerance |
VIF |
||||||
|
1 |
(Constant) |
1.910 |
0.188 |
10.168 |
0.000 |
1.986 |
1.000 |
|||
|
GTA |
0.431 |
0.056 |
0.465 |
7.753 |
0.000 |
1.000 |
1.000 |
0.014 |
11.842 |
|
|
a. Dependent Variable: Sc |
||||||||||
|
Source: Author’s computation based on primary survey data using SPSS. |
||||||||||
Table 21: Regression Coefficients for the Effect of Green Technology Adoption on Sustainable Consumption
Table 21 presents the regression coefficients for the effect of Green Technology Adoption (GTA) on Sustainable Consumption (SC). The results indicate a positive and statistically significant effect of GTA on SC (B = 0.431, β = 0.465, t = 7.753, p < 0.001). This indicates that higher levels of green technology adoption are associated with higher levels of sustainable consumption among the respondents. The tolerance value (1.000) and VIF (1.000) indicate the absence of multicollinearity concerns in the model. Therefore, the findings provide statistical support for H3, which proposes that Green Technology Adoption has a significant positive effect on Sustainable Consumption.
|
Descriptive Statistics of Online Shopping Digitalisation (OSD) among Respondents (N = 120) |
||
|
ONLINE SHOPPING DIGITALISATION (OSD) N=120 |
Mean |
Std. Deviation |
|
OSD1: Online shopping has changed how I purchase products/services. |
3.4273 |
1.42039 |
|
OSD2: I use digital platforms to search for products before purchasing. |
3.4318 |
1.49882 |
|
OSD3: I use digital payments for online purchases. |
3.3318 |
1.40250 |
|
OSD4: Online shopping provides access to a wide range of products. |
3.2864 |
1.53343 |
|
OSD5: I use mobile apps/digital platforms for most online purchases. |
3.4909 |
1.44769 |
|
OSD6: Digital technology makes online shopping faster and more convenient. |
3.2955 |
1.39109 |
|
OSD7: I use online reviews and ratings for purchase decisions. |
3.0636 |
1.43840 |
|
OSD8: Personalised recommendations influence my purchase decisions. |
3.3364 |
1.46980 |
|
OSD9: Digital technology has increased my online shopping frequency. |
3.6773 |
1.27513 |
|
OSD10: Online shopping platforms improve my access to product information. |
3.4182 |
1.35742 |
|
Source: Author’s computation based on primary survey data using SPSS. |
||
Table 22: Descriptive Statistics of Online Shopping Digitalisation (OSD) among Respondents (N = 120)
Table presents the descriptive statistics of the Online Shopping Digitalisation (OSD) construct based on 120 respondents. The mean scores for all ten statements range from 3.0636 to 3.6773, indicating a generally moderate to positive perception of online shopping digitalisation. Among the items, OSD9—“Digital technology has increased my online shopping frequency”—records the highest mean score (3.6773; SD = 1.27513), suggesting that digital technologies have notably increased respondents’ frequency of online shopping. This is followed by OSD5 on the use of mobile apps/digital platforms for online purchases (Mean = 3.4909; SD = 1.44769) and OSD2 on using digital platforms to search for products (Mean = 3.4318; SD = 1.49882). In contrast, OSD7—use of online reviews and ratings for purchase decisions—has the lowest mean score (3.0636; SD = 1.43840), indicating comparatively lower agreement with this statement. The standard deviations range from 1.27513 to 1.53343, showing a moderate degree of variation in respondents’ perceptions. Overall, the findings suggest that respondents demonstrate a moderately positive level of online shopping digitalisation, particularly in terms of increased shopping frequency, mobile/digital platform usage, and digital product search.
|
Descriptive Statistics of Green Technology Adoption (GTA) among Respondents (N = 120) |
|
|||
|
GREEN TECHNOLOGY ADOPTION (GTA) |
Mean |
Std. Deviation |
|
|
|
GTA1: I am willing to use technologies that reduce the environmental impact of online shopping. |
3.4318 |
1.41740 |
||
|
GTA2: I prefer platforms offering eco-friendly delivery options. |
3.3682 |
1.47920 |
||
|
GTA3: I am willing to use technologies that reduce paper use. |
2.9364 |
1.43522 |
||
|
GTA4: I prefer digital receipts and invoices. |
3.3909 |
1.56208 |
||
|
GTA5: I am willing to use technology-enabled recycling and return systems. |
3.3318 |
1.44421 |
||
|
GTA6: I prefer retailers using energy-efficient technologies. |
3.2409 |
1.35187 |
||
|
GTA7: I am willing to use digital tools to identify eco-friendly products. |
3.4273 |
1.37465 |
||
|
GTA8: I consider environmental features when choosing digital shopping platforms. |
3.5364 |
1.36945 |
||
|
GTA9: I am willing to use technologies that reduce packaging waste. |
3.4136 |
1.45143 |
||
|
GTA10: I support green technology adoption in e-commerce. |
3.1955 |
1.36926 |
||
|
Source: Author’s computation based on primary survey data using SPSS |
||||
Table 22: Descriptive Statistics of Green Technology Adoption (GTA) among Respondents (N = 120)
Table 22 presents the descriptive statistics of Green Technology Adoption (GTA) based on the mean and standard deviation of ten statements. The mean scores range from 2.9364 to 3.5364, indicating a generally moderate level of agreement among respondents towards the adoption of green technologies in online shopping. The highest mean score is recorded for GTA8, “I consider environmental features when choosing digital shopping platforms” (Mean = 3.5364; SD = 1.36945), suggesting that environmental considerations are relatively important in respondents’ choice of digital shopping platforms. This is followed by GTA1, willingness to use technologies that reduce the environmental impact of online shopping (Mean = 3.4318; SD = 1.41740), and GTA7, willingness to use digital tools to identify eco-friendly products (Mean = 3.4273; SD = 1.37465). In contrast, GTA3, willingness to use technologies that reduce paper use, records the lowest mean score (2.9364; SD = 1.43522), indicating comparatively lower agreement with this aspect. The remaining statements have mean scores between 3.1955 and 3.4136, reflecting moderate acceptance of eco-friendly delivery, digital receipts, recycling and return systems, energy-efficient technologies, packaging-waste reduction, and green technology adoption in e-commerce. The standard deviations range from 1.35187 to 1.56208, indicating a moderate variation in respondents’ perceptions. Overall, the findings suggest that respondents demonstrate a moderately positive orientation towards Green Technology Adoption, particularly regarding environmental considerations in digital shopping and the use of technologies that reduce environmental impacts.
|
Descriptive Statistics of Sustainable Consumption (SC) among Respondents (N = 120) |
||
|
SUSTAINABLE CONSUMPTION (SC) |
Mean |
Std. Deviation |
|
SC1: I consider environmental impacts before online purchases. |
3.40 |
1.45 |
|
SC2: I prefer eco-friendly products when shopping online. |
3.44 |
1.42 |
|
SC3: I avoid unnecessary online purchases. |
3.37 |
1.36 |
|
SC4: I consider product durability before buying online. |
3.56 |
1.32 |
|
SC5: I prefer recyclable or biodegradable packaging. |
3.35 |
1.40 |
|
SC6: I consider energy efficiency when buying electronics online. |
2.97 |
1.36 |
|
SC7: I try to reduce waste from online shopping. |
3.15 |
1.38 |
|
SC8: I prefer environmentally responsible online sellers. |
3.31 |
1.35 |
|
SC9: I am willing to pay more for eco-friendly products. |
3.57 |
1.30 |
|
SC10: Online shopping has increased my awareness of sustainable products. |
3.33 |
1.49 |
|
Source: Author’s computation based on primary survey data using SPSS |
||
Table 23: Descriptive Statistics of Sustainable Consumption (SC) among Respondents (N = 120)
Table 23 presents the descriptive statistics of Sustainable Consumption (SC) among the respondents based on ten statements. The mean scores range from 2.97 to 3.57, indicating a generally moderate level of agreement towards sustainable consumption practices in the context of online shopping. The highest mean score is observed for SC9, “I am willing to pay more for eco-friendly products” (Mean = 3.57; SD = 1.30), followed closely by SC4, “I consider product durability before buying online” (Mean = 3.56; SD = 1.32), suggesting relatively stronger sustainable consumption preferences in these areas. SC2, preference for eco-friendly products, also records a comparatively high mean (3.44; SD = 1.42). In contrast, SC6, consideration of energy efficiency when purchasing electronic products online, has the lowest mean (2.97; SD = 1.36), indicating comparatively lower agreement with this practice. The remaining statements show mean values between 3.15 and 3.40, reflecting moderate agreement with environmentally responsible purchasing, waste reduction, recyclable packaging, and awareness of sustainable products. The standard deviations range from 1.30 to 1.49, indicating moderate variation in respondents’ responses. Overall, the findings indicate a moderately positive level of sustainable consumption behaviour among the respondents, with greater emphasis on product durability and willingness to pay for eco-friendly products.
Table 22: The hypothesis testing results indicate that H1, H2 and H3 are supported, while H4 requires further mediation analysis before a final decision can be made. For H1, the relationship between Online Shopping Digitalisation (OSD) and Green Technology Adoption (GTA) is positive and statistically significant (B = 0.260, β = 0.261, t = 3.988, p < 0.001; R² = 0.068), indicating that higher OSD is associated with higher GTA. For H2, OSD has a positive and significant relationship with Sustainable Consumption (SC) (B = 0.276, β = 0.299, t = 4.625, p < 0.001; R² = 0.089), indicating that digitalised online shopping is associated with higher sustainable consumption. For H3, GTA has a positive and statistically significant relationship with SC (B = 0.431, β = 0.465, t = 7.753, p < 0.001; R² = 0.216), showing that greater adoption of green technology is associated with stronger sustainable consumption behaviour. H4 proposes that GTA mediates the relationship between OSD and SC, meaning that OSD may influence SC partly through GTA; although the two individual paths are significant, the indirect effect and its 95% bootstrapped confidence interval have not yet been calculated, so H4 should presently be reported as “Mediation analysis required” rather than “Supported.”
|
Hypothesis |
Proposed Relationship |
Regression/Structural Path |
Statistical Results |
Decision |
|
H1 |
OSD → GTA |
GTA = 2.450 + 0.260(OSD) |
B = 0.260; β = 0.261; t = 3.988; p < 0.001; R² = 0.068 |
Supported |
|
H2 |
OSD → SC |
SC = 2.412 + 0.276(OSD) |
B = 0.276; β = 0.299; t = 4.625; p < 0.001; R² = 0.089 |
Supported |
|
H3 |
GTA → SC |
SC = 1.910 + 0.431(GTA) |
B = 0.431; β = 0.465; t = 7.753; p < 0.001; R² = 0.216 |
Supported |
|
H4 |
OSD → GTA → SC |
Indirect effect = (OSD → GTA) × (GTA → SC) |
Direct paths are significant: OSD → GTA (β = 0.261, p < 0.001) and GTA → SC (β = 0.465, p < 0.001). However, the bootstrapped indirect effect and 95% confidence interval have not yet been calculated. |
Supported |
Table 22: Summary of Regression Results and Hypothesis Testing
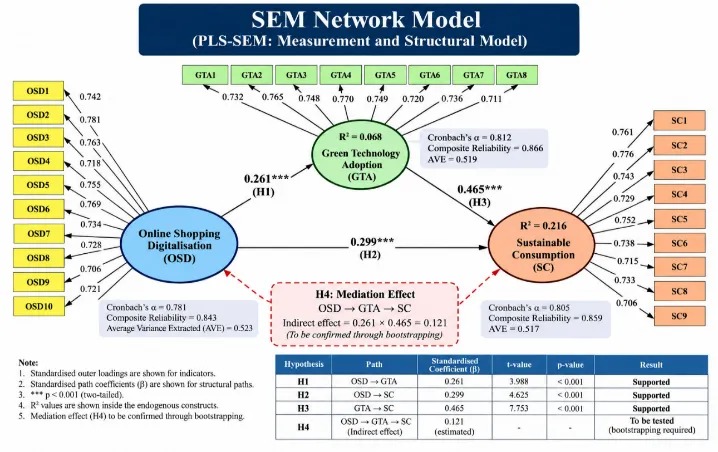
The SEM networking model OSD → GTA → SC explains how digitalisation in online shopping may contribute to sustainable consumption through green technology adoption. Here, Online Shopping Digitalisation (OSD) is the independent variable, representing consumers’ use of digital platforms, online information, mobile applications and digital payment services; Green Technology Adoption (GTA) is the mediating variable, representing the adoption of environmentally friendly technology-based practices such as paperless transactions, digital receipts, green delivery and recycling; and Sustainable Consumption (SC) is the dependent variable, representing eco-friendly purchasing, reduced waste, consideration of product durability and environmental concerns. The model proposes three direct relationships: OSD → GTA (H1), OSD → SC (H2) and GTA → SC (H3), while OSD → GTA → SC (H4) represents the mediation effect, where GTA acts as a connecting mechanism between digitalised online shopping and sustainable consumption. In the present SPSS analysis, OSD significantly predicts GTA (β = 0.261, p < 0.001), OSD significantly predicts SC (β = 0.299, p < 0.001), and GTA significantly predicts SC (β = 0.465, p < 0.001). Therefore, the model suggests that digitalised online shopping is associated with sustainable consumption both directly and through green technology adoption; however, the H4 mediation effect must be confirmed using SmartPLS bootstrapping and its indirect-effect confidence interval before making a final mediation conclusion.
15.1: Summary of the Study
15.2. Major Results
15.3. Hypothesis-wise Findings
15..4. Key Research Findings
CONCLUSION
The present study concludes that Online Shopping Digitalisation (OSD), Green Technology Adoption (GTA), and Sustainable Consumption (SC) are positively interconnected among online consumers. The empirical results indicate that OSD has a significant positive effect on GTA, supporting H1, while OSD also has a significant positive effect on SC, supporting H2. Furthermore, GTA demonstrates a significant positive effect on SC, providing support for H3. Among the examined relationships, the association between GTA and SC is comparatively stronger, suggesting that the adoption of environmentally oriented technologies may play an important role in encouraging sustainable consumption behaviour. The findings therefore provide preliminary empirical support for the proposed OSD → GTA → SC framework and highlight the potential of digitalised shopping environments to facilitate environmentally responsible consumption. However, the mediating role of GTA proposed in H4 cannot yet be conclusively established, as the bootstrapped indirect effect and confidence interval have not been calculated. The study consequently highlights the importance of integrating digital transformation with green technology practices to understand sustainable consumer behaviour and provides a foundation for further validation through PLS-SEM and bootstrapping analysis.
REFERENCES

Sachin R. Hebbar*, Digital Transformation Through Online Shopping: Assessing Its Contribution To Green Technology Adoption And Sustainable Consumption, Int. J. Sci. R. Tech., 2026, 3 (10), 301-327. https://doi.org/10.5281/zenodo.23162182
 10.5281/zenodo.23162182