

We use cookies to ensure our website works properly and to personalise your experience. Cookies policy
1Department of Commerce, Valluvar College of Science and Management, Karur – 639 003, India
2Department of Commerce with Computer Applications, Sri Krishna Adithya College of Arts & Science, Coimbatore – 641 042
The rapid penetration of smartphones and low-cost mobile data across rural Tamil Nadu has opened a new channel for agricultural knowledge transfer: online agricultural education delivered through YouTube channels, mobile applications, WhatsApp farmer groups, and webinar-based extension programs. This study examines the impact of online agricultural education on the farming practices of cultivators in Karur City, Tamil Nadu. Using a descriptive-cum-analytical research design, primary data were collected from a sample of 90 farming respondents selected through convenience-cum-purposive sampling and analyzed using percentage analysis, the Chi-square test of independence, Karl Pearson's coefficient of correlation, Spearman's rank correlation, and one-way Analysis of Variance (ANOVA). The results indicate that a majority of respondents perceive online agricultural education as having a moderate-to-positive influence on awareness, adoption of new practices, yield improvement, accessibility, and overall satisfaction, with a statistically significant positive correlation (r = 0.609, p < 0.001) between weekly usage of online platforms and the composite improvement score. The Chi-square test revealed a significant association between age group and the level of adoption of online agricultural education (?² = 14.510, df = 6, p = 0.024), while one-way ANOVA showed no statistically significant difference in satisfaction across farm size categories (F = 0.337, p = 0.715). The study concludes with practical suggestions for policymakers, agricultural universities, and digital content developers to strengthen the reach and effectiveness of online agricultural education among small and marginal farmers.
Agriculture continues to be the backbone of the economy of Tamil Nadu, and Karur City and its surrounding agrarian belt support a substantial population dependent on paddy, banana, turmeric, maize, and vegetable cultivation. For decades, agricultural knowledge in this region has been transmitted mainly through government extension officers, Krishi Vigyan Kendras (KVKs), cooperative societies, input dealers, and inter-farmer word of mouth. The last decade, however, has witnessed a rapid transformation of this knowledge ecosystem with the near-universal spread of smartphones, inexpensive mobile data, and vernacular digital content.
Online agricultural education, in the context of this study, refers to any structured or semi-structured learning that farmers access through digital channels, such as YouTube agricultural channels, mobile applications such as Kisan Suvidha and AgriApp, WhatsApp and Telegram farmer groups, webinars conducted by agricultural universities, and short video platforms carrying crop-specific advisories. Unlike traditional extension, online agricultural education is available on demand, in the farmer's own time, in the local language, and often at a negligible cost. Simultaneously, concerns persist regarding the reliability of the content, the digital literacy required to use these platforms effectively, and whether exposure to online content actually translates into a measurable change in field-level farming practices.
Karur, a semi-urban agrarian center with reasonably good mobile network coverage, provides a useful setting for empirically examining this question. Therefore, this study investigates the extent to which farmers in Karur City are exposed to online agricultural education, how they perceive its usefulness, and whether such exposure is statistically associated with changes in awareness, adoption of new practices, productivity, and overall satisfaction. The study is quantitative in nature and uses a structured questionnaire administered to 90 respondents, with the resulting data examined through percentage analysis, chi-square test, correlation, rank correlation, and one-way ANOVA.
REVIEW OF LITERATURE
In a widely cited review of information and communication technology (ICT) interventions in agriculture, Aker (2011) observed that mobile-phone-based information services can reduce information asymmetries faced by smallholder farmers and improve their bargaining position, although the magnitude of impact depends heavily on the quality and timeliness of the content delivered.
The Food and Agriculture Organization's e-agriculture strategy guide has similarly emphasized that digital extension is most effective when it complements, rather than replaces, face-to-face extension services, since trust in the source of information remains a critical determinant of whether farmers act on the advice received.
Studies on Indian digital extension platforms have generally reported that younger and more educated farmers are more likely to adopt smartphone-based learning, while older farmers continue to rely on personal networks and government extension staff. This pattern is attributed to differences in digital literacy rather than the perceived usefulness of the content itself.
Research on WhatsApp-based farmer groups in South India found that peer-to-peer sharing of short videos on pest management and fertilizer scheduling increases the speed with which new practices spread within a village. However, the same studies caution that misinformation can spread through the same channels in the absence of moderation by qualified agricultural extension officers.
Work examining YouTube-based agricultural channels has reported a positive association between the frequency of video consumption and self-reported adoption of practices such as line sowing, integrated pest management, and soil-test-based fertilizer application, findings that are broadly consistent with the diffusion-of-innovations framework, under which observability and trialability of a practice accelerate its adoption once awareness has been created.
Simultaneously, several authors note a persistent 'last-mile' gap: awareness generated through digital content does not automatically translate into adoption unless farmers have access to complementary inputs, credit, and local agronomic conditions that make the recommended practice feasible. This gap forms an important backdrop for the present study, which examines not only awareness but also self-reported adoption, yield impact, accessibility, and satisfaction as five distinct dimensions of the impact of online agricultural education.
Taken together, the literature suggests three broad expectations that this study tests empirically for Karur City: (i) younger and more educated farmers are likely to report a higher level of adoption of online agricultural education; (ii) greater usage of online platforms is likely to be positively correlated with self-reported improvement in farming practices; and (iii) the relative importance farmers attach to features such as cost, flexibility, and language accessibility is likely to broadly mirror the priorities recognized by agricultural extension professionals, even if the exact ranking differs.
OBJECTIVES OF THE STUDY
The present study was undertaken with the following specific objectives:
Hypotheses of the Study
Based on the objectives above, the following null hypotheses (H0) were formulated and tested.
RESEARCH METHODOLOGY
4.1 Research Design
This study adopts a descriptive-cum-analytical research design, appropriate for capturing farmers' existing perceptions and testing statistical associations without manipulating any variable.
4.2 Area and Period of the Study
The study was confined to Karur City and its adjoining agrarian localities in Tamil Nadu, India. Primary data were collected over four weeks.
4.3 Sample Size and Sampling Technique
A sample of 90 farming respondents was selected using a combination of convenience and purposive sampling, ensuring representation across different age groups, educational backgrounds, and farm size categories. The sample size of 90 was considered adequate for the parametric and non-parametric tests employed, given the exploratory and descriptive scope of the study.
4.4 Tools for Data Collection
A structured questionnaire was administered in person and through a Google Form (in Tamil and English), consisting of two parts: Part A captured socio-demographic details, and Part B contained the five core statements measured on a five-point Likert scale (1 = Strongly Disagree to 5 = Strongly Agree) covering awareness, adoption, yield improvement, accessibility, and satisfaction. A supplementary ranking question asked the respondents to rank five factors influencing their preference for online agricultural learning.
4.5 Tools for Data Analysis
The collected data were coded in a spreadsheet and analyzed using statistical software. The following tools were used:
4.6 Limitations of the Study
The study is confined to Karur City; hence, the findings cannot be generalized to the entire state. The sample size of 90, while adequate for the statistical tests applied, restricted the extent of the subgroup analysis. Responses were self-reported and may be subject to recall and social desirability bias.
DATA ANALYSIS AND INTERPRETATION
This section presents the results obtained from the 90 completed questionnaires using percentage analysis, the chi-square test, Pearson correlation, Spearman rank correlation, and one-way ANOVA.
5.1 Percentage Analysis — Socio-Demographic Profile
|
Demographic Variable |
Category |
Frequency |
Percentage (%) |
|
Age |
Below 30 years |
26 |
28.9 |
|
​ |
31 – 40 years |
27 |
30.0 |
|
​ |
41 – 50 years |
24 |
26.7 |
|
​ |
Above 50 years |
13 |
14.4 |
|
Gender |
Male |
68 |
75.6 |
|
​ |
Female |
22 |
24.4 |
|
Educational Qualification |
No formal education |
10 |
11.1 |
|
​ |
School level |
29 |
32.2 |
|
​ |
Diploma / ITI |
28 |
31.1 |
|
​ |
Graduate & above |
23 |
25.6 |
|
Farming Experience |
Below 5 years |
22 |
24.4 |
|
​ |
5 – 10 years |
29 |
32.2 |
|
​ |
11 – 20 years |
28 |
31.1 |
|
​ |
Above 20 years |
11 |
12.2 |
|
Farm Size |
Small (< 2.5 acres) |
40 |
44.4 |
|
​ |
Medium (2.5 – 5 acres) |
29 |
32.2 |
|
​ |
Large (> 5 acres) |
21 |
23.3 |
|
Device used |
Smartphone |
48 |
53.3 |
|
​ |
Computer / Laptop |
8 |
8.9 |
|
​ |
Both |
34 |
37.8 |
Table 1: Socio-demographic Profile of Respondents (N = 90)
Table 1 presents the socio-demographic profiles of the 90 respondents.
Table 1 shows that most respondents (58.9%) were below years below-40 age bracket, indicating that online agricultural education in Karur is disproportionately reaching younger farmers. Male respondents dominated the sample (75.6%), reflecting the gender composition typically observed among primary cultivators in the region. Nearly 57% of the respondents hold a diploma or graduate-level qualification, and 44.4% operate small landholdings of less than 2.5 acres. A little over half of the respondents (53.3%) accessed online content exclusively through a smartphone, underlining the centrality of mobile-based delivery for any digital extension strategy targeted at this population.
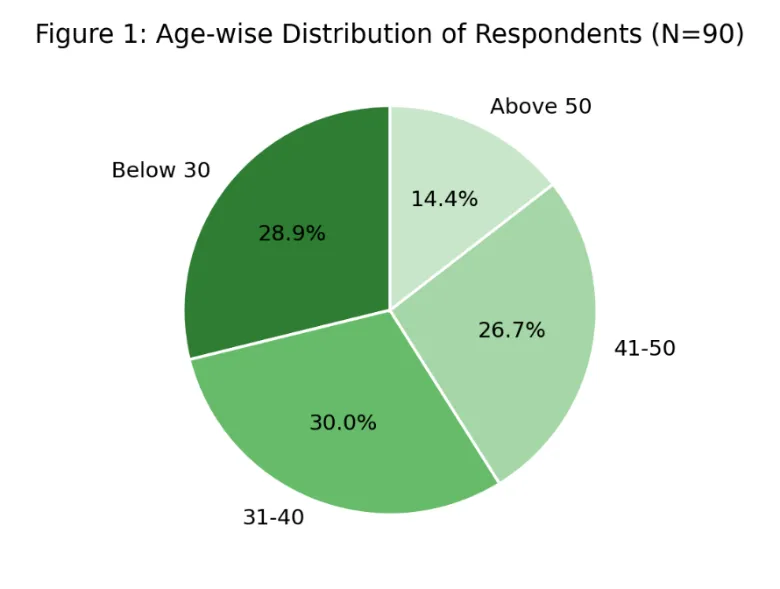
Figure 1: Age-wise Distribution of Respondents (N = 90)
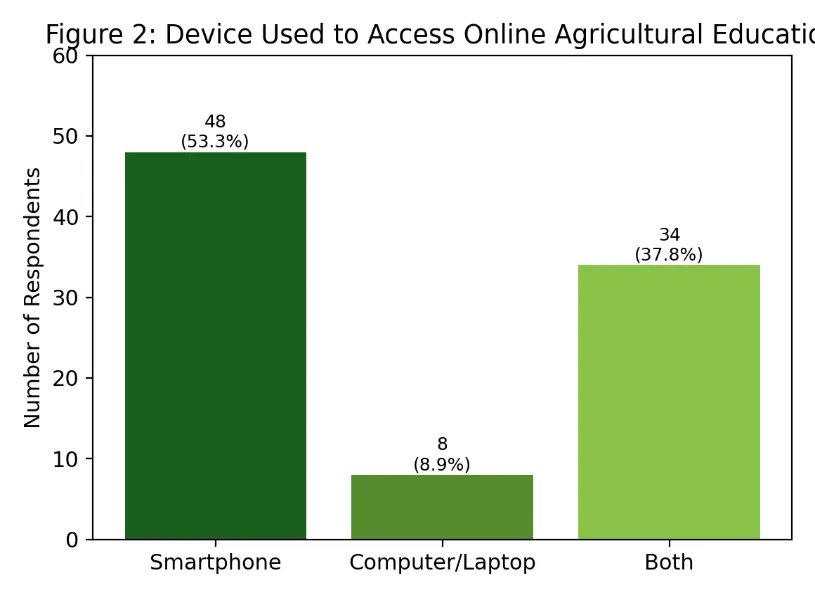
Figure 2: Device Used to Access Online Agricultural Education
5.2 Combined Questionnaire Table — Five Core Perception Statements
Respondents rated five statements relating to online agricultural education on a five-point Likert scale (1 = Strongly Disagree, 5 = Strongly Agree). Table 2 consolidates the frequency and percentage distribution of all five statements in a single table, as required for the study.
|
Response Category |
Q1. Increased Awareness |
Q2. Adoption of New Practices |
Q3. Improved Yield / Productivity |
Q4. Content Easily Accessible |
Q5. Overall Satisfaction |
|
Strongly Disagree (1) |
1 (1.1%) |
4 (4.4%) |
2 (2.2%) |
3 (3.3%) |
0 (0.0%) |
|
Disagree (2) |
12 (13.3%) |
13 (14.4%) |
15 (16.7%) |
13 (14.4%) |
12 (13.3%) |
|
Neutral (3) |
33 (36.7%) |
36 (40.0%) |
33 (36.7%) |
25 (27.8%) |
31 (34.4%) |
|
Agree (4) |
27 (30.0%) |
30 (33.3%) |
29 (32.2%) |
38 (42.2%) |
31 (34.4%) |
|
Strongly Agree (5) |
17 (18.9%) |
7 (7.8%) |
11 (12.2%) |
11 (12.2%) |
16 (17.8%) |
|
Mean Score |
3.52 |
3.26 |
3.36 |
3.46 |
3.57 |
|
Standard Deviation |
0.99 |
0.95 |
0.98 |
1.00 |
0.94 |
Table 2: Consolidated Responses to the Five Core Questionnaire Statements (N = 90)
Table 2 shows that all five mean scores lie above the midpoint of 3.00 on the five-point scale, indicating an overall favorable perception of online agricultural education. The highest mean score was recorded for Q5 (overall satisfaction, mean = 3.57), followed closely by Q1 (awareness, mean = 3.52) and Q4 (accessibility, mean = 3.46). The lowest, though still positive, mean score was for Q2 (adoption of new practices, mean = 3.26), which is consistent with the 'last-mile gap' identified in the literature: farmers may be aware of and satisfied with online content without necessarily translating every recommendation into field-level practice, often due to resource constraints.
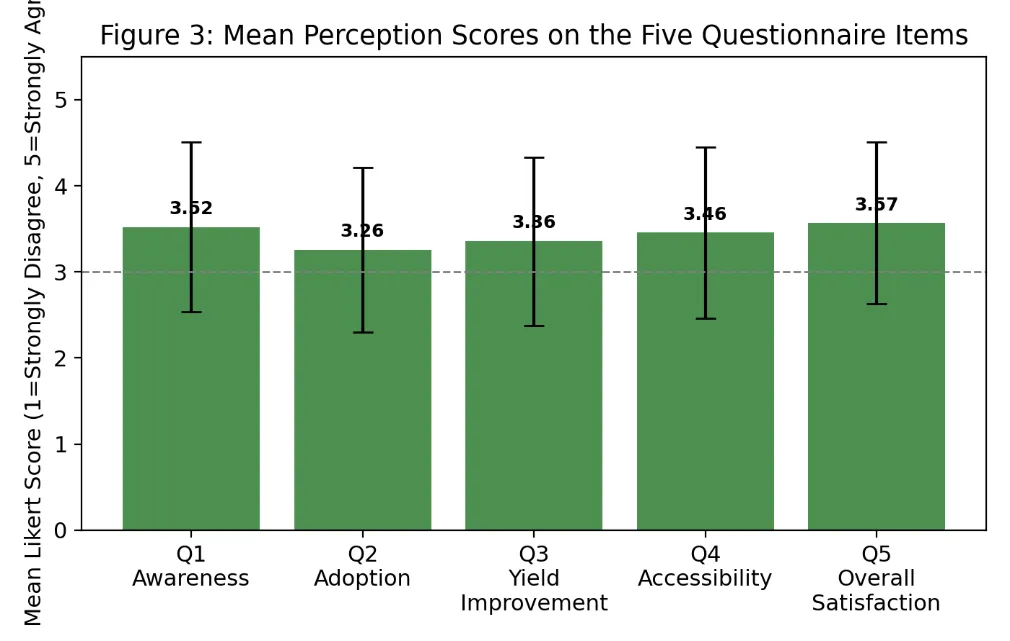
Figure 3: Mean Perception Scores on the Five Questionnaire Items (Error bars = ±1 SD)
5.3 Chi-Square Test — Age Group and Level of Adoption
To test H01, respondents were classified into Low, Medium and High adoption levels based on their response to Q2 (adoption of new practices) and cross-tabulated against age group. Table 3 presents the observed frequencies and the chi-square statistic.
|
Age Group |
Low Adoption |
Medium Adoption |
High Adoption |
Row Total |
|
Below 30 years |
3 |
10 |
13 |
26 |
|
31 – 40 years |
3 |
12 |
12 |
27 |
|
41 – 50 years |
4 |
9 |
11 |
24 |
|
Above 50 years |
7 |
5 |
1 |
13 |
|
Column Total |
17 |
36 |
37 |
90 |
Table 3: Age Group × Level of Adoption Cross-tabulation (N = 90)
The calculated χ² = 14.510, degrees of freedom (df) = (4−1)×(3−1) = 6, and the corresponding p-value = 0.024. Since p < 0.05, the null hypothesis H01 was rejected at the 5% level of significance. This indicates a statistically significant association between the age of the respondent and the level of adoption of online agricultural education: younger respondents (below 40 years) are disproportionately represented in the High Adoption category, while respondents above 50 years are concentrated in the Low Adoption category, confirming the pattern reported in earlier studies on digital literacy and age.
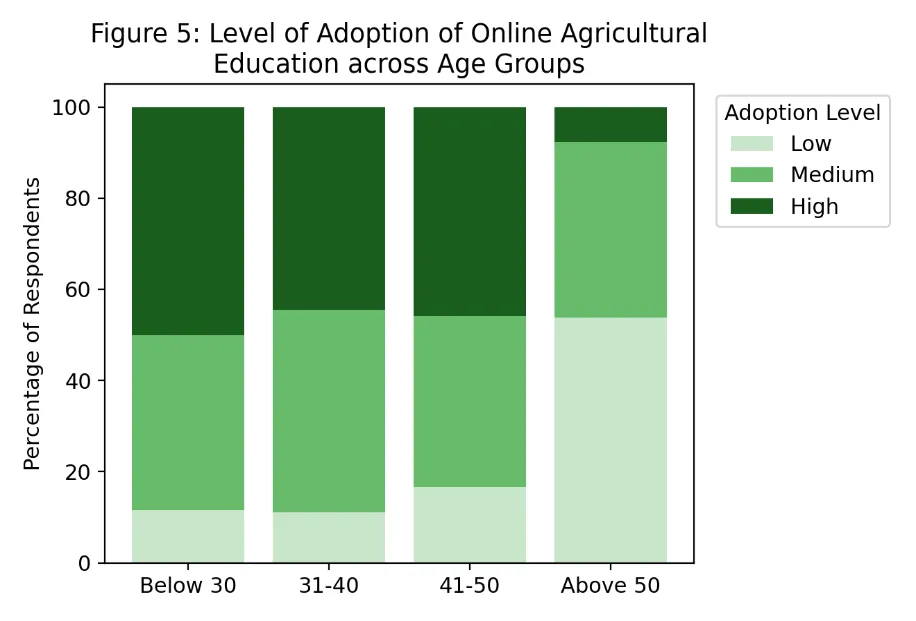
Figure 4: Level of Adoption of Online Agricultural Education across Age Groups (%)
5.4 Correlation Analysis — Usage of Online Platforms and Improvement in Farming Practices
To test H02, Karl Pearson's coefficient of correlation was computed between the weekly hours spent by respondents on online agricultural platforms and their composite improvement score (the mean of the five Likert items listed in Table 2).
|
Statistic |
Value |
|
Sample size (N) |
90 |
|
Mean weekly usage (hours) |
4.1 |
|
Mean composite improvement score |
3.43 (out of 5) |
|
Pearson's correlation coefficient (r) |
0.609 |
|
Coefficient of determination (r²) |
0.371 |
|
p-value |
< 0.001 |
Table 4: Pearson Correlation between Weekly Usage and Composite Improvement Score
The computed value of r = 0.609 indicates a moderate-to-strong positive correlation between the weekly usage of online agricultural platforms and the composite improvement score, significant at the 1% level (p < 0.001). Approximately 37.1% of the variance in the composite improvement score could be statistically explained by the variation in weekly usage hours (r² = 0.371). Therefore, the null hypothesis H02 is rejected, confirming that farmers who spend more time on online agricultural platforms tend to report a more favorable overall impact on their farming practices.
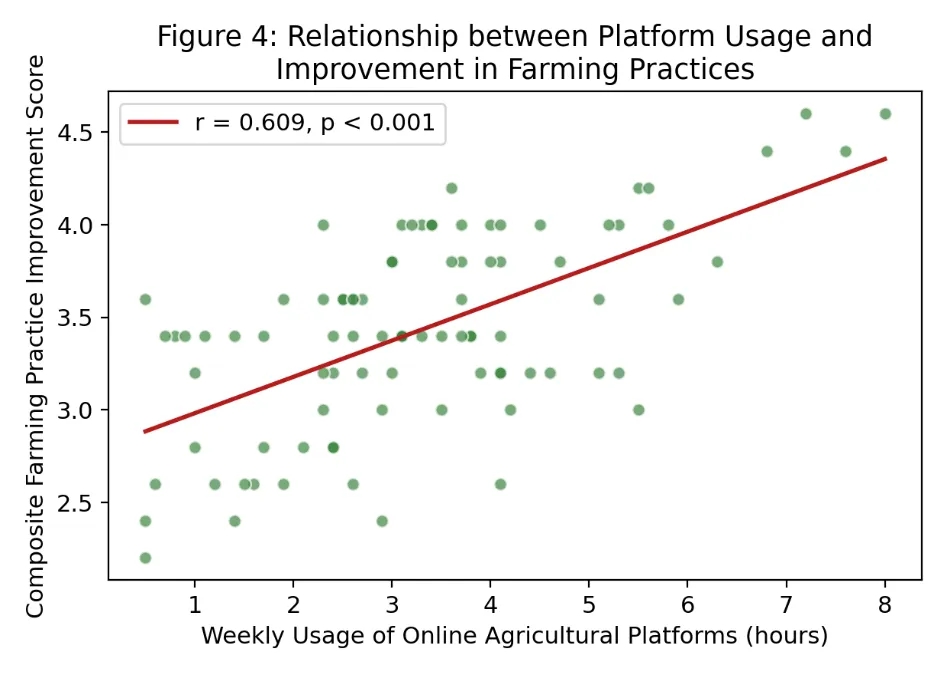
Figure 5: Scatter Plot of Weekly Usage Hours against Composite Improvement Score
5.5 Spearman's Rank Correlation — Farmers' versus Extension Officers' Ranking
Respondents (and, separately, a panel of five agricultural extension officers serving the Karur region) were asked to rank five factors that make online agricultural education attractive from 1 (most important) to 5 (least important). Table 5 presents the two rank orders and the computation of Spearman's rank correlation coefficient.
|
Factor |
Rank by Farmers (X) |
Rank by Extension Officers (Y) |
d = X − Y |
d² |
|
Time flexibility (learn anytime) |
1 |
2 |
-1 |
1 |
|
Cost-effectiveness (free / low-cost) |
2 |
1 |
1 |
1 |
|
Language accessibility (local language) |
3 |
4 |
-1 |
1 |
|
Wide range of topics covered |
4 |
5 |
-1 |
1 |
|
Practical demonstration videos |
5 |
3 |
2 |
4 |
|
Total (Σd²) |
— |
— |
— |
8 |
Table 5: Ranking of Factors Influencing Preference for Online Agricultural Education
Spearman's rank correlation coefficient was computed using the formula ρ = 1 − [6Σd² / n(n²−1)], where n = 5 and Σd² = 8: ρ = 1 − (6 × 8) / (5 × 24) = 1 − 0.400 = 0.600. The obtained value of ρ = 0.600 (p = 0.285, not significant at the conventional 5% level given the small number of ranked items) indicates a moderately strong positive agreement between the priorities of farmers and extension officers. Both groups ranked time flexibility and cost-effectiveness as the two most important attractions of online agricultural education, while they diverged somewhat on the relative importance of practical demonstration videos, which farmers ranked lowest but extension officers ranked third, suggesting that extension officers may overestimate farmers' preference for video-based demonstrations relative to the farmers' own stated priorities.
5.6 One-Way ANOVA — Satisfaction across Farm-Size Categories
To test H03, one-way ANOVA was applied to the satisfaction scores (Q5) of respondents grouped into three farm size categories: Small, Medium and Large.
|
Farm Size Category |
N |
Mean Satisfaction Score |
Std. Deviation |
|
Small (< 2.5 acres) |
40 |
3.62 |
1.05 |
|
Medium (2.5 – 5 acres) |
29 |
3.45 |
0.78 |
|
Large (> 5 acres) |
21 |
3.62 |
0.92 |
Table 6a: Descriptive Statistics of Satisfaction Score by Farm-Size Category
|
Source of Variation |
Sum of Squares |
df |
Mean Square |
F |
p-value |
|
Between Groups |
0.599 |
2 |
0.300 |
0.337 |
0.715 |
|
Within Groups |
77.334 |
87 |
0.889 |
​ |
​ |
|
Total |
77.933 |
89 |
​ |
​ |
​ |
Table 6b: One-Way ANOVA Summary for Satisfaction Score across Farm-Size Categories
The calculated F-value of 0.337 (p = 0.715) was well above the 0.05 significance threshold. Therefore, the null hypothesis H03 cannot be rejected: there is no statistically significant difference in the mean satisfaction score across small, medium, and large farm size categories. This suggests that the perceived benefit of online agricultural education, at least in terms of overall satisfaction, is fairly evenly distributed across farmers, irrespective of the size of their landholding — an encouraging finding from an equity perspective, indicating that online agricultural education is not disproportionately benefiting only large farmers with greater resources.
FINDINGS OF THE STUDY
SUGGESTIONS
CONCLUSION
This study set out to examine the impact of online agricultural education on the farming practices of 90 respondents in Karur City, Tamil Nadu, using percentage analysis, the chi-square test, Pearson correlation, Spearman's rank correlation, and one-way ANOVA. The findings indicate an overall favourable perception of online agricultural education, with mean scores above the midpoint on all five dimensions studied — awareness, adoption, yield improvement, accessibility, and satisfaction. A statistically significant association was found between age and the level of adoption, confirming that younger farmers are more receptive to digital learning channels, while a significant positive correlation between usage intensity and the composite improvement score confirms that sustained engagement with online agricultural platforms is linked to a more favourable perceived impact on farming practices.
Simultaneously, the absence of a significant difference in satisfaction across farm size categories is an encouraging equity signal, suggesting that the benefits of online agricultural education are not confined to larger, better-resourced farmers. The moderately strong agreement between farmers' and extension officers' rankings of influencing factors indicates that extension planners are broadly attuned to farmers' priorities, although a gap remains in the perceived value of demonstration videos that merits further investigation.
Overall, the study concludes that online agricultural education has begun to meaningfully supplement — though not yet replace — traditional extension mechanisms in Karur City and that its full potential will be realized only if awareness-building content is matched with accessible, locally embedded support that helps farmers translate what they learn online into what they practise in the field.
REFERENCES


M. Ponraj1*, R. Padmanaban2, The Impact Of Online Agricultural Education On Farming Practices In Karur City, Int. J. Sci. R. Tech., 2026, 3 (9), 178-189. https://doi.org/10.5281/zenodo.22638719
 10.5281/zenodo.22638719