

We use cookies to ensure our website works properly and to personalise your experience. Cookies policy
1J. S. Singh Institute of pharmacy, Sitapur, Uttar Pradesh India-261207
2Amity Institute of Pharmacy, Amity University Uttar Pradesh Lucknow Campus, India-226028
Introduction: Diabetes mellitus is a disorder associated with high level of glucose in blood which requires prolonged therapy. Metformin hydrochloride and repaglinide are used widely to manage Type II diabetes mellitus. In this study, the objective is to formulate and assess polymeric transdermal patches for sustained delivery of drugs. Method: Solvent casting method was employed in formulating transdermal patches. Hydroxypropyl Methylcellulose, Polyvinyl Pyrrolidone, and Ethyl Cellulose was used as film-forming polymers, while PEG-400 was used as a plasticizer. Six formulations (PF1–PF6) were developed and tested for various parameters. Result: FTIR analysis shows compatibility of drug and excipients. PF6 was chosen as optimised formulation showing the best overall performance with excellent flexibility, smooth appearance, thickness of 0.28 mm, Tensile strength of 0.66 kg/mm2, Percentage elongation 29.6 %, folding endurance of 236, drug content uniformity of 98.3 % and sustained drug release with 98.6% drug release over 12hr. The correlation between the Korsmeyer-Peppas kinetic equation and the experimental results of drug release kinetic data indicated that release process was diffusion-controlled and depended on the polymeric matrix. Discussion: Stability studies conducted under accelerated storage conditions suggest stability with no significant changes. Conclusion: Finding shows that polymeric transdermal patch system was successfully prepared and provided sustained drug release and shows potential of alternative to conventional therapy of diabetes mellitus.
Diabetes mellitus is a disorder associated with increased level of glucose in blood as a result of issues with insulin production, utilization, or both. [1,2] This is the most prevalent endocrine disorders in the world and causes various serious issues related to heart, kidney, and nerve. [3] Glycaemic control requires lifelong treatment using medications, but traditional oral anti-diabetic drugs have various drawbacks like frequent dosage, gastrointestinal problems, poor absorption, fluctuating drug plasma levels, and low compliance. [4-6]
Transdermal drug delivery system (TDDS) is being used lot as a mode of administration of systemic drugs. [7,8] When drugs are administered transdermally, they will be absorbed through skin into blood in a regulated and controlled way hence prolongation of therapeutic effect. [9,10] There are various benefits that transdermal delivery systems have over the traditional routes. [11,12] Bypassing first pass effect, low irritation of the gastrointestinal tract, improved bioavailability, sustained drug release, less frequent doses, improved compliance of patients, and maintenance of relatively steady plasma levels are some benefits of TDDS. [13-15]
Metformin HCL belongs to the biguanides class of anti-diabetic agents which inhibit glucose production in liver and improve insulin action in the periphery. [16,17] Repaglinide is a drug belonging to the meglitinides group; it functions as an insulin secretagogue. [18,19] The combination therapy involving metformin and repaglinide is often used due to synergistic action of these drugs. [20,21] On the other hand, taking these medications orally results in various gastrointestinal side effects, poor absorption, first pass effect, and repeated doses of the drugs. [22-24]
Transdermal delivery of metformin hydrochloride and repaglinide needs to be considered due to the necessity of achieving sustained and uniform drug concentration in plasma. [25,26] There might be some advantages in using TDDS as a way to achieve better results through controlled drug release, maintenance of constant glucose level in blood stream, reduction of side effects, and improvement in patient compliance. [27-30] In view of the foregoing, aim of this research was to develop and assess transdermal patches consisting of metformin hydrochloride and repaglinide.
2. MATERIAL AND METHOD
2.1. Materials
Metformin Hydrochloride and Repaglinide were acquired from Tokyo Chemical Industry (India) Pvt. Ltd., Hydroxypropyl Methylcellulose, Polyvinyl Pyrrolidone, Ethyl Cellulose, Polyethylene Glycol-400 and Propylene Glycol were acquired from CDH New Delhi, India. Methanol and Chloroform were purchased from Rankem, India.
2.2. Drug–Excipient Compatibility Study
For compatibility study of excipients with drug FTIR spectrometry analysis was applied to examine samples of pure medications and drug-polymer mixture in the wavenumber range of 4000-400 cm⻹. [31,32] The presence or absence of the specific peaks in the resulting spectrum was determined. [33]
2.3. Formulation Development
Solvent casting method was employed for preparation of transdermal patch loaded with Metformin Hydrochloride and Repaglinide. [34,35] Silicon molds of appropriate size were taken for casting purpose. [36] HPMC and PVP or Ethyl cellulose were taken in required quantity and solubilised in solvent containing of Methanol and chloroform (1:1). [37,38] Stirring was continued until a homogenous polymeric solution was obtained. [39] The drugs were dissolved in same solvent system and mixed to polymeric solution. [40]
Polyethylene Glycol-400 and Propylene Glycol are then added that are use ad plasticizer and permeation enhancer respectively. [41,42] The solution was subjected to vacuum to get bubble free casting solution. [43] The solution obtained after preparation was placed in a cleaned levelled glass petri dish which had been previously greased with glycerine. [44,45] Slow evaporation of the solvent took place at ambient temperature for 12 hr to give an invariable and flexible layer. [46,47] After drying was completed, patches were carefully retrieved from molds, and packed. [48]
|
Ingredients |
PF1 |
PF2 |
PF3 |
PF4 |
PF5 |
PF6 |
|
Metformin Hydrochloride (mg) |
500 |
500 |
500 |
500 |
500 |
500 |
|
Repaglinide (mg) |
10 |
10 |
10 |
10 |
10 |
10 |
|
HPMC (mg) |
300 |
250 |
200 |
300 |
250 |
200 |
|
PVP (mg) |
200 |
250 |
300 |
- |
- |
- |
|
Ethyl Cellulose (mg) |
- |
- |
- |
200 |
250 |
300 |
|
PEG-400 (ml) |
0.5 |
0.5 |
0.5 |
0.5 |
0.5 |
0.5 |
|
Propylene Glycol (ml) |
0.5 |
0.5 |
0.5 |
0.5 |
0.5 |
0.5 |
|
Methanol : Chloroform (1:1) (ml) |
10 |
10 |
10 |
10 |
10 |
10 |
Table 1: Formulation Table
2.4. Evaluation of Transdermal patch
In order to assess the quality, stability, homogeneity, and release characteristics of transdermal patches prepared from metformin hydrochloride and repaglinide, certain physico-chemical, mechanical and pharmaceutical parameters were analysed. [49,50] In order to ensure the production of effective transdermal delivery systems, certain tests were carried out using standard procedures. [51,52]]
2.4.1. Physical Appearance
Visually, appearance of prepared patches was studied. The general quality and elegance of the preparation were assessed by studying the appearance of the patches under normal light conditions. [53,54]
2.4.2. Thickness
The patches obtained in each formula were measured for their thickness using the digital screw gauge at three different points. For ensuring consistency of film thickness, the mean and standard deviation of thickness was computer. [55,56]
2.4.3. Folding Endurance
For assessing physical strength of transdermal patches one patch was constantly folded in same area until it broke. Number of folds before breaking of patch is folding endurance. [57,58]
2.4.4. Drug Content Uniformity
Homogenous mixing of Repaglinide and Metformin Hydrochloride into the transdermal patches was analysed through drug content determination. [59] In drug content determination, a certain patch of known area was placed into a solvent to dissolve the drug until complete dissolution occurs by constant swirling. Drug content was determined using UV- Spectroscopy. [60]
2.4.5. Moisture Content
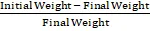
For determining moisture content, weight of individual patches taken and kept in desiccator which contain fused calcium chloride for an entire day and then reweighed. [61,62]
% Moisture Content = Initial Weight - Final Weight Final Weight
2.4.6. Moisture Uptake
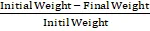
For this studies formulation weight was precisely recorded and kept in desiccator enclosing KCl solution. Patches were removed and weighed again after specified time intervals. [63,64]
% Moisture Uptake = Initial Weight - Final Weight Initil Weight
2.4.7. Tensile Strength
It is performed in order to determine physical strength of formulated system. Tensile strength equipment had two clamps that fixed the transdermal patch. Then, the patch was gradually strained until it got ruptured. [65,66]
2.4.8. Percentage Elongation
Percentage elongation study was performed to evaluate elasticity and flexibility of the transdermal patches. [67,68]
% Elongation = increase in LengthOriginal Length

2.4.9. ln-vitro Drug Release Study
To check release behaviour of Repaglinide and Metformin Hydrochloride from the patches, Franz diffusion cell system was used. [69,70] Patch was put on a dialysis membrane that was fixed between the Franz diffusion cells. The pH 7.4 PO3- buffer was maintained at a suitable temperature and constantly stirred. Sample was taken at different time and restored with fresh buffer solution. Spectrophotometric analysis was done to determine drug content in samples. [71,72]
2.4.10. Drug release kinetics
Release kinetic study of Metformin Hydrochloride and Repaglinide in the developed transdermal patches were investigated by putting data of in-vitro drug release studies in several kinetic models. [73,74]
2.4.11. Stability Studies
For evaluating the impact of storage environment on quality and performance of prepared transdermal patch, stability testing was done. [75] During study, the optimized patch was properly packed and stored under controlled temperature and humidity. Patch properties were periodically evaluated. [76]
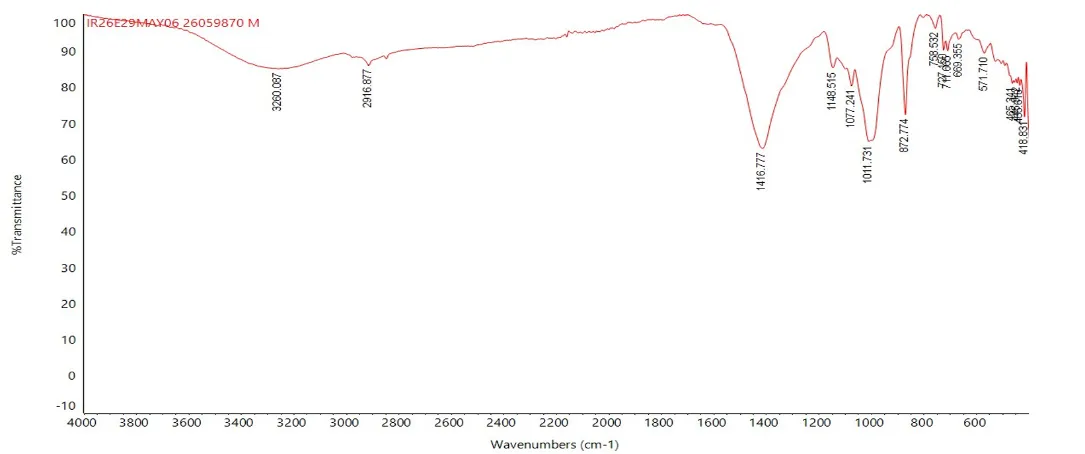
FTIR analysis was employed to study compatibility in drugs and excipients in terms of possible drug-polymers interaction. The FTIR spectrum for pure metformin hydrochloride and repaglinide exhibited unique peaks and mixture spectra of drug and polymers retain all those peaks without any shifts or loss of peaks.
(A)

(B)

(C)
Fig 1: FTIR Spectra of (A) Metformin (B) Repaglinide (C) Drug and Polymer Mixture
3.2. Folding Endurance
Folding endurance of all patches were observed adequate, which shows flexibility. The folding endurance increases with increase in concentration of ethyl cellulose or PVP and found in range of 80 to 96 while PF6 shows highest value of 96. (Table 2)
Tensile strength of patches was found between 0.32 kg/cm2 and 0.61 kg/cm2 with PF6 with highest tensile strength of 0.61 kg/mm2. All formulations exabits good tensile strength. (Table 2)
% Elongation of the patches was found to be in between 21.4 % and 29.6%. The standard deviation value shows that method of formulation development is reproducible which give uniform result. (Table 2)
3.5. Thickness
Thickness of patches were between 0.24 and 0.31 mm. All patches show uniform thickness with little standard deviation of 0.02. (Table 2)
|
Formulation |
Folding Endurance |
Tensile Strength (kg/mm²) |
Percentage Elongation (%) |
Thickness (mm) |
|
PF1 |
80 ± 0.5 |
0.32 ± 0.010 |
21.4 ± 0.004 |
0.47 ± 0.02 |
|
PF2 |
86 ± 0.5 |
0.37 ± 0.005 |
23.9 ± 0.003 |
0.51 ± 0.01 |
|
PF3 |
92 ± 1.0 |
0.48 ± 0.006 |
26.1 ± 0.004 |
0.51 ± 0.01 |
|
PF4 |
84 ± 0.6 |
0.38 ± 0.010 |
27.2 ± 0.002 |
0.48 ± 0.01 |
|
PF5 |
88 ± 1.0 |
0.51 ± 0.010 |
27.8 ± 0.005 |
0.49 ± 0.02 |
|
PF6 |
96 ± 1.0 |
0.61 ± 0.005 |
29.6 ± 0.006 |
0.47 ± 0.01 |
Table 2: Evaluation of Transdermal Patch
Moisture contents of patches were found in the range 1.23 to 2.11 %. Moisture uptake by patches was in the range 4.1 to 6.7 %. With increase in concentration of HPMC moisture contents and moisture uptake percentage increases while it observed low with high concentration of PVP or ethyl cellulose. Low value of moisture uptake is good for stability of formulation. (Table 3)
From this study it is found that all formulation shows satisfactory drug content which range between 92.4-98.3 % with PF6 showing highest percentage of drug content. (Table 3).
|
Formulation |
Moisture Content (%) |
Moisture Uptake (%) |
Drug Content (%) |
|
PF1 |
2.11 ± 0.15 |
6.7 ± 0.20 |
92.17 ± 0.05 |
|
PF2 |
1.91 ± 0.12 |
5.9 ± 0.17 |
94.16 ± 0.04 |
|
PF3 |
1.60 ± 0.10 |
5.3 ± 0.10 |
96.57 ± 0.01 |
|
PF4 |
1.77 ± 0.06 |
5.1 ± 0.15 |
98.58 ± 0.04 |
|
PF5 |
1.57 ± 0.13 |
4.7 ± 0.06 |
96.81 ± 0.02 |
|
PF6 |
1.23 ± 0.15 |
4.1 ± 0.20 |
|
Table 3: Evaluation of Transdermal Patches
The results of drug release study are given in table 4 and shown in figure 4, 5 and 6. Formulation PF4 shows highest percentage drug release 98.6 % over 12 hr time period. The percentage drug release of formulation PF1, PF2, PF3, PF4, PF5 and PF6 was 89.5%, 90.6 %, 93.8%, 98.6%, 86.2% and 84.3% respectively. The drug release from patch was in order as PF6 > PF5 > PF4 > PF3 > PF2 > PF1.
|
Time (hr) |
% Drug reIease |
|||||
|
PF1 |
PF2 |
PF3 |
PF4 |
PF5 |
PF6 |
|
|
1 |
15.2 |
16.8 |
17.4 |
12.2 |
13.4 |
14.1 |
|
2 |
25.8 |
27.5 |
27.6 |
21.6 |
22.7 |
24.3 |
|
4 |
40.8 |
43.1 |
44.2 |
35.9 |
37.6 |
39.4 |
|
6 |
54.1 |
56.2 |
55.4 |
48.5 |
50.3 |
52.8 |
|
8 |
66.4 |
67.8 |
67.6 |
60.8 |
62.7 |
65.2 |
|
10 |
78.1 |
79.2 |
79.4 |
72.6 |
74.8 |
77.4 |
|
12 |
89.5 |
90.6 |
93.8 |
84.3 |
86.2 |
98.6 |
Table 4: ln-vitro Drug ReIease of Transdermal Patches
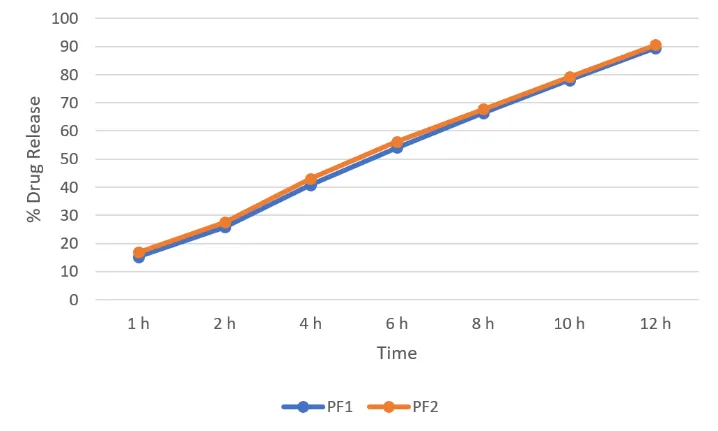
Fig 2: % Drug Release of PF1 and PF2
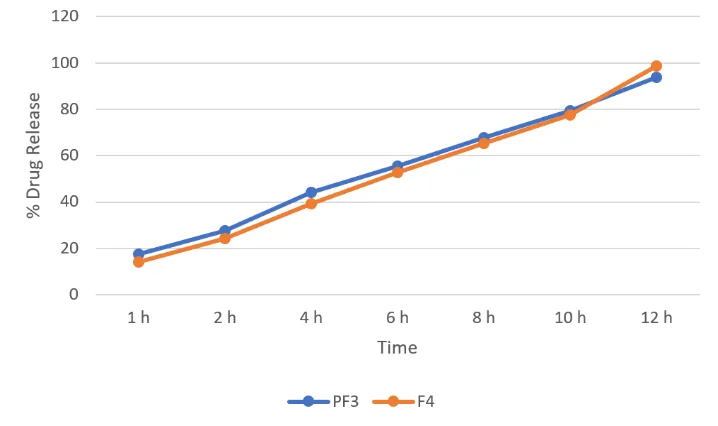
Fig 3: % Drug Release of PF1 and PF2
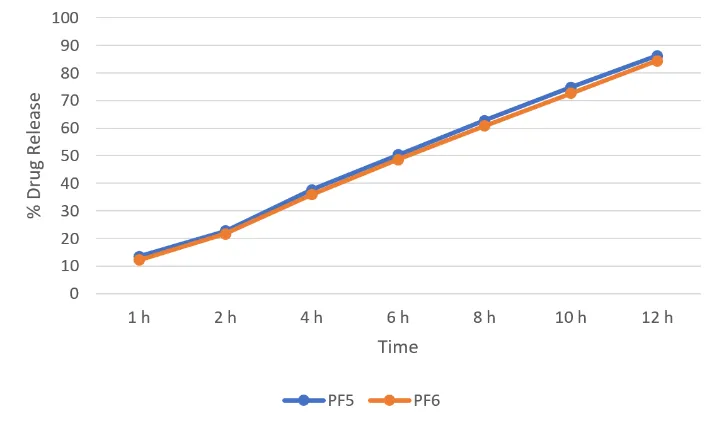
Fig 4: % Drug Release of PF1 and PF2
3.2.12. Drug Release Kinetics
|
Kinetic Model |
Linear Equation |
R² Value |
|
Zero Order |
y = 7.2576x + 8.5316 |
0.9939 |
|
First Order |
y = -0.1274x + 2.2556 |
0.7138 |
|
Higuchi Model |
y = 32.389x – 22.392 |
0.9730 |
|
Hixson–Crowell Model |
y = -0.2542x + 4.9041 |
0.8608 |
|
Korsmeyer–Peppas Model |
y = 0.7332x + 1.1550 |
0.9967 |
Table 5: Drug Release Kinetics Data
In-vitro drug release data of PF6 was analysed in various models. Among these kinetic models, Korsmeyer-Peppas model has highest value of R² i.e. 0.9967, (Table 5) then follow the Zero-order (R² = 0.9939) and Higuchi (R² = 0.9730) models. Hixson-Crowell and First-order models had relatively low R² (R² = 0.8610; R² = 0.7138). Thus, drug release of prepared transdermal patch is mainly governed by Korsmeyer-Peppas kinetic model.
The great correspondence to the Zero order model proves that the developed system was able to provide a practically constant rate of drug release during the period of observation, which is the desired property for sustained transdermal drug delivery systems. Moreover, the perfect correlation to the Higuchi model shows that diffusion is major factors regulating process of drug release from the patch. The low R² value for First order model shows that release is not concentration-dependent.
3.2.13. Stability Studies
Accelerated stability study was performed on PF6. (table 6) Physical attributes of patch and in-vitro release pattern were checked over three months of storage. Results from stability analysis indicated that in the course of storage, physical properties and the release pattern of formulation show no significant change.
|
Parameter |
Initial |
1 Month |
2 Months |
3 Months |
|
Folding Endurance |
236 |
235 |
233 |
232 |
|
Tensile Strength (kg/mm²) |
0.66 |
0.66 |
0.66 |
0.65 |
|
Percentage Elongation (%) |
29.6 |
29.6 |
29.1 |
28.8 |
|
Percentage Drug Release (12h) |
98.6 |
98.5 |
98.1 |
97.9 |
Table 6: Stability Study of Optimized Formulation (F4)
CONCLUSION
Aim of this study was formulation and evaluation of polymeric transdermal patches for sustained release of Metformin Hydrochloride and Repaglinide. Solvent casting method was employed for development of patches. FTIR shows compatibility between drug and excipient. The result shows prepared transdermal patches have acceptable physicochemical properties and in-vitro release studies showed sustained release behaviour of drug. Drug release from patch increases with increase in conc of polymer PVP and ethyl cellulose. This shows that the optimum concentration of polymer HPMC and Ethyle Cellulose or PVP is required for desired drug release. PF6 was chosen as optimized formulation because of its superior mechanical properties, drug content and maximum cumulative drug release of 98.6%. Finding shows that polymeric transdermal patch system was successfully prepared and provided sustained drug release and shows potential of alternative to conventional therapy of diabetes mellitus.
LIST OF ABBREVIATIONS
|
Sr. No. |
Abbreviation |
Full Form |
|
1 |
TDDS |
Transdermal Drug Delivery System |
|
2 |
HPMC |
Hydroxypropyl Methylcellulose |
|
3 |
PVP |
Polyvinyl Pyrrolidone |
|
4 |
PEG |
Polyethylene Glycol |
|
5 |
FTIR |
Fourier Transform Infrared Spectroscopy |
|
6 |
UV |
Ultraviolet |
|
7 |
PF |
Patch Formulation |
|
8 |
HCl |
Hydrochloride |
|
9 |
RPM |
Revolutions Per Minute |
|
10 |
°C |
Degree Celsius |
|
11 |
hr |
Hour |
|
12 |
mg |
Milligram |
|
13 |
ml |
Millilitre |
|
14 |
mm |
Millimetre |
|
15 |
kg/mm² |
Kilogram per Square Millimetre |
|
16 |
SD |
Standard Deviation |
|
17 |
POâ‚„ Buffer |
Phosphate Buffer |
|
18 |
R² |
Regression Coefficient |
|
19 |
EC |
Ethyl Cellulose |
|
20 |
API |
Active Pharmaceutical Ingredient |
|
21 |
QbD |
Quality by Design |
|
22 |
DLS |
Dynamic Light Scattering |
|
23 |
DM |
Diabetes Mellitus |
|
24 |
CDR |
Cumulative Drug Release |
|
25 |
FLT |
Folding Endurance Test |
|
26 |
TFT |
Total Folding Time |
|
27 |
USP |
United States Pharmacopeia |
LIST OF TABLE
|
Sr. No. |
Table No. |
Title |
|
1 |
Table 1 |
Formulation Composition of Metformin Hydrochloride and Repaglinide Transdermal Patches (PF1–PF6) |
|
2 |
Table 2 |
Evaluation of Transdermal Patches: Folding Endurance, Tensile Strength, Percentage Elongation and Thickness |
|
3 |
Table 3 |
Evaluation of Transdermal Patches: Moisture Content, Moisture Uptake and Drug Content |
|
4 |
Table 4 |
In-vitro Drug Release Profile of Transdermal Patches (PF1–PF6) |
|
5 |
Table 5 |
Drug Release Kinetic Model Analysis of Optimized Formulation |
|
6 |
Table 6 |
Stability Study of Optimized Formulation (PF4) |
LIST OF FIGURES
|
Figure No. |
Title |
|
Figure 1 (A) |
FTIR Spectrum of Metformin Hydrochloride |
|
Figure 1 (B) |
FTIR Spectrum of Repaglinide |
|
Figure 1 (C) |
FTIR Spectrum of Drug–Polymer Mixture |
|
Figure 4 |
Comparative In-vitro Drug Release Profile of PF1 and PF2 |
|
Figure 5 |
Comparative In-vitro Drug Release Profile of PF3 and PF4 |
|
Figure 6 |
Comparative In-vitro Drug Release Profile of PF5 and PF6 |
CONFLICT OF INTEREST
The authors declare that there are no conflicts of interest regarding the publication of this manuscript. The authors confirm that this research was conducted in the absence of any commercial or financial relationships that could be construed as a potential conflict of interest.
ACKNOWLEDGEMENT
The authors would like to express their sincere gratitude to J. S. Singh Institute of Pharmacy, Sitapur, Uttar Pradesh, for providing the necessary academic support, infrastructure, and resources to carry out this work.
We also extend our heartfelt thanks to all faculty members and colleagues for their valuable guidance, encouragement, and constructive suggestions during the preparation of this manuscript.
The authors acknowledge the use of institutional facilities and library resources that greatly contributed to the successful completion of this review work.
No specific financial support was received for this study unless otherwise stated.
REFERENCES

Yash Nigam1, Sujeet Kumar Gupta1, Bhumika Yogi1, Nitin Mishra1, Aman Kumar Singh2, Formulation And Evaluation Of Polymeric Transdermal Patches For Sustained Release Of Metformin And Repaglinide, Int. J. Sci. R. Tech., 2026, 3 (7), 130-144. https://doi.org/10.5281/zenodo.21240083
 10.5281/zenodo.21240083