
We use cookies to ensure our website works properly and to personalise your experience. Cookies policy
R.G Sapkal College of Pharmacy, Sapkal Knowledge Hub, Kalyani Hills, Anjaneri, Trimbakeshwar Rd, Nashik, 422213, Maharashtra, India.
Type 2 diabetes mellitus (T2DM) is one of the most rapidly growing metabolic disorders worldwide, demanding effective combination pharmacotherapy for optimal glycaemic control. Metformin, a biguanide class antidiabetic agent, and Empagliflozin, a selective sodium-glucose cotransporter-2 (SGLT2) inhibitor, are increasingly co-prescribed in fixed-dose combination tablet dosage forms owing to their complementary mechanisms of action. The simultaneous estimation of two or more active pharmaceutical ingredients in a single analytical run is a practical necessity in pharmaceutical quality control. Reversed-phase high-performance liquid chromatography (RP-HPLC) has emerged as the technique of choice for such simultaneous estimation owing to its high sensitivity, selectivity, precision, and broad regulatory acceptance. This review paper comprehensively discusses the principles and instrumentation of RP-HPLC, the systematic approach to method development for the simultaneous estimation of Metformin and Empagliflozin, and the validation parameters as prescribed by the International Conference on Harmonisation (ICH) Q2(R2) guidelines. A detailed critical evaluation of previously reported RP-HPLC methods for this drug combination is presented, comparing key chromatographic conditions such as column type, mobile phase composition, detection wavelength, and flow rate. The physicochemical factors governing method development, including the marked polarity disparity between Metformin (Log P ?1.43) and Empagliflozin (Log P 1.7), are discussed in detail. The review concludes with a discussion of current applications and future directions including stability-indicating methods, UHPLC adaptation, and green analytical chemistry approaches.
1.1 Type 2 Diabetes Mellitus: A Global Health Challenge
Type 2 diabetes mellitus (T2DM) is a chronic metabolic disorder characterised by hyperglycaemia resulting from impaired insulin secretion, insulin resistance, or a combination of both. According to the International Diabetes Federation (IDF), the global prevalence of diabetes has risen dramatically over the past two decades and is projected to affect over 640 million individuals by 2030.1 T2DM is associated with a significant burden of macrovascular and microvascular complications including cardiovascular disease, nephropathy, retinopathy, and neuropathy, making it one of the leading causes of morbidity and mortality worldwide. The management of T2DM requires a multifaceted approach encompassing lifestyle modifications and pharmacological interventions. In recent years, combination pharmacotherapy involving drugs with complementary mechanisms of action has emerged as the preferred strategy for achieving optimal glycaemic control while minimising adverse effects associated with higher doses of a single agent.
1.2 Rationale for Combination Therapy: Metformin and Empagliflozin
Metformin, belonging to the biguanide class of antidiabetic agents, has been the first-line pharmacological treatment for T2DM for several decades owing to its established efficacy, favourable safety profile, and low cost.2 It primarily acts by reducing hepatic glucose production through AMP-activated protein kinase (AMPK) activation, improving peripheral insulin sensitivity, and reducing intestinal glucose absorption. Empagliflozin, a selective SGLT2 inhibitor, represents a newer class of antidiabetic agents that exerts its blood glucose-lowering effect through a mechanism entirely independent of insulin. By selectively inhibiting the sodium-glucose cotransporter 2 (SGLT2) in the proximal renal tubule, Empagliflozin promotes urinary glucose excretion, resulting in reduced blood glucose levels, modest weight loss, and blood pressure reduction.3 The complementary mechanisms of these two agents make their fixed-dose combination an attractive and clinically rational therapeutic option for patients with T2DM who require additional glycaemic control beyond what can be achieved with metformin monotherapy.
1.3 Need for Simultaneous Analytical Estimation
The formulation of two or more active pharmaceutical ingredients (APIs) in a single dosage form necessitates the development of reliable analytical methods capable of simultaneously quantifying all components. Simultaneous estimation is essential for ensuring accurate potency determination, detecting potential drug interactions during stability studies, confirming uniformity of content, and maintaining consistent product quality throughout the manufacturing process.4 The analytical challenge is compounded when the two drugs exhibit substantially different physicochemical properties, as is the case with Metformin (highly polar, Log P −1.43) and Empagliflozin (moderately lipophilic, Log P 1.7). Individual estimation methods are not only time-consuming and resource-intensive but may also introduce errors associated with multiple sample preparation steps. A single, validated simultaneous method therefore offers significant practical advantages in terms of efficiency, accuracy, and resource utilisation.
1.4 Role of Validated Analytical Methods in Pharmaceutical Quality Control
Analytical method validation is a fundamental requirement in pharmaceutical development and quality control. Regulatory authorities including the United States Pharmacopoeia (USP), the International Conference on Harmonisation (ICH), the World Health Organization (WHO), and the Food and Drug Administration (FDA) have established rigorous guidelines defining the parameters that must be demonstrated for a method to be considered suitable for its intended purpose.5 Validated analytical methods ensure that the data generated are reliable, reproducible, and defensible in a regulatory context. Parameters such as specificity, linearity, accuracy, precision, detection limit, quantitation limit, solution stability, and robustness collectively define the fitness of an analytical procedure. Failure to validate an analytical method adequately can result in product recalls, regulatory non-compliance, and patient safety risks.
1.5 RP-HPLC as the Technique of Choice
High-performance liquid chromatography (HPLC), and in particular its reversed-phase variant (RP-HPLC), has established itself as the most widely employed chromatographic technique in pharmaceutical analysis. RP-HPLC offers excellent separation efficiency, high sensitivity, quantitative precision, and compatibility with a broad range of pharmaceutical compounds including those that are non-volatile or thermally labile.6 The reversed-phase mode, employing a non-polar C18 stationary phase and a polar aqueous mobile phase, is particularly well-suited for the separation of polar to moderately polar compounds such as Metformin and Empagliflozin. The technique supports gradient and isocratic elution, is amenable to automation, and is compatible with ultraviolet (UV), photodiode array (PDA), fluorescence, and mass spectrometric detection. These attributes, combined with widespread regulatory acceptance, make RP-HPLC the preferred platform for simultaneous drug estimation in pharmaceutical dosage forms.
1.6 Scope and Objectives of the Review
This review aims to provide a comprehensive, critical, and structured overview of the RP-HPLC methodology for the simultaneous estimation of Metformin and Empagliflozin. Specifically, the review: (i) outlines the pharmacological profiles and physicochemical properties of both drugs; (ii) describes the principles and instrumentation of HPLC; (iii) elaborates on the systematic approach to RP-HPLC method development; (iv) defines and discusses each ICH Q2(R2) validation parameter with its acceptance criteria; (v) critically compares previously published analytical methods for this drug combination; (vi) identifies the key physicochemical and chromatographic factors governing method development; and (vii) discusses current applications and future directions in this analytical domain.
2. DRUG PROFILES:
2.1 Metformin
2.1.1 Physicochemical and Chemical Properties
Metformin (IUPAC name: N,N-dimethylimidodicarbonimidic diamide) is a white to off-white crystalline powder with a molecular formula of Câ‚„Hâ‚â‚Nâ‚… and a molecular weight of 129.16 g/mol. It is classified under CAS Registry Number 657-24-9. The drug is freely soluble in water and sparingly soluble in ethanol. Its pKa value of 12.4 indicates that it exists predominantly in its ionised (protonated) form at physiological pH, which directly influences its chromatographic retention behaviour on reversed-phase systems. The Log P value of −1.43 reflects its highly hydrophilic character, a property that necessitates careful optimisation of mobile phase composition in RP-HPLC to achieve adequate retention on non-polar stationary phases. The melting point of Metformin lies in the range of 223–226°C. The plasma elimination half-life is approximately 4–8 hours. Metformin should be stored in a cool, dry place, protected from moisture.7
2.1.2 Mechanism of Action
Metformin exerts its antihyperglycaemic effect primarily through the activation of AMP-activated protein kinase (AMPK) in hepatic tissue. This leads to: (i) suppression of hepatic gluconeogenesis, thereby reducing fasting plasma glucose levels; (ii) enhancement of insulin sensitivity in peripheral tissues including skeletal muscle and adipose tissue, facilitating glucose uptake and utilisation; and (iii) reduction in intestinal glucose absorption.8 Unlike sulfonylureas, Metformin does not stimulate insulin secretion and is therefore not associated with hypoglycaemia when used as monotherapy. Its well-established efficacy, weight-neutral or even weight-reducing profile, and cardiovascular benefits have cemented its role as the cornerstone of T2DM pharmacotherapy globally.
2.1.3 Commercial Formulations
Metformin is available commercially under several brand names including Glycomet, Glucophage, Obimet, and Cetapin, primarily in tablet dosage forms at strengths of 500 mg, 850 mg, and 1000 mg. Fixed-dose combination tablets pairing Metformin with Empagliflozin are commercially available and widely prescribed.
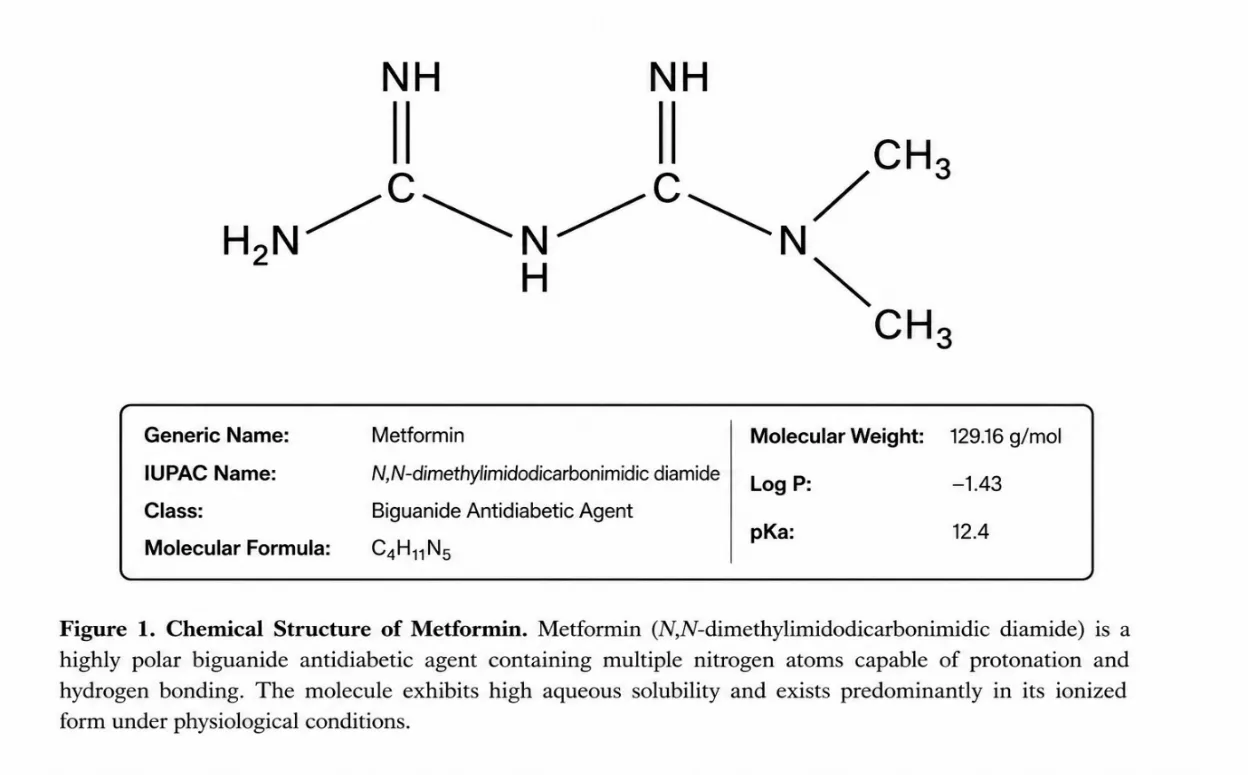
Figure 1: Chemical Structure of Metformin
2.2 Empagliflozin
2.2.1 Physicochemical and Chemical Properties
Empagliflozin (IUPAC name: (2S,3R,4R,5S,6R)-2-[4-chloro-3-{[(4S)-tetrahydrofuran-3-yl]oxy}benzyl]-6-(hydroxymethyl)oxane-3,4,5-triol) is a white to off-white crystalline powder with a molecular formula of C₂₃H₂₇ClO₇ and a molecular weight of 450.91 g/mol (CAS Registry Number: 864070-44-0). The compound is moderately lipophilic, with a Log P value of 1.7 and a pKa of 12.6. Its melting point falls in the range of 136–140°C. The plasma elimination half-life is approximately 12 hours, supporting once-daily dosing. Empagliflozin is soluble in methanol, acetonitrile, and chloroform, but practically insoluble in water, which contrasts sharply with the high aqueous solubility of Metformin and creates the principal analytical challenge when developing a simultaneous RP-HPLC method for this drug combination. Empagliflozin must be stored in a cool, dry place.9
2.2.2 Mechanism of Action
Empagliflozin selectively inhibits the sodium-glucose cotransporter 2 (SGLT2) located in the proximal renal tubule. Under normal physiological conditions, SGLT2 is responsible for the reabsorption of approximately 90% of the glucose filtered at the glomerulus. Selective inhibition of SGLT2 by Empagliflozin therefore results in: (i) markedly reduced reabsorption of filtered glucose in the kidneys; (ii) increased urinary glucose excretion (glucosuria), with a corresponding reduction in blood glucose levels; and (iii) a caloric deficit secondary to glucosuria, contributing to modest weight reduction.10 The mechanism is entirely independent of insulin secretion or action, making Empagliflozin effective even in patients with advanced beta-cell dysfunction. Empagliflozin has additionally demonstrated significant cardiovascular and renal protective benefits in large-scale clinical trials, further broadening its therapeutic utility.
2.2.3 Commercial Formulations
Empagliflozin is marketed under the brand names Jardiance and Glyxambi (in combination with Linagliptin). Fixed-dose combination products containing Metformin and Empagliflozin are commercially available for the management of T2DM and provide the basis for developing simultaneous analytical methods in tablet dosage forms.
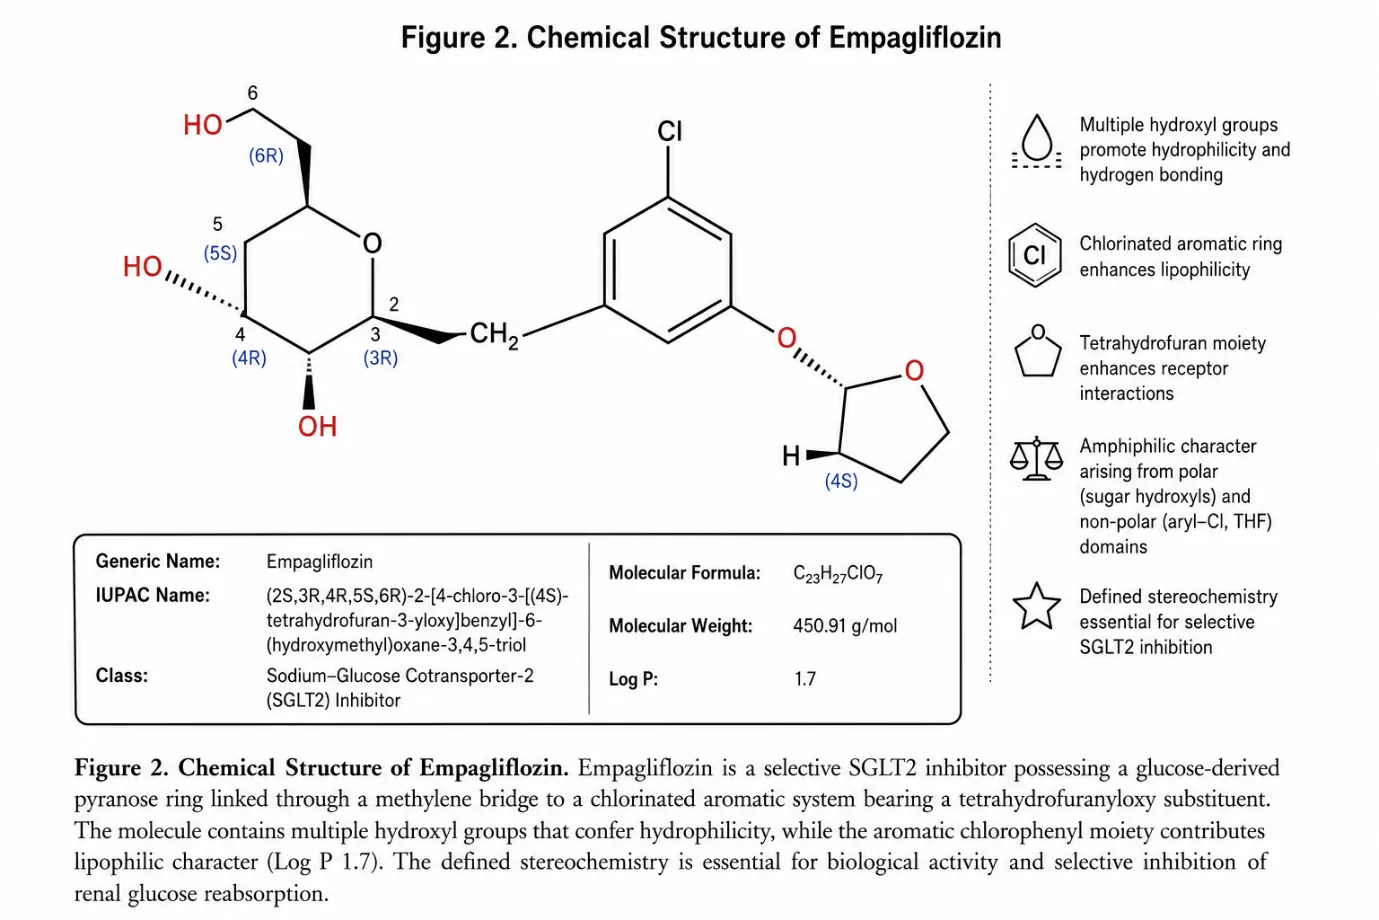
Figure 2: Chemical Structure of Empagliflozin
3. OVERVIEW OF HIGH-PERFORMANCE LIQUID CHROMATOGRAPHY (HPLC):
3.1 Introduction to Chromatography
Chromatography is a powerful and versatile analytical technique used for the separation, identification, and quantification of components present in complex mixtures. The term derives from the Greek words chroma (colour) and graphein (to write), originally coined by the Russian botanist Mikhail Tswett, who used the technique to separate coloured plant pigments in 1903. Over the ensuing century, chromatography has evolved into an indispensable tool applicable to a vast range of colourless compounds across pharmaceutical, clinical, environmental, and food science applications.11 The fundamental principle governing all chromatographic separations is the differential partitioning of analytes between a stationary phase (a solid or immobilised liquid) and a mobile phase (a liquid or gas) that flows over or through the stationary phase. Components that interact more strongly with the stationary phase are retained for longer and elute later, resulting in their spatial and temporal separation from those with greater affinity for the mobile phase.
The major types of chromatography used in pharmaceutical analysis include adsorption chromatography, partition chromatography, ion-exchange chromatography, affinity chromatography, thin-layer chromatography (TLC), gas chromatography (GC), and liquid chromatography (LC).12 Each technique is selected based on the physicochemical properties of the analytes, the complexity of the matrix, and the analytical purpose.
3.2 Evolution from Conventional Liquid Chromatography to HPLC
Conventional column liquid chromatography, widely used in the mid-20th century, suffered from several significant limitations: long analysis times often exceeding several hours, poor chromatographic resolution, limited sensitivity, and poor reproducibility. The major breakthrough that transformed liquid chromatography came in the late 1960s with the development of smaller-diameter stationary phase particles (initially 10 μm, later reduced to 5 μm and below) combined with high-pressure pumping systems capable of delivering mobile phase at consistent flow rates under elevated pressures.13 The resulting technique was initially designated High Pressure Liquid Chromatography, reflecting the mechanical demands of pumping mobile phase through densely packed columns. The name was subsequently changed to High Performance Liquid Chromatography to more accurately reflect the markedly improved analytical performance superior resolution, sensitivity, speed, and reproducibility rather than merely the operational pressure.
3.3 Principle of HPLC
The principle of HPLC rests on the differential distribution of analyte molecules between the stationary and mobile phases as the sample is carried through the column by the flowing mobile phase. The extent to which each analyte is retained by the stationary phase relative to being carried forward by the mobile phase determines its retention time and, consequently, its separation from other components in the mixture.14 Analytes with greater affinity for the non-polar stationary phase (in RP-HPLC) are retained longer and elute later, while those with stronger affinity for the polar mobile phase elute earlier. The efficiency of separation is influenced by multiple factors including particle size of the stationary phase, column dimensions, mobile phase flow rate, mobile phase composition, temperature, and sample preparation. Separated components are detected by a suitable detector as they elute from the column, generating a chromatogram in which each peak corresponds to a specific compound. Quantification is achieved based on peak area or peak height measurements.
3.4 Instrumentation
A modern HPLC system is composed of six fundamental components, each performing a defined and critical function in the overall analytical process.15
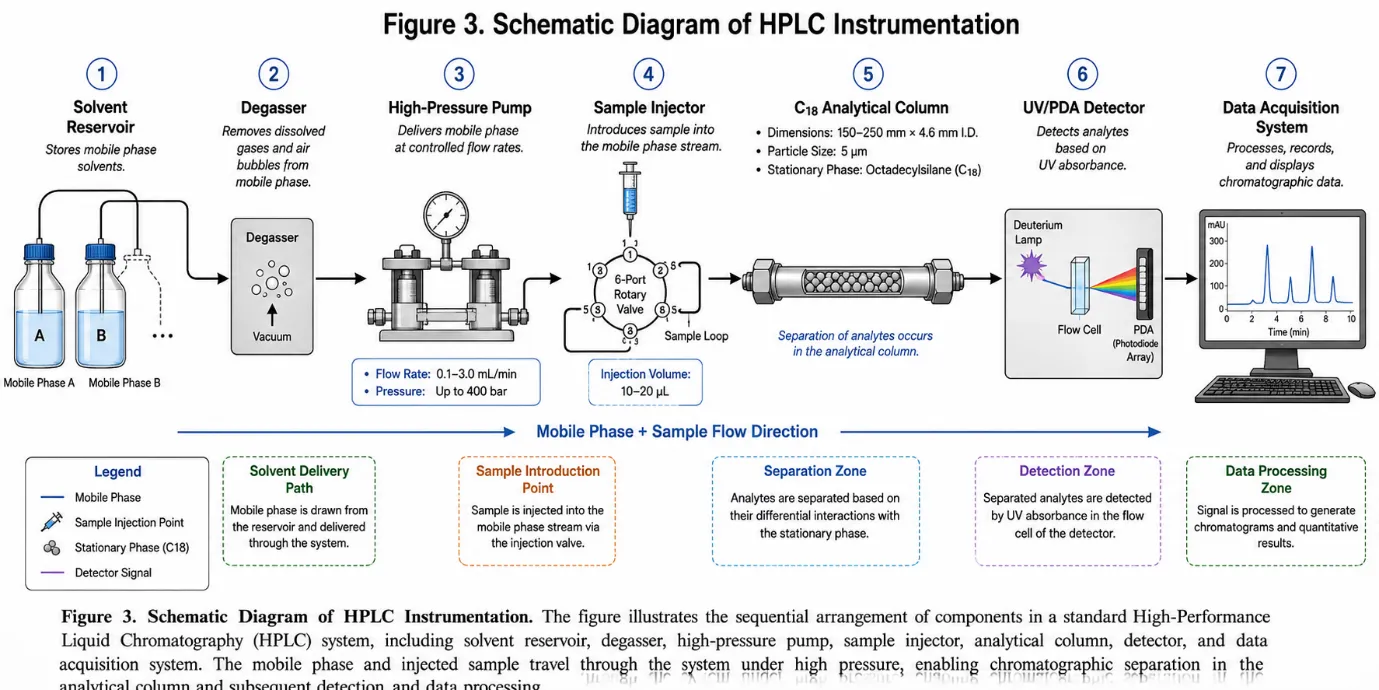
Figure 3: Schematic Diagram of HPLC Instrumentation
The solvent reservoir stores the mobile phase, which must be of HPLC grade purity, and undergoes degassing prior to use. The pump delivers the mobile phase at a precise, constant flow rate under high pressure, achieving flow rate accuracy within ±0.1%.16 The analytical column is typically packed with C18 silica particles offering excellent mechanical stability at high operating pressures.17 The detector converts the concentration of eluting analytes into an electrical signal. UV-Visible detectors are the most widely used due to their simplicity and sensitivity. Photodiode array (PDA) detectors offer the additional advantage of recording the full UV-Vis spectrum of each eluting peak, enabling peak purity assessment.
3.5 Types of HPLC
Four principal modes of HPLC are employed in pharmaceutical analysis:18
Normal Phase HPLC employs a polar stationary phase with a non-polar mobile phase. Less commonly used in pharmaceutical analysis due to limited compatibility with polar drugs and aqueous samples.
Reversed Phase HPLC (RP-HPLC) is the most widely used mode, employing a non-polar stationary phase (e.g., C18 or C8 bonded silica) and a polar mobile phase (e.g., water-acetonitrile or water-methanol mixtures). The aqueous mobile phase compatibility, excellent resolution, and broad applicability make RP-HPLC ideally suited for the simultaneous estimation of Metformin and Empagliflozin.
Ion Exchange HPLC separates ionic compounds based on charge-charge interactions. Particularly useful for the analysis of amino acids, proteins, and inorganic ions.
Size Exclusion HPLC separates molecules based on hydrodynamic size. Primarily used for polymers and biological macromolecules.
3.6 Advantages of HPLC in Pharmaceutical Analysis
HPLC offers numerous advantages: high resolution and sensitivity enabling detection and quantification at microgram and nanogram levels; rapid analysis times; quantitative precision and reproducibility; applicability to a broad range of compounds including non-volatile and thermally labile substances; compatibility with multiple detection modes; capacity for automation; and universal regulatory acceptance.19
4. RP-HPLC METHOD DEVELOPMENT:
4.1 Concept of RP-HPLC
In reversed-phase HPLC, the stationary phase is non-polar (typically a C18 or C8 silica) and the mobile phase is polar, consisting primarily of water or an aqueous buffer mixed with an organic modifier such as acetonitrile or methanol. Analytes are separated based on the balance between their affinity for the non-polar stationary phase and their solubility in the polar mobile phase.20 Compounds with greater hydrophobicity interact more strongly with the stationary phase and are retained for longer periods, while hydrophilic compounds are swept more rapidly through the column. RP-HPLC is particularly well-suited for compounds that span the polarity range, as is the case with the simultaneous estimation of highly polar Metformin and moderately lipophilic Empagliflozin.
4.2 Systematic Approach to Method Development
A systematic and stepwise approach to RP-HPLC method development is essential for achieving reliable, robust, and reproducible chromatographic separation. The key steps involved are as follows:21
The first step involves thorough understanding of the physicochemical properties of the drug molecules. This guides selection of the column, mobile phase components, organic modifier, buffer, and detection wavelength. Systematic optimisation of mobile phase composition follows through trial experiments varying the organic modifier ratio, buffer concentration, and pH, refined iteratively until acceptable chromatographic performance is achieved.
4.3 Key Chromatographic Parameters
Several chromatographic parameters are evaluated during method development and system suitability testing:22 (i) Retention time – used for qualitative identification; (ii) Resolution (Rs) – a resolution of ≥1.5 is generally considered adequate for quantitative purposes; (iii) Tailing factor – values between 0.8 and 2.0 are generally acceptable; (iv) Number of theoretical plates (N) – higher N values indicate sharper, more efficient separation; and (v) Capacity factor (k’) – a measure of the degree to which an analyte is retained by the stationary phase relative to the mobile phase.
4.4 Mobile Phase Selection Considerations
The mobile phase directly governs resolution, retention, peak shape, and sensitivity. Key considerations include: (i) Solubility of analytes – the mobile phase must dissolve both drugs adequately; (ii) Buffer type and pH – buffers such as potassium dihydrogen orthophosphate control ionisation state and maintain consistent retention; (iii) Organic modifier selection – acetonitrile is generally preferred over methanol for lower UV background absorbance, sharper peaks, and lower column back-pressure; (iv) Organic-to-aqueous ratio – systematically varied to achieve appropriate retention times and selectivity for both drugs simultaneously.23
4.5 Detection Wavelength Selection
The selection of an appropriate detection wavelength is critical for simultaneous estimation. Both Metformin and Empagliflozin exhibit ultraviolet absorption, and the wavelength of maximum absorbance for each drug is determined by UV spectroscopic scanning in the range of 200–400 nm. A wavelength of 231 nm has been reported to offer satisfactory sensitivity and selectivity for the simultaneous detection of both drugs, consistent with the absorption characteristics of both molecules in aqueous-organic solvent systems.24
5. METHOD VALIDATION AS PER ICH Q2(R2) GUIDELINES:
5.1 Definition and Importance of Method Validation
Method validation is defined as the process of establishing, by documented experimental evidence, that an analytical procedure is suitable for its intended purpose. In the context of pharmaceutical analysis, this means demonstrating that the method can reliably identify and quantify the target analyte(s) in the presence of other components with the required accuracy, precision, and specificity.25 The ICH Q2(R2) guideline provides the internationally accepted framework for the validation of analytical procedures used in pharmaceutical testing. Regulatory agencies including the US FDA, the European Medicines Agency (EMA), and national drug authorities require validated analytical methods as part of the dossier for new drug applications and variations.
5.2 Validation Parameters
5.2.1 Specificity
Specificity is the ability of an analytical method to assess unequivocally the analyte of interest in the presence of other components that may be expected to be present, such as impurities, degradation products, excipients, or other active pharmaceutical ingredients.26 Specificity is evaluated by analysing blank solutions (mobile phase), standard solutions, and sample solutions chromatographically. The acceptance criterion is that no interference from the blank or other matrix components should be observed at the retention times of either Metformin or Empagliflozin.
5.2.2 Precision
Precision is a measure of the degree of closeness between a series of measurements obtained from repeated sampling of the same homogeneous sample. It is expressed as the %RSD of peak areas or percentage assay values.27 ICH Q2(R2) describes three levels: (i) Repeatability (Intra-day precision) – multiple analyses on the same day; (ii) Intermediate Precision (Inter-day precision) – variation within the same laboratory on different days; and (iii) Reproducibility – precision across different laboratories. An acceptance criterion of %RSD not more than 2.0% is generally applied.
5.2.3 Accuracy
Accuracy is the closeness of agreement between the measured value and the true or accepted reference value, expressed as percentage recovery.28 Accuracy is evaluated at three concentration levels: 80%, 100%, and 120% of the nominal analytical concentration, each analysed in triplicate. The acceptance criterion specifies mean percentage recovery within 98–102% and %RSD not more than 2.0%.
5.2.4 Linearity and Range
Linearity is the ability of an analytical method to produce results directly proportional to the concentration of the analyte over a defined range. It is evaluated at five or more concentration levels spanning 80–120% of the nominal concentration, with peak area plotted against concentration.29 The coefficient of correlation (r²) must be not less than 0.999 (ICH), or ≥0.99 as widely accepted in practice.
5.2.5 Detection Limit (DL) and Quantitation Limit (QL)
The detection limit (DL) is the lowest amount of analyte detectable, defined as the concentration producing a signal-to-noise ratio of 3:1.30 The quantitation limit (QL) is the lowest amount quantitatively determinable with acceptable precision and accuracy, corresponding to a signal-to-noise ratio of approximately 10:1.
5.2.6 Solution Stability
Solution stability studies evaluate whether prepared standard and sample solutions remain stable under routine analytical conditions. Solutions are analysed at defined time intervals (typically initial, 4 hours, and 24 hours) under room temperature.31 The acceptance criterion specifies that the percentage difference at each time interval relative to the initial value should not be more than 2.0%.
5.2.7 Robustness
Robustness measures a method's capacity to remain unaffected by small, deliberate variations in method parameters. Testing involves intentionally varying flow rate (±0.1 mL/min), mobile phase composition (±5%), detection wavelength (±2 nm), and column temperature (±5°C).32 The acceptance criterion requires %RSD of peak areas and %Assay values under varied conditions to be not more than 2.0%.
|
Validation Parameter |
Method of Evaluation |
Acceptance Criterion |
|
Specificity |
Analysis of blank, standard, and sample solutions |
No interference of blank with principal peaks of analytes |
|
Precision (Repeatability) |
Six replicate injections of standard/sample at 100% level on same day |
%RSD ≤ 2.0% |
|
Intermediate Precision |
Replicate analyses on different days / by different analysts |
%RSD ≤ 2.0%; %Assay difference ≤ 2.0% |
|
Accuracy |
Spiked samples at 80%, 100%, 120% of nominal concentration, triplicate at each level |
Mean % Recovery: 98–102%; %RSD ≤ 2.0% |
|
Linearity |
Minimum 5 concentration levels (80–120% range) |
r² ≥ 0.999 (ICH); r² ≥ 0.99 (widely accepted) |
|
Range |
Demonstrated linearity, accuracy, and precision over the stated range |
80–120% of nominal analytical concentration |
|
Detection Limit (DL) |
Signal-to-noise method or standard deviation/slope method |
S/N ≥ 3:1 |
|
Quantitation Limit (QL) |
Signal-to-noise method or standard deviation/slope method |
S/N ≥ 10:1 |
|
Solution Stability |
Analysis of solutions at initial, 4 hr, and 24 hr at room temperature |
% Difference ≤ 2.0% at each interval |
|
Robustness |
Deliberate variation of flow rate, mobile phase composition, wavelength, temperature |
%RSD of peak area and %Assay ≤ 2.0% |
Table 1: Summary of ICH Q2(R2) Validation Parameters and Acceptance Criteria
6. LITERATURE REVIEW: PREVIOUSLY REPORTED RP-HPLC METHODS:
6.1 Overview
The simultaneous estimation of Metformin and Empagliflozin by RP-HPLC has attracted considerable research interest since the widespread adoption of Empagliflozin in combination antidiabetic therapy. A number of research groups have reported validated RP-HPLC methods for this drug pair, employing varied chromatographic conditions including different columns, mobile phase compositions, detection wavelengths, and flow rates.
6.2 Review of Reported Methods
Method 1: Rohini and Ajitha et al. (2022)
Rohini and Ajitha et al.12 reported a stability-indicating RP-HPLC method published in the World Journal of Pharmaceutical Sciences. The method employed a C18 column (150 × 4.6 mm, 5 μm), mobile phase of 0.1% OPA and acetonitrile (60:40 v/v), detection at 230 nm, and a flow rate of 1.0 mL/min. The stability-indicating capability was demonstrated through forced degradation studies under acid, alkali, oxidative, thermal, and photolytic conditions.
Method 2: Bhavana Sruthi and Nanda Kumar et al. (2023)
Bhavana Sruthi and Nanda Kumar et al.13 described a stability-indicating RP-HPLC method in the International Journal of Pharmaceutics and Drug Analysis. A Kromosil C18 column (250 × 4.6 mm, 5 μm) was employed with a buffer-acetonitrile mobile phase (45:55 v/v), detected at 233 nm, and a flow rate of 1.0 mL/min. The higher proportion of acetonitrile (55%) reduced retention times and provided a faster overall run.
Method 3: Pathan and Kshirsagar et al. (2022)
Pathan and Kshirsagar et al.14 developed and validated a method in the Research Journal of Pharmacy and Technology. The method used an Ascentis C18 column (150 × 4.6 mm, 5 μm) with 0.1% OPA and acetonitrile (60:40), a flow rate of 1.0 mL/min, and detection at 260 nm. The selection of 260 nm minimised background absorption from excipients.
Method 4: Gangurde, Borse, and Yelmame et al. (2024)
Gangurde, Borse, and Yelmame et al.15 published a validated method in the Journal of Chemical Health Risks (2024). A Cosmosil C18 column (250 × 4.6 mm, 5 μm) with methanol and KHâ‚‚POâ‚„ (60:40), detection at 227 nm, and 1.0 mL/min flow rate was used. The use of methanol rather than acetonitrile is a distinguishing feature, providing cost and toxicity advantages.
Method 5: Patil, Amurutkar, and Upasani et al. (2017)
Patil, Amurutkar, and Upasani et al.16 reported one of the earlier RP-HPLC methods in ISRN Chromatography (2017). A Grace C18 column (250 × 4.6 mm, 5 μm) with methanol and water (80:20), detected at 227 nm, and a flow rate of 0.8 mL/min was used. The absence of a buffer may limit robustness for Metformin analysis, as this highly ionisable compound is sensitive to mobile phase pH.
Method 6: Gollu and Gummadi et al. (2022)
Gollu and Gummadi et al.17 published a rapid LC-PDA method for simultaneous quantification of Metformin, Empagliflozin, and Linagliptin in the Annales Pharmaceutiques Françaises (2022). A C18 column (250 × 4.6 mm, 5 μm) with acetonitrile and triethylamine (70:30), detection at 240 nm, and a flow rate of less than 6 mL/min was used. The PDA detector enabled simultaneous monitoring at each drug's optimal wavelength and peak purity assessment.
6.3 Comparative Summary Table
|
Ref. |
Authors (Year) |
Column |
Mobile Phase |
λ (nm) |
Flow (mL/min) |
Key Feature |
|
12 |
Rohini & Ajitha (2022) |
C18 150×4.6mm, 5μm |
0.1% OPA:ACN (60:40) |
230 |
1.0 |
Stability-indicating |
|
13 |
Sruthi & Kumar (2023) |
Kromosil C18 250×4.6mm, 5μm |
Buffer:ACN (45:55) |
233 |
1.0 |
Stability-indicating |
|
14 |
Pathan & Kshirsagar (2022) |
Ascentis C18 150×4.6mm, 5μm |
0.1% OPA:ACN (60:40) |
260 |
1.0 |
Short column, faster run |
|
15 |
Gangurde et al. (2024) |
Cosmosil C18 250×4.6mm, 5μm |
MeOH:KHâ‚‚POâ‚„ (60:40) |
227 |
1.0 |
Methanol-based method |
|
16 |
Patil et al. (2017) |
Grace C18 250×4.6mm, 5μm |
MeOH:Water (80:20) |
227 |
0.8 |
No buffer; earlier method |
|
17 |
Gollu & Gummadi (2022) |
C18 250×4.6mm, 5μm |
ACN:TEA (70:30) |
240 |
<6.0 |
Three-drug method, LC-PDA |
Table 2: Comparative Summary of Reported RP-HPLC Methods for Simultaneous Estimation of Metformin and Empagliflozin
6.4 Critical Observations from the Literature
A comparative analysis reveals several important observations. First, the C18 column is the universal stationary phase of choice across all reported methods. Column dimensions vary between 150 mm and 250 mm length. Second, detection wavelengths span 227–260 nm; a wavelength near 230–231 nm offers a good compromise for simultaneous detection of both drugs. Third, the majority of methods use acetonitrile as the organic modifier. Fourth, mobile phase pH control through acidic buffers (OPA or KHâ‚‚POâ‚„) is employed in most methods to improve Metformin peak shape. Fifth, there is a clear need for methods that balance analytical performance with practical considerations such as solvent consumption, analysis time, and simplicity of mobile phase preparation.
7. Factors Affecting Rp-Hplc Method Development For This Drug Combination:
7.1 Physicochemical Differences Between the Two Drugs
The most fundamental challenge in developing a simultaneous RP-HPLC method for Metformin and Empagliflozin is the marked disparity in their physicochemical properties. Metformin is a highly polar, hydrophilic compound (Log P −1.43) that exists predominantly in its ionised form at most practical mobile phase pH values due to its high pKa of 12.4. This makes it inherently difficult to retain on a non-polar C18 stationary phase. Empagliflozin, in contrast, is a moderately lipophilic molecule (Log P 1.7) that interacts more strongly with the hydrophobic stationary phase and elutes later.33 This polarity contrast requires mobile phase conditions that provide adequate retention and resolution for both drugs in a single isocratic run.
7.2 Role of Buffer in Mobile Phase
The inclusion of an appropriate buffer is essential for the RP-HPLC analysis of Metformin. As an ionisable compound with a high pKa, Metformin is highly sensitive to mobile phase pH changes. Without pH control, Metformin peaks tend to be broad, asymmetric, or poorly retained.34 Potassium dihydrogen orthophosphate (KHâ‚‚POâ‚„) and ortho-phosphoric acid (OPA) are the most widely used buffer systems. These buffers maintain the mobile phase at acidic pH (typically pH 3.0–4.5), partially suppressing Metformin ionisation and improving its interaction with the C18 stationary phase.
7.3 Choice of Organic Modifier
Acetonitrile is generally preferred for the simultaneous estimation of Metformin and Empagliflozin for several reasons: it produces lower UV background absorbance in the wavelength range used (230–240 nm), generates lower mobile phase viscosity resulting in lower column back-pressure, and tends to produce sharper, more symmetrical peaks.35 The ratio of acetonitrile to aqueous buffer must be carefully optimised too high a proportion leads to insufficient retention of Metformin, while too low a proportion results in excessively long retention times for Empagliflozin.
7.4 pH of the Mobile Phase
Mobile phase pH exerts a significant influence on the retention, peak shape, and selectivity of ionisable analytes. For Metformin, a mobile phase pH in the range of 3.0–4.5 provides the best balance between adequate retention and acceptable peak shape.36 Empagliflozin, being non-ionisable under normal chromatographic conditions due to its high pKa of 12.6, is largely unaffected by mobile phase pH changes. Therefore, pH optimisation primarily addresses the behaviour of Metformin.
7.5 Detection Wavelength Optimisation
Ultraviolet scanning of both drugs in the relevant solvent system across 200–400 nm reveals the wavelengths of maximum absorption. Metformin exhibits strong UV absorption in the range of 230–234 nm, while Empagliflozin, owing to its chlorinated aromatic ring system, also absorbs in this wavelength range.37 A detection wavelength of approximately 231 nm represents a compromise: providing sufficient sensitivity for both drugs while minimising potential interference from mobile phase components or excipients.
8. Applications of Validated RP-HPLC Methods
Validated RP-HPLC methods for the simultaneous estimation of Metformin and Empagliflozin have broad practical applicability across pharmaceutical research, development, and manufacturing.
Routine Quality Control: The primary application is in the routine quality control of both bulk drug substances (APIs) and finished pharmaceutical tablet dosage forms, ensuring that each tablet meets the specified label claim within pharmacopoeial limits of 90–110%.38
Tablet Dosage Form Analysis: Validated RP-HPLC methods are directly applied to the quantitative analysis of commercially available and investigational fixed-dose combination tablets, including determination of uniformity of content across tablet batches.
Stability Testing: With appropriate extension to stability-indicating capability through forced degradation studies, validated RP-HPLC methods can be applied to short-term and long-term stability testing under ICH prescribed storage conditions (25°C/60% RH, 40°C/75% RH).
Dissolution Studies: The validated RP-HPLC method can be applied to monitor the in vitro dissolution profiles of Metformin and Empagliflozin from fixed-dose combination tablets.39
Regulatory Submissions: A fully validated RP-HPLC method constitutes a mandatory component of pharmaceutical product regulatory dossiers submitted to national and international regulatory authorities.
9. FUTURE SCOPE:
The field of analytical method development for Metformin and Empagliflozin offers several avenues for future research and methodological advancement.
The developed RP-HPLC method can be extended to stability-indicating applications through systematic forced degradation studies under acidic, alkaline, oxidative, thermal, and photolytic stress conditions. Such stability-indicating capability is increasingly demanded by global regulatory authorities.40
Adaptation of the method for use with biological matrices such as human plasma, urine, or tissue would expand its applicability to pharmacokinetic and bioavailability studies. This would require additional sample preparation steps such as protein precipitation, liquid-liquid extraction, or solid-phase extraction.
The transition from conventional HPLC to Ultra-High-Performance Liquid Chromatography (UHPLC or UPLC), employing sub-2 μm particle stationary phases, offers significantly reduced analysis times (often 5–10 fold), lower solvent consumption, and enhanced sensitivity and resolution.41
The development of eco-friendly or “green” analytical methods that minimise the use of hazardous organic solvents is an emerging priority. Techniques such as micellar liquid chromatography, hydrophilic interaction liquid chromatography (HILIC), and the use of less toxic organic modifiers (e.g., ethanol) offer potential pathways toward greener simultaneous estimation of Metformin and Empagliflozin.
Further validation according to multiple global regulatory frameworks including the USP, European Pharmacopoeia (EP), and FDA guidelines would broaden the regulatory acceptance and international applicability of reported methods.42
CONCLUSION
This review has comprehensively examined the development and validation of RP-HPLC methods for the simultaneous estimation of Metformin and Empagliflozin in bulk and pharmaceutical tablet dosage forms. The complementary pharmacological mechanisms of these two antidiabetic agents and their widespread use in fixed-dose combination therapy create a clear and pressing need for reliable, validated simultaneous analytical methods.
The review of the existing literature confirms that RP-HPLC, employing a C18 stationary phase with a buffer-acetonitrile mobile phase system and UV detection in the wavelength range of 227–240 nm, is the most widely adopted and technically sound approach. The physicochemical contrast between the two drugs particularly the marked difference in polarity (Log P −1.43 for Metformin vs. 1.7 for Empagliflozin) demands careful optimisation of mobile phase composition, buffer type, pH, and organic modifier selection.
Method validation as per ICH Q2(R2) guidelines, encompassing specificity, precision, accuracy, linearity, range, detection limit, quantitation limit, solution stability, and robustness, is an essential and non-negotiable step in establishing the fitness of any RP-HPLC method for pharmaceutical quality control use.
Future work in this domain should focus on extending validated methods to stability-indicating applications, biological matrix analysis, UHPLC-based approaches, and the development of greener analytical methods. With the continued growth of fixed-dose combination antidiabetic therapy, robust and validated simultaneous analytical methods for Metformin and Empagliflozin will remain an important priority for pharmaceutical scientists and quality assurance professionals worldwide.
REFERENCES

Nikhil A. Bawane*, Sachin S. Shinde, Vanita S. Sawant, Nidhi U. Kamlakar, Pallavi D. Borse, Jotshna R. Adhagale, Mamata D. Wadkar, Pratiksha D. Wagh, A Review On RP-HPLC Method Development And Validation For Simultaneous Estimation Of Metformin And Empagliflozin In Bulk And Pharmaceutical Dosage Forms, Int. J. Sci. R. Tech., 2026, 3 (6), 1729-1742. https://doi.org/10.5281/zenodo.21060199
 10.5281/zenodo.21060199