

We use cookies to ensure our website works properly and to personalise your experience. Cookies policy
Dept. of Studies in Food science and Nutrition, University of Mysore, Mysuru
Sesbania grandiflora (L.) Pers. is a multipurpose edible medicinal plant widely consumed in South and Southeast Asia, yet the influence of post-harvest processing conditions on its phytochemical quality remains incompletely characterised. This study evaluated the effects of plant part (leaves and flowers), drying method (oven drying and freeze drying) and extraction solvent (absolute ethanol, 80% methanol and water) on the total phenolic content (TPC), total flavonoid content (TFC), total alkaloid content (TAC), total tannin content (TTC) and antioxidant activity (DPPH radical scavenging and FRAP) of S. grandiflora extracts. Ultrasound-assisted extraction was employed and phytochemical quantification was performed using validated spectrophotometric methods. Three-way analysis of variance revealed significant effects of plant part, solvent type and drying method on all phytochemical parameters (p < 0.05), with the exception of plant part, which did not significantly influence FRAP values (p = 0.196). Aqueous extracts consistently yielded the highest TPC, TFC, TAC, TTC and FRAP values, while ethanol extracts were generally inferior. Oven-dried leaf methanol extracts yielded the highest TPC (848.40 ± 5.09 µg GAE/mg), and freeze-dried flower methanol extracts yielded the highest TFC (429.70 ± 5.46 µg CE/mg). Alkaloids were not detected at the tested concentrations in oven-dried flower ethanol and methanol extracts. DPPH IC50 values are reported descriptively as a single value per extract. Spearman rank correlation analysis revealed a significant negative correlation between FRAP and DPPH IC50 (? = -0.609, p = 0.047), with a near-significant positive trend observed between TFC and FRAP (? = 0.600, p = 0.051). These findings demonstrate that aqueous extraction and appropriate drying method selection are critical determinants of phytochemical recovery from S. grandiflora, with implications for its optimisation as a functional food ingredient.
The global interest in plant-derived bioactive compounds has grown substantially in recent decades, driven by increasing consumer preference for natural health-promoting products and a growing body of evidence linking dietary phytochemicals to the prevention of chronic non-communicable diseases.1 Among the most extensively studied classes of plant secondary metabolites are phenolics, flavonoids, alkaloids and tannins, which collectively contribute to the antioxidant, anti-inflammatory, antimicrobial and anticancer properties of medicinal plants.2
Sesbania grandiflora (L.) Pers. (family: Fabaceae), commonly known as agati or vegetable hummingbird, is a fast-growing perennial tree distributed widely across tropical and subtropical regions of South and Southeast Asia, including India, Indonesia, the Philippines and Malaysia.3 The plant holds considerable significance as both a food crop and a traditional medicinal resource. Its leaves and flowers are consumed as vegetables in daily diets across several South Asian communities, including in Karnataka, India, where the plant material for the present study was sourced.4 In traditional Ayurvedic medicine, S. grandiflora has been employed as an aperient, diuretic, febrifuge and tonic, and has been used to manage conditions including fever, malaria, gastric disorders and skin ailments.5
Phytochemical investigations of S. grandiflora have documented the presence of flavonoids including kaempferol and quercetin, isoflavonoids such as isovestitol and medicarpin, alkaloids, tannins, triterpenoids including betulinic acid, and sterols, which collectively underpin its diverse pharmacological activities.3,5 Studies have reported potent antioxidant, antimicrobial, anti-inflammatory, hepatoprotective and anticancer activities in extracts of S. grandiflora leaves and flowers.6 Despite this pharmacological relevance, the phytochemical literature on S. grandiflora has predominantly focused on single plant parts, specific solvents or individual bioactivities, with limited systematic comparison of the combined effects of plant part, extraction solvent and post-harvest processing conditions on phytochemical yield and antioxidant activity.
Post-harvest drying is a critical processing step that profoundly influences the retention of heat-sensitive bioactive compounds in plant materials. Oven drying, while cost-effective and widely used, exposes plant material to elevated temperatures that may degrade thermolabile phytochemicals such as flavonoids and phenolic acids.7 Freeze drying, by contrast, removes moisture through sublimation at low temperatures and reduced pressure, and has been reported to better preserve phytochemical integrity and antioxidant capacity in a range of plant species.8 However, the comparative effects of these drying methods on the phytochemical composition and antioxidant activity of S. grandiflora remain insufficiently characterised in the published literature.
Extraction solvent polarity is equally critical in determining the profile and quantity of bioactive compounds recovered from plant matrices. Polar solvents such as water and aqueous methanol favour the extraction of polar phenolics, flavonoid glycosides and tannins, while less polar solvents such as ethanol may preferentially extract lipophilic compounds.9 Ultrasound-assisted extraction (UAE) has emerged as an efficient, environmentally friendly technique that enhances phytochemical recovery through acoustic cavitation, which disrupts plant cell walls and promotes mass transfer, thereby reducing extraction time and solvent consumption compared to conventional methods.10,11
In light of the above, the present study aimed to systematically evaluate the individual and combined effects of plant part (leaves and flowers), drying method (oven drying and freeze drying) and extraction solvent (absolute ethanol, 80% methanol and water) on the TPC, TFC, TAC, TTC, DPPH radical scavenging activity and FRAP of S. grandiflora extracts prepared by UAE. The findings are intended to provide a systematic, evidence-based foundation for the optimisation of extraction conditions for bioactive compounds from S. grandiflora, with relevance to its application in food, nutraceutical and pharmaceutical contexts.
2. MATERIALS AND METHODS
2.1 Chemicals and Reagents
All chemicals and reagents used in the present study were of analytical grade and procured from reputed commercial suppliers. Ethanol, methanol, Folin-Ciocalteu reagent, bromocresol green, 2,2-diphenyl-1-picrylhydrazyl (DPPH), 2,4,6-tripyridyl-s-triazine (TPTZ), ferric chloride, ferrous sulphate, gallic acid, catechin, atropine, tannic acid, ascorbic acid and other analytical reagents were used without further purification. Doubly distilled water was used throughout the study unless otherwise specified.
2.2 Plant Material Collection and Preparation
Fresh leaves and flowers of Sesbania grandiflora (L.) Pers. were purchased from a local market in Mysuru, Karnataka, India, where the plant is commonly consumed as a green leafy vegetable. The plant material was authenticated by the Department of Studies in Botany, University of Mysore, Mysuru, India, and a voucher specimen was deposited under accession number UOMBOT25SG001.
The collected plant material was thoroughly washed under running tap water to remove surface contaminants and allowed to drain. The cleaned samples were divided into two batches for drying. One batch was dried in a hot air oven (Equitron Ecogain Series) at temperatures not exceeding 55 ℃ for 16-18 hours until completely dry. The second batch was frozen at -40 to -50 ℃ and subsequently freeze-dried using a ModulyoD freeze dryer (Thermo Electron Corporation) under vacuum (≤1 mbar) for approximately 18 hours with intermittent pauses between drying cycles. The dried samples were ground into a fine powder using a laboratory grinder (MRDFT-100), passed through a 60-mesh sieve to obtain a uniform particle size, and stored in airtight containers at 4 ℃ until further analysis.
2.3 Preparation of Extracts
Ultrasound-assisted extraction was employed for the recovery of phytochemicals from the dried leaf and flower powders, given its well-documented efficiency in enhancing the recovery of bioactive compounds. Each sample was extracted separately using absolute ethanol, 80% (v/v) aqueous methanol and doubly distilled water at a sample-to-solvent ratio of 1:10 (w/v). Extraction was carried out in a bath sonicator operating at 20 kHz and maintained at 50 ℃ for 30 min. The extracts were subsequently centrifuged at 3000 rpm for 10 min using a Remi R-8C laboratory centrifuge. The resulting supernatants were filtered through Whatman No. 1 filter paper and concentrated under reduced pressure using a Superfit rotary evaporator with the water bath maintained at 50 ℃. The concentrated extracts were stored at 4 ℃ in airtight containers until further analysis. Fresh calibration curves were prepared for each analytical batch using the respective reference standards. Unless otherwise specified, all analytical determinations were performed in triplicate and results were expressed as mean ± standard deviation (SD).
2.4 Phytochemical Analysis
2.4.1 Total Phenolic Content
The total phenolic content (TPC) of the extracts was determined using the Folin-Ciocalteu method described by Singleton et al.12 using gallic acid as the reference standard. Briefly, 200 µg of appropriately diluted extract was mixed with 0.5 mL of Folin-Ciocalteu reagent and allowed to stand at room temperature for 10 min. Subsequently, 2 mL of 7% sodium carbonate solution was added and the reaction mixture was heated in a boiling water bath for 1 min. After cooling to room temperature, the absorbance was measured at 750 nm using a UV-Visible spectrophotometer (Esico International). Results were expressed as micrograms of gallic acid equivalents per milligram of extract (µg GAE/mg extract).
2.4.2 Total Flavonoid Content
The total flavonoid content (TFC) was determined according to the method described by Delcour and Varebeke,13 using catechin as the reference standard. Briefly, 200 µg of the extract was mixed with 5 mL of freshly prepared cinnamaldehyde chromogen reagent and incubated at room temperature for 10 min. The absorbance was measured at 640 nm using a UV-Visible spectrophotometer (Esico International). Results were expressed as micrograms of catechin equivalents per milligram of extract (µg CE/mg extract).
2.4.3 Total Alkaloid Content
The total alkaloid content (TAC) was determined using the bromocresol green (BCG) colorimetric method described by Shamsa et al.,14 using atropine as the reference standard. Briefly, 300 µg of the extract was dissolved in 1 mL of 2 N hydrochloric acid, filtered and washed with 10 mL of chloroform. Bromocresol green reagent was prepared by dissolving 69.8 mg of bromocresol green in 3 mL of 2 N sodium hydroxide, followed by the addition of phosphate buffer (pH 4.7). The extract was reacted with 5 mL of the bromocresol green reagent and the absorbance measured at 470 nm against a reagent blank. Results were expressed as micrograms of atropine equivalents per milligram of extract (µg AE/mg extract).
2.4.4 Total Tannin Content
The total tannin content (TTC) was determined according to the method described by Makkar et al.,15 using tannic acid as the reference standard. Briefly, 0.05 mL of the extract was transferred to a test tube and the volume adjusted to 0.5 mL with distilled water. Subsequently, 0.25 mL of 1 N Folin-Ciocalteu reagent and 1.25 mL of 20% sodium carbonate solution were added. The reaction mixture was incubated at room temperature for 40 min, vortexed and the absorbance was measured at 725 nm using a UV-Visible spectrophotometer (Esico International). Results were expressed as micrograms of tannic acid equivalents per milligram of extract (µg TAE/mg extract).
2.5 Antioxidant Activity
2.5.1 Ferric Reducing Antioxidant Power (FRAP) Assay
The ferric reducing antioxidant power (FRAP) was determined according to the method of Benzie and Strain.16 The FRAP reagent was freshly prepared by mixing 2.5 mL of 10 mM TPTZ solution in 40 mM hydrochloric acid, 2.5 mL of 20 mM ferric chloride hexahydrate, and 25 mL of 0.3 M acetate buffer (pH 3.6), and incubated at 37 ℃ prior to use. Briefly, 900 µL of the FRAP reagent was mixed with 10 µL of the extract and the volume adjusted to 1 mL with acetate buffer. The mixture was incubated at 37 ℃ for 30 min and the absorbance was measured at 593 nm, with absorbance values corrected against the reagent blank. Ferrous sulphate (FeSO4.7H2O; 0-100 µM) was used as the standard. Results were expressed as micromoles of Fe(II) equivalents per 200 µg of extract (µmol Fe(II)/ 200 µg extract).
2.5.2 DPPH Radical Scavenging Assay
The DPPH radical scavenging activity was determined using the method of Blois.17 Concentrations ranging from 20 to 125 µg/mL were prepared for each extract, with the concentration range adjusted where required to capture the full dose-response relationship. Each concentration was mixed with 2 mL of 100 µM DPPH solution and the final volume adjusted to 3 mL with methanol. Reaction mixtures were incubated in the dark at room temperature for 45 min, after which the absorbance was measured at 517 nm against a reagent blank. Ascorbic acid was used as the reference antioxidant. The percentage inhibition of DPPH radicals was calculated and results expressed as the half-maximal inhibitory concentration (IC50, µg/mL), representing the concentration required to scavenge 50% of DPPH radicals. Lower IC50 values indicate stronger antioxidant activity.
2.6 Statistical Analysis
Statistical analyses were carried out using IBM SPSS Statistics version 20.0 (IBM Corp., Armonk, NY, USA). The effects of plant part (leaves and flowers), drying method (oven drying and freeze drying) and extraction solvent (ethanol, methanol and water), and their interactions on phytochemical composition and FRAP were evaluated using three-way analysis of variance (ANOVA) with all factors treated as fixed. When significant differences were observed, mean comparisons were performed using Tukey's honestly significant difference (HSD) post hoc test. Prior to ANOVA, homogeneity of variances was assessed using Levene's test. Where the concentration of a phytochemical was below the detection limit of the assay, the value was recorded as not detected at the tested concentrations (ND) and treated as system missing in all statistical analyses. Due to ND values in specific treatment combinations, unequal group sizes were encountered in the alkaloid, tannin and FRAP datasets; harmonic mean sample sizes were used for Tukey's HSD comparisons under these conditions. The three-way interaction term for alkaloid content could not be estimated due to non-detectable values in two treatment combinations (ODF EtOH and ODF MeOH). The DPPH IC50 was determined as a single value per extract from dose-response curves and is presented descriptively.
Relationships among phytochemical constituents and antioxidant activities were evaluated using Spearman's rank correlation coefficient. Prior to correlation analysis, normality was assessed using the Shapiro-Wilk test. Since alkaloid content significantly deviated from normality (Shapiro-Wilk W = 0.687, p = 0.002), Spearman's correlation was selected as a robust non-parametric measure of monotonic association. Correlation analysis was performed using mean values across all 12 treatment combinations (n = 12) with pairwise exclusion of missing values. Statistical significance was considered at p < 0.05 for all analyses.
3. RESULTS AND DISCUSSION
3.1 Total Phenolic Content
The TPC of S. grandiflora leaf and flower extracts across all drying methods and solvents ranged from 447.76 ± 13.87 to 848.40 ± 5.09 µg GAE/mg extract (Table 1 and Figure 1A). Three-way ANOVA resulted in significant effects of plant part (F = 223.91, p < 0.001, partial η2 = 0.903), solvent (F = 19.59, p < 0.001, partial η2 = 0.620) and drying method (F = 40.65, p < 0.001, partial η2 = 0.629) were observed (Table 2). Significant two-way interactions were noted for plant x solvent (p < 0.001) and plant x drying (p < 0.001), as well as the three-way interaction (p < 0.001). The solvent x drying interaction was not significant (p = 0.114). The overall model accounted for 97.2% of the variance in TPC (R2 = 0.972).
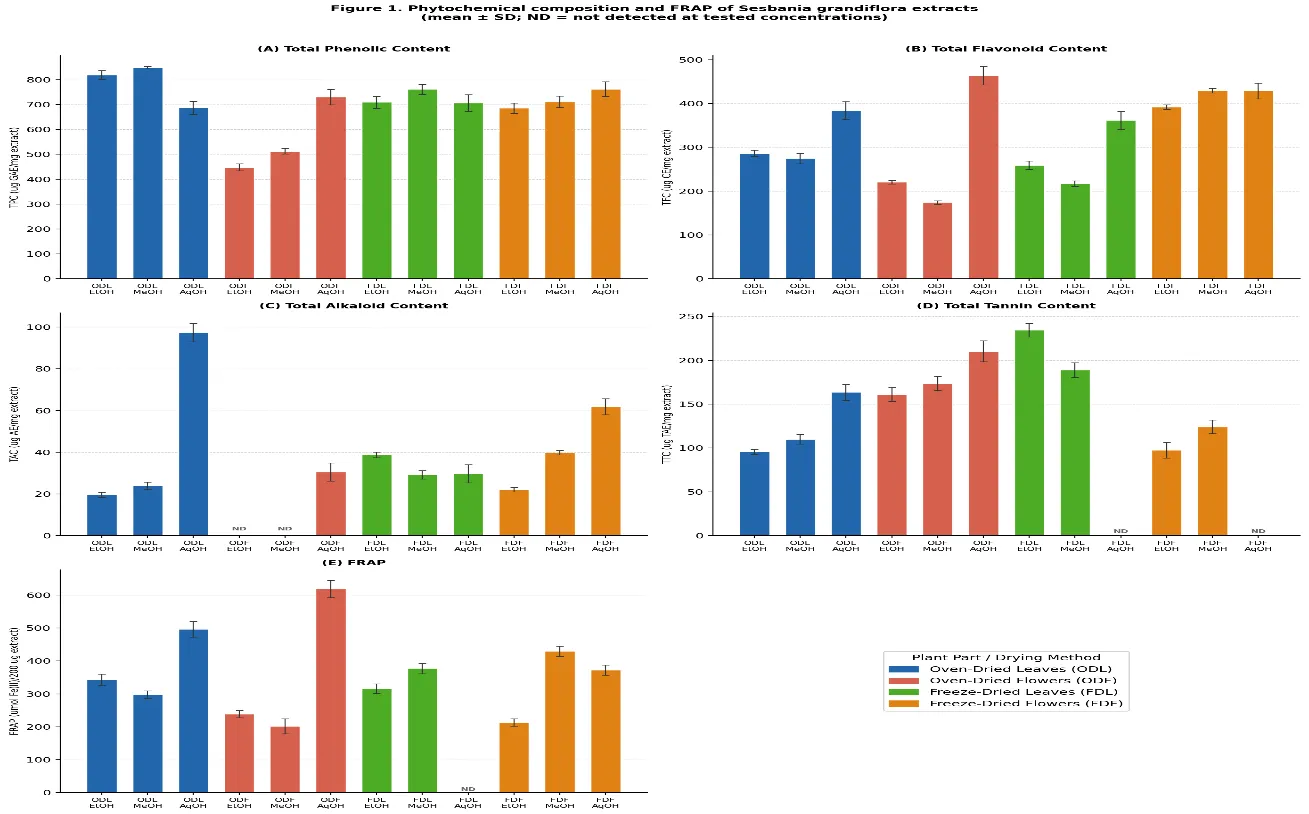
Figure 1. Phytochemical composition and ferric reducing antioxidant power (FRAP) of Sesbania grandiflora leaf and flower extracts prepared by ultrasound-assisted extraction using different solvents and drying methods: (A) Total Phenolic Content; (B) Total Flavonoid Content; (C) Total Alkaloid Content; (D) Total Tannin Content; (E) FRAP. Values represent mean ± SD (n = 3). ND: Not Detected at the Tested Concentrations. ODL: Oven-Dried Leaves; ODF: Oven-Dried Flowers; FDL: Freeze-Dried Leaves; FDF: Freeze-Dried Flowers; EtOH: Ethanol; MeOH: 80% Methanol; AqOH: Aqueous (Water).
|
Sample |
TPC |
TFC |
TAC |
TTC |
FRAP |
DPPH IC50 |
|
ODL EtOH |
819.12 ± 17.41 |
286.26 ± 7.16 |
19.60 ± 1.31 |
95.60 ± 3.15 |
343.17 ± 16.91 |
71.99 |
|
ODL MeOH |
848.40 ± 5.09 |
274.65 ± 12.15 |
23.94 ± 1.83 |
109.88 ± 5.46 |
297.06 ± 11.82 |
88.73 |
|
ODL AqOH |
686.67 ± 26.08 |
384.01 ± 20.39 |
97.37 ± 4.42 |
163.45 ± 8.99 |
496.11 ± 23.41 |
89.13 |
|
ODF EtOH |
447.76 ± 13.87 |
220.61 ± 4.01 |
ND |
161.07 ± 7.81 |
238.17 ± 10.93 |
116.58 |
|
ODF MeOH |
512.29 ± 10.68 |
174.14 ± 3.81 |
ND |
173.77 ± 7.93 |
201.50 ± 22.91 |
132.58 |
|
ODF AqOH |
730.13 ± 31.34 |
463.70 ± 21.10 |
30.53 ± 4.36 |
210.28 ± 11.92 |
618.33 ± 26.46 |
59.71 |
|
FDL EtOH |
709.51 ± 24.07 |
258.99 ± 9.86 |
38.70 ± 1.38 |
234.48 ± 7.75 |
315.94 ± 14.17 |
79.31 |
|
FDL MeOH |
761.22 ± 19.56 |
217.07 ± 6.12 |
29.15 ± 1.97 |
188.85 ± 8.45 |
377.06 ± 15.84 |
101.50 |
|
FDL AqOH |
706.08 ± 33.56 |
361.61 ± 20.09 |
29.68 ± 4.36 |
ND |
ND |
187.39 |
|
FDF EtOH |
685.58 ± 20.54 |
391.82 ± 5.46 |
22.03 ± 1.04 |
97.58 ± 8.94 |
213.17 ± 10.93 |
114.68 |
|
FDF MeOH |
711.00 ± 23.17 |
429.70 ± 5.46 |
39.74 ± 1.04 |
124.17 ± 7.81 |
429.28 ± 16.02 |
55.84 |
|
FDF AqOH |
761.77 ± 29.93 |
428.80 ± 17.97 |
61.81 ± 3.85 |
ND |
372.22 ± 15.49 |
122.65 |
|
Ascorbic acid |
- |
- |
- |
- |
703.17 ± 18.56 |
21.48 |
ODL: Oven-Dried Leaves; ODF: Oven-Dried Flowers; FDL: Freeze-Dried Leaves; FDF: Freeze-Dried Flowers; EtOH: Ethanol; MeOH: 80% Methanol; AqOH: Aqueous (Water); ND: Not Detected at the Tested Concentrations; TPC: Total Phenolic Content; TFC: Total Flavonoid Content; TAC: Total Alkaloid Content; TTC: Total Tannin Content; FRAP: Ferric Reducing Antioxidant Power; GAE: Gallic Acid Equivalents; CE: Catechin Equivalents; AE: Atropine Equivalents; TAE: Tannic Acid Equivalents; -: Not applicable.
Table 1. Phytochemical composition and antioxidant activity (mean ± SD) of Sesbania grandiflora leaf and flower extracts prepared by ultrasound-assisted extraction using different solvents and drying methods.
|
Source of Variation |
TPC |
TFC |
TAC |
TTC |
FRAP |
|
|
F (p; η2) |
F (p; η2) |
F (p; η2) |
F (p; η2) |
F (p; η2) |
|
Plant part (A) |
223.91 (<0.001; 0.903) |
158.65 (<0.001; 0.869) |
322.24 (<0.001; 0.942) |
26.07 (<0.001; 0.566) |
1.78 (0.196; 0.075) |
|
Solvent (B) |
19.59 (<0.001; 0.620) |
394.50 (<0.001; 0.970) |
578.67 (<0.001; 0.983) |
81.63 (<0.001; 0.891) |
285.35 (<0.001; 0.963) |
|
Drying method (C) |
40.65 (<0.001; 0.629) |
120.82 (<0.001; 0.834) |
85.24 (<0.001; 0.810) |
62.50 (<0.001; 0.758) |
11.41 (0.003; 0.342) |
|
A x B |
115.44 (<0.001; 0.906) |
7.14 (0.004; 0.373) |
105.03 (<0.001; 0.913) |
16.63 (<0.001; 0.624) |
96.88 (<0.001; 0.898) |
|
A x C |
200.36 (<0.001; 0.893) |
371.51 (<0.001; 0.939) |
860.00 (<0.001; 0.977) |
623.71 (<0.001; 0.969) |
27.41 (<0.001; 0.555) |
|
B x C |
2.38 (0.114; 0.165) |
80.96 (<0.001; 0.871) |
381.60 (<0.001; 0.974) |
12.07 (0.002; 0.376) |
275.08 (<0.001; 0.962) |
|
A x B x C |
45.92 (<0.001; 0.793) |
122.06 (<0.001; 0.910) |
NE |
31.02 (<0.001; 0.608) |
25.81 (<0.001; 0.540) |
|
R2 (Adj. R2) |
0.972 (0.959) |
0.987 (0.981) |
0.989 (0.984) |
0.979 (0.970) |
0.986 (0.979) |
F: F-statistic; p: significance value; η2: partial η2 (effect size); NE: Not Estimable (due to empty cells resulting from non-detectable values in two treatment combinations); TPC: Total Phenolic Content; TFC: Total Flavonoid Content; TAC: Total Alkaloid Content; TTC: Total Tannin Content; FRAP: Ferric Reducing Antioxidant Power. Significance threshold: p < 0.05.
Table 2. Summary of three-way ANOVA results for phytochemical composition and FRAP of Sesbania grandiflora extracts across plant part, drying method and extraction solvent.
Leaves consistently exhibited higher TPC than flowers across most treatment combinations (Table 3). Oven-dried leaf methanol extracts yielded the highest TPC (848.40 ± 5.09 µg GAE/mg), while oven-dried flower ethanol extracts yielded the lowest (447.76 ± 13.87 µg GAE/mg). Tukey's HSD post hoc analysis grouped solvents into two statistically distinct subsets: ethanol (subset a, mean 665.49 µg GAE/mg) and methanol and water (subset b, means 708.23 and 721.16 µg GAE/mg respectively, p < 0.001). The superiority of aqueous and methanol extracts over ethanol is consistent with the known polarity-dependent extraction of phenolic compounds, whereby highly polar solvents more effectively solubilise phenolic glycosides and hydroxycinnamic acid derivatives than less polar organic solvents.9 The non-significant solvent x drying interaction (p = 0.114) further suggests that the superiority of aqueous and methanol solvents for TPC extraction is consistent across both drying methods, indicating that solvent selection exerts an independent and reproducible effect on phenolic recovery irrespective of the drying approach employed.
|
Factor / Level |
TPC |
TFC |
TAC |
TTC |
FRAP |
DPPH IC50 |
|
PLANT PART |
|
|
|
|
|
|
|
Leaves |
758.58 a |
289.50 a |
37.50 a |
147.70 a |
381.56 a |
85.34 |
|
Flowers |
580.43 b |
323.52 b |
30.53 a* |
162.53 a |
361.56 a |
107.99 |
|
SOLVENT |
|
|
|
|
|
|
|
Ethanol |
665.49 a |
289.42 b |
26.78 a |
147.18 a |
277.61 a |
97.07 |
|
80% Methanol |
708.23 b |
273.89 a |
30.94 b |
149.17 a |
326.22 b |
94.73 |
|
Water |
721.16 b |
409.53 c |
54.85 c |
186.87 b |
495.56 c |
107.69 |
|
DRYING METHOD |
|
|
|
|
|
|
|
Oven drying |
659.41 a |
316.52 a |
33.58 a |
149.23 a |
399.44 a |
93.09 |
|
Freeze drying |
679.60 b |
296.50 b |
34.45 a |
161.00 a |
343.68 b |
100.24 |
Values within each factor followed by different lowercase letters (a, b, c) are significantly different (Tukey's HSD, p < 0.05). * Note: plant part comparison for TAC is based on 10 treatment combinations due to ND values in ODF EtOH and ODF MeOH. TPC: Total Phenolic Content; TFC: Total Flavonoid Content; TAC: Total Alkaloid Content; TTC: Total Tannin Content; FRAP: Ferric Reducing Antioxidant Power; DPPH IC50: not included in ANOVA; values shown are means across treatment combinations.
Table 3. Marginal means (± SE) and Tukey HSD homogeneous subset groupings for main effects of plant part, solvent type and drying method on phytochemical composition and FRAP of Sesbania grandiflora extracts.
With respect to drying method, oven-dried leaf extracts generally exhibited higher TPC than their freeze-dried counterparts, with the most pronounced difference observed in methanol extracts (ODL MeOH: 848.40 ± 5.09 vs FDL MeOH: 761.22 ± 19.56 µg GAE/mg). This possibly reflects a concentration effect arising from heat-induced moisture loss during oven drying, which could elevate the apparent phytochemical content per unit dry weight, although thermal degradation of individual phenolic compounds cannot be excluded. The superior TPC of leaves relative to flowers aligns with previous studies on S. grandiflora, in which leaf extracts demonstrated higher phenolic content than flower extracts,6 likely attributable to the higher density of phenolic-producing cells in photosynthetically active leaf tissue. The elevated TPC values observed across UAE-prepared extracts in the present study are consistent with the well-documented capacity of acoustic cavitation to enhance phytochemical recovery relative to conventional extraction techniques.10,11
3.2 Total Flavonoid Content
TFC ranged from 174.14 ± 3.81 to 463.70 ± 21.10 µg CE/mg extract (Table 1, Figure1B). Three-way ANOVA (Table 2) revealed significant effects of plant part (F = 158.65, p < 0.001, partial η2 = 0.869), solvent (F = 394.50, p < 0.001, partial η2 = 0.970) and drying method (F = 120.82, p < 0.001, partial η2 = 0.834), with all two-way and three-way interactions significant (p < 0.05). The model explained 98.7% of the variance in TFC (R2 = 0.987). Solvent type was the dominant factor for TFC, with Tukey's HSD grouping all three solvents into separate subsets: methanol (subset a, 273.89 µg CE/mg) < ethanol (subset b, 289.42 µg CE/mg) < water (subset c, 409.53 µg CE/mg), all pairwise comparisons significant (p ≤ 0.019).
Freeze-dried flowers yielded the highest TFC across several treatment combinations, with FDF MeOH (429.70 ± 5.46 µg CE/mg) and FDF AqOH (428.80 ± 17.97 µg CE/mg) among the top performers. In contrast, oven-dried flower methanol and ethanol extracts exhibited markedly lower TFC (174.14 ± 3.81 and 220.61 ± 4.01 µg CE/mg respectively), suggesting that flavonoids in flowers are particularly susceptible to thermal degradation during oven drying when extracted with organic solvents. This is consistent with studies reporting that heat exposure promotes flavonoid oxidation and enzymatic degradation.7 The consistently high TFC in aqueous extracts corroborates the known preference of flavonoid glycosides for polar solvent systems, and is in agreement with reports of elevated flavonoid content in water-based S. grandiflora extracts.5
3.3 Total Alkaloid Content
TAC ranged from not detected at the tested concentrations (ND) to 97.37 ± 4.42 µg AE/mg extract (Table 1, Figure 1C). Alkaloids were not detected at the tested concentrations in ODF EtOH and ODF MeOH extracts. Three-way ANOVA (Table 2) on the ten combinations with detectable alkaloid content revealed significant effects of plant part (F = 322.24, p < 0.001, partial η2 = 0.942), solvent (F = 578.67, p < 0.001, partial η2 = 0.983) and drying method (F = 85.24, p < 0.001, partial η2 = 0.810), with significant two-way interactions for all factor pairs (p < 0.001). The three-way interaction term could not be estimated due to empty cells from ND values. The model explained 98.9% of the variance in TAC (R2 = 0.989).
Aqueous extracts consistently yielded the highest alkaloid content, with ODL AqOH showing the highest TAC (97.37 ± 4.42 µg AE/mg). Tukey's HSD confirmed all three solvents differed significantly (p ≤ 0.018): water (c) > methanol (b) > ethanol (a). Due to unequal group sizes from ND values (n = 9 for ethanol and methanol; n = 12 for water), harmonic mean sample sizes were applied and Type I error control may not be precisely maintained. The non-detection of alkaloids at the tested concentrations in ODF EtOH and ODF MeOH extracts may reflect the combined influence of thermal processing during oven drying and the limited solubility of alkaloids in non-aqueous solvent systems, though the precise mechanism warrants further investigation.
3.4 Total Tannin Content
TTC ranged from ND to 234.48 ± 7.75 µg TAE/mg extract (Table 1, Figure 1D). Tannins were not detected at the tested concentrations in FDL AqOH and FDF AqOH extracts, possibly reflecting reduced tannin extractability associated with tannin–polysaccharide interactions and complex formation during extraction; this possibility warrants further investigation.18 Three-way ANOVA (Table 2) revealed significant effects of plant part (F = 26.07, p < 0.001, partial η² = 0.566), solvent (F = 81.63, p < 0.001, partial η² = 0.891), and drying method (F = 62.50, p < 0.001, partial η² = 0.758), with all interactions also significant (p ≤ 0.002). The model explained 97.9% of the variance in TTC (R² = 0.979; adjusted R² = 0.970). Due to unequal group sizes resulting from ND values, harmonic mean sample sizes were used for Tukey’s HSD.
Among the individual treatment combinations, freeze-dried leaf ethanol extract exhibited the highest TTC (234.48 ± 7.75 µg TAE/mg extract). Tukey’s HSD for the main effect of solvent showed that ethanol and 80% methanol extracts were statistically equivalent (p = 0.863) and both had significantly lower TTC than aqueous extracts (p < 0.001), indicating solvent-dependent differences in tannin extractability. The higher TTC in aqueous extracts may reflect differences in solvent-solute interactions and the influence of the plant matrix on tannin recovery. Plant part had the smallest main effect on TTC (partial η² = 0.566); however, the very large plant part x drying interaction (partial η² = 0.969) indicates that the effect of drying method on TTC differed markedly between leaves and flowers. Although the overall drying-method effect was significant in the ANOVA, the marginal means for oven- and freeze-drying did not differ significantly in Tukey’s HSD, suggesting that the effect of drying was dependent on plant part and extraction conditions.
3.5 Antioxidant Activity
3.5.1 Ferric Reducing Antioxidant Power
FRAP values ranged from 201.50 ± 22.91 to 618.33 ± 26.46 µmol Fe(II)/200 µg extract (Table 1, Figure 1E). Three-way ANOVA (Table 2) revealed significant effects of solvent (F = 285.35, p < 0.001, partial η2 = 0.963) and drying method (F = 11.41, p = 0.003, partial η2 = 0.342). Notably, plant part did not significantly influence FRAP values (F = 1.78, p = 0.196, partial η2 = 0.075), distinguishing FRAP from all five phytochemical parameters where plant part was significant. All two-way and three-way interactions were significant (p ≤ 0.001). The model explained 98.6% of the variance in FRAP (R2 = 0.986). The FDL AqOH FRAP value was ND and excluded from statistical analysis.
Solvent type was the overwhelming determinant of FRAP, with Tukey's HSD grouping all three solvents into separate subsets: ethanol (a, 277.61 µmol Fe(II)/200 µg) < methanol (b, 326.22 µmol Fe(II)/200 µg) < water (c, 495.56 µmol Fe(II)/200 µg), all p < 0.001. ODF AqOH yielded the highest FRAP (618.33 ± 26.46 µmol Fe(II)/200 µg). The absence of a significant main effect of plant part on FRAP is a key finding of the present study. While leaves and flowers differed significantly in TPC, TFC, TAC and TTC, their ferric reducing antioxidant power was statistically equivalent when averaged across all conditions. The significant plant x solvent and plant x solvent x drying interactions indicate that leaves and flowers do differ in FRAP under specific conditions, but these differences offset each other overall, suggesting antioxidant activity is governed more by the specific nature and synergistic interactions of extracted compounds than by absolute quantities.19
3.5.2 DPPH Radical Scavenging Activity
DPPH IC50 values for all 12 extracts, alongside ascorbic acid as the reference antioxidant, ranged from 55.84 µg/mL (FDF MeOH) to 187.39 µg/mL (FDL AqOH) (Table 1, Figure 2). Freeze-dried flower methanol (55.84 µg/mL) and oven-dried flower aqueous (59.71 µg/mL) extracts demonstrated the strongest DPPH scavenging. The IC50 values of S. grandiflora extracts were higher than ascorbic acid, as expected given the compositional complexity of crude plant extracts relative to pure compounds. The potent DPPH scavenging activity of several extracts, particularly those prepared with aqueous solvents, is consistent with the high TPC and TFC values observed in these combinations and with previously reported antioxidant activity of S. grandiflora extracts.6
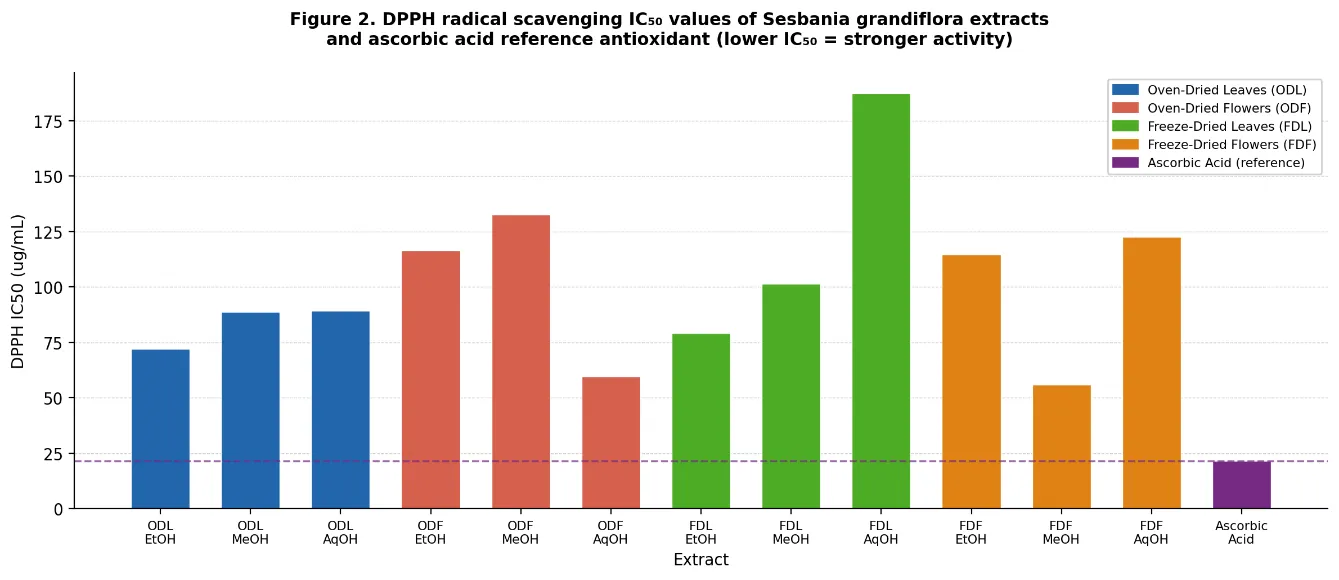
Figure 2. DPPH radical scavenging IC50 values (µg/mL) of Sesbania grandiflora leaf and flower extracts and ascorbic acid reference antioxidant. Lower IC50 values indicate stronger radical scavenging activity. ODL: Oven-Dried Leaves; ODF: Oven-Dried Flowers; FDL: Freeze-Dried Leaves; FDF: Freeze-Dried Flowers; EtOH: Ethanol; MeOH: 80% Methanol; AqOH: Aqueous (Water).
3.6 Spearman Rank Correlation Analysis
Spearman's rank correlation analysis was performed to evaluate relationships among all phytochemical and antioxidant variables across the 12 treatment combinations (Table 4), visualized in the correlation heatmap (Figure 3). Of the 15 variable pairs assessed, one significant correlation was identified: FRAP and DPPH IC50 (ρ = -0.609, p = 0.047). This significant negative correlation confirms that extracts with higher ferric reducing power also exhibited stronger DPPH radical scavenging activity (i.e., lower IC50), validating the internal consistency of the antioxidant measurements and confirming that both assays captured the same underlying antioxidant phenomenon, despite measuring mechanistically distinct reactions.16,17
|
|
|
|
|
|
|
|
|
Variable |
TPC |
TFC |
TAC |
TTC |
FRAP |
DPPH IC50 |
|
TPC |
1.000 |
0.231 |
-0.273 |
-0.164 |
0.382 |
-0.455 |
|
TFC |
- |
1.000 |
0.382 |
-0.236 |
0.600+ |
-0.399 |
|
TAC |
- |
- |
1.000 |
0.643 |
0.583 |
-0.018 |
|
TTC |
- |
- |
- |
1.000 |
0.285 |
0.006 |
|
FRAP |
- |
- |
- |
- |
1.000 |
-0.609* |
|
DPPH IC50 |
- |
- |
- |
- |
- |
1.000 |
* p < 0.05; + p = 0.051 (near-significant trend). Values are Spearman's ρ. n varies by variable pair due to ND values (pairwise exclusion applied). TPC: Total Phenolic Content; TFC: Total Flavonoid Content; TAC: Total Alkaloid Content; TTC: Total Tannin Content; FRAP: Ferric Reducing Antioxidant Power; DPPH IC50: Half-maximal inhibitory concentration.
Table 4. Spearman rank correlation matrix for phytochemical constituents and antioxidant activity of Sesbania grandiflora extracts (n = 12).
A near-significant positive trend was observed between TFC and FRAP (ρ = 0.600, p = 0.051), suggesting that flavonoids may be a primary contributor to the ferric reducing antioxidant capacity of S. grandiflora extracts, consistent with the well-established role of flavonoids as potent reducing agents through their phenolic hydroxyl groups.2 The absence of a significant correlation between TPC and either antioxidant assay suggests that in S. grandiflora, total phenolic content is a poor predictor of antioxidant activity, and that the specific composition of the phenolic fraction is a more meaningful determinant of antioxidant capacity. Similar observations have been reported in other plant species.19,20 The small number of treatment combinations (n = 12) may have limited statistical power to detect additional significant correlations, and this is acknowledged as a limitation of the present study.
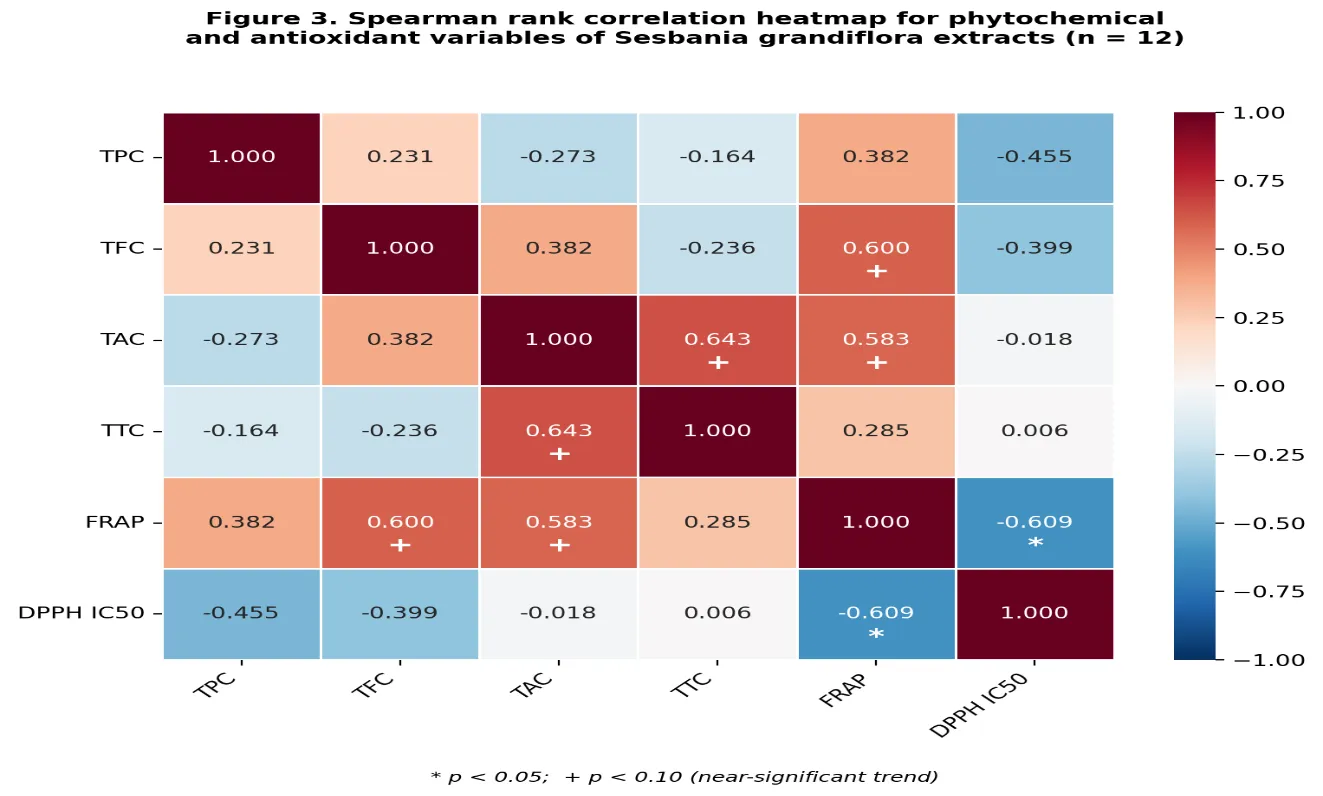
Figure 3. Spearman rank correlation heatmap illustrating relationships among phytochemical constituents and antioxidant activity variables of Sesbania grandiflora extracts (n = 12). Colour intensity reflects the strength and direction of correlation (red: positive; blue: negative). * p < 0.05 (significant); + p < 0.10 (near-significant trend). TPC: Total Phenolic Content; TFC: Total Flavonoid Content; TAC: Total Alkaloid Content; TTC: Total Tannin Content; FRAP: Ferric Reducing Antioxidant Power; DPPH IC50: Half-maximal inhibitory concentration.
CONCLUSION
This study provides a comprehensive evaluation of the influence of plant part, drying method and extraction solvent on the phytochemical composition and antioxidant activity of S. grandiflora leaves and flowers. Aqueous extraction consistently yielded superior recovery of TPC, TFC, TAC, TTC and FRAP across both plant parts and drying methods, establishing water as the most effective solvent for the recovery of polar bioactive compounds from this plant. Ethanol was consistently the least effective solvent across most phytochemical parameters. Leaves generally exhibited higher TPC than flowers, with oven-dried leaf methanol extracts yielding the highest TPC overall, while freeze-dried flowers demonstrated the highest TFC. The non-detection of alkaloids at the tested concentrations in oven-dried flower organic solvent extracts highlights the sensitivity of specific compound classes to combined thermal and solvent-based processing conditions. Notably, plant part did not significantly influence FRAP, indicating that antioxidant capacity as measured by ferric reducing power is driven more by solvent type and drying method than by plant part selection. The significant negative correlation between FRAP and DPPH IC50 confirmed the internal concordance of both antioxidant measures, while a near-significant positive trend between TFC and FRAP suggests flavonoids as key contributors to the antioxidant activity of S. grandiflora extracts. Collectively, these findings provide evidence-based guidance for the optimisation of extraction protocols for S. grandiflora and support its potential as a sustainable source of bioactive compounds for food, nutraceutical and pharmaceutical applications. Future studies should investigate individual phytochemical characterisation by HPLC, optimisation of UAE parameters, in vivo bioavailability and biological activity in relevant model systems.
ACKNOWLEDGEMENTS
Srijana M Shekar gratefully acknowledges the financial support received from the Karnataka Science and Technology Promotion Society (KSTePS), Department of Science and Technology, Government of Karnataka, through the Karnataka DST-Ph.D. Fellowship.
REFERENCES


Srijana M. Shekar*, Asna Urooj, Influence Of Drying Method And Extraction Solvent On The Phytochemical Composition And Antioxidant Activity Of Sesbania Grandiflora (L.) Pers. Leaves And Flowers, Int. J. Sci. R. Tech., 2026, 3 (10), 262-275. https://doi.org/10.5281/zenodo.23161627
 10.5281/zenodo.23161627