

We use cookies to ensure our website works properly and to personalise your experience. Cookies policy
Computer Science and Engineering, Indian Institute of Technology Jodhpur
In the modern period, people in various fields frequently use different types of charts to express their opinions and convey information by analyzing the data. Moreover, charts help to provide accurate answers about the data. Specifically, bar charts are an effective technique to convey numeric information, but today's algorithms have less potential to interpret such data. Due to the inability to process different types of charts at the same time, automatic data extraction from charts remains a challenging task. However, deep learning techniques are the one and only way to cope with such issues. Hence, this research presents a hybrid network architecture named LST-ResNet to achieve an effective Question Answering (QA) system using bar chart images. The hybrid network structure is derived by the integration of Deep Long Short Term Memory (Deep LSTM) and Deep Residual Network (Deep ResNet). Moreover, the residual layer of the hybrid network architecture is trained using the proposed Ant Lion Political Optimizer (ALPO), which is derived from the combination of Ant Lion Optimization (ALO) and Political Optimizer (PO), respectively. The proposed ALPO-hybrid network achieved higher performance in terms of accuracy, precision, recall, and F1-measure with the values of 87.231, 0.860, 0.826, and 0.866, respectively.
The general quote among business people is “Data everywhere, information nowhere”. It is commonly known to all people that all reports and presentations related to the company’s projects are in the form of folders, and they are usually structured with eye-popping charts that consist of images in the form of formidable data. However, achieving the relevant data from such charts still remains a challenging issue [18] [25]. In order to cope with such a limitation, an automatic system is developed to extract useful information from charts that could offer great advantages in the area of knowledge management happening inside the organization. This extracted knowledge can be merged with various datasets in order to improve the business value [3]. Question Answering (QA) is a usual task and is utilized to solve various issues. Such issues are very difficult to solve because of the presence of several complexities in natural language. However, a QA system utilizes knowledge that consists of different facts and captures the suitable answer from the knowledge. In most of the conventional QA models, the structured knowledge graph and raw text are employed as their knowledge. Unfortunately, the corpora of raw text are very difficult to understand for machines. In addition, most of the knowledge graphs consist of a higher amount of noise, and such graphs still require manual intervention [2]. Data visualizations, such as pie charts, bar charts, and plots, consist of abundant information in a precise manner. Such data visualizations are particularly developed to interrogate data for concerned people and are not established to be a machine-interpretable technique [30] [1]. Visualization techniques assist any individual to analyze the data, answer the questions, and describe how the relevant answer was achieved, which is considered a major step in many of the decision-making processes. However, analyzing the data with the use of visualization techniques is not preferable very much because of its complexities [17]. Users frequently require answering compositional questions that need aggregation of various complex tasks, like reconstructing a value from the chart, determining extreme values, comparing the values and merging them, and computing sums and differences of values [24] [4].
Typically, a chart consists of a group of structural texts and data. In terms of bar charts, texts can be broadly categorized into four types, namely title, axis-tick or legend, axis-title, and data information, which are transformed into the height and width of the bar charts [16]. In order to extract the graphical and textual data obtained from bar charts, it is essential to determine the bounding boxes of bars and texts. In computer vision community, the detection of object is a major hurdle [3]. Statistical charts are specifically designed to facilitate the understanding of huge amounts of information and the relationships between various components of the data [19] [20]. The humans have high vision power can analyze the high amounts of data easily existed in a precise and rigid manner in the charts. Various applications are constructed according to the potential without considering the users. There exists a large amount of algorithms and tools that are capable of transforming text-to-speech, which helps individuals in understanding and reading the documents in most of the areas [7]. Charts and figures are efficient and broadly utilized to represent the data in documents in every field. Hence, it is significant to understand the documents by investigating secure technologies that can explain charts and figures and have the potential to answer different user queries. Due to the rapid advancement of deep learning technologies, it is easy to define the images, like charts that provide a high annotated corpus. However, it is a difficult task to collect massive data including of charts also with explanations mainly due to some reasons, such as cropping of legal and copyright problems during the period of extraction of charts from various documents and scrapping of charts from documents [31] [6]. In our previous research, we introduced a natural language query-to-chart image retrieval framework, entitled “Bridging Language to Visuals: Towards Natural Language Query-to-Chart Image Retrieval,” which aimed to establish a connection between textual queries and visual chart representations. The proposed approach investigated the retrieval of relevant chart images in response to natural language queries, thereby providing an initial step toward facilitating efficient access to chart-based information. However, retrieving a relevant chart image does not directly provide the specific information requested by the user and still requires further interpretation of the retrieved visualization. This limitation motivates the development of a more comprehensive approach capable of understanding chart images and generating answers to natural language questions, which is the primary focus of the present research [32].
Deep learning has converted the computer vision and natural language processing landscapes and has become a widely utilized tool in their related applications [21]. The Convolutional Neural Networks (CNN) has become successful in the field of Image Net Classification task [1]. Moreover, Long Short-Term Memory (LSTM) has the potential to handle difficult process, such as machine passage comprehension [4], sentence summarization [10], and Neural Machine Translation [11]. The models of Neural Network are utilized as a preliminary attempt to model reasoning. An excessive amount of visual reasoning techniques [12], [13] have been generated to such potentials of neural networks. However, a visual question answering tasks need a collaboration of Natural Language Processing (NLP) [9], reasoning and Computer Vision Models. However, the model has the potential to obtain representations of the image and question rather than merging such representations in order to create an answer. This complex task assists the machines to perform visual signals and utilizes it to tackle multi-modal problems [8]. In addition, a deep learning solution is presented that automatically excerpts the data from bar and pie charts and significantly transforms a chart into a relational data table. Initially, this method detects the kind of a chart and then utilizes a single deep learning technique that excerpts all the relevant constituents and data [3].
The primary intention of this research is to design and develop hybrid network architecture for QA system from bar chart images. Conventional methods employed for question answering system faced many limitations and various types of charts cannot be processed by the same system. This method provides effective reading of answers from bar chart images. The proposed technique consists of two phases, namely training and testing phase. In training phase, the bar chart image and Question and Answer pair are considered as the inputs, whereas the testing phase considers the bar chart image and Questions as the inputs. Finally, the answers are predicted using residual layer of hybrid network architecture, where the network classifier is trained using the proposed algorithm named ALPO. However, the hybrid architecture is derived by the combination of Deep LSTM and Deep ResNet.
The rest of the paper is structured as follows: Section 2 deliberates the literature review of QA systems along with their merits and demerits. Section 3 introduces newly developed hybrid architecture and the description of the structure is briefly explained. The proposed ALPO algorithm and its training procedure are detailed in section 4. Section 5 illustrates about the results and discussion of the proposed method. Finally, the research comes to a conclusion in section 6.
2. MOTIVATION
This section explains the literature review of various existing question answering system along with their advantages and demerits that motivates the researchers to design and develop an effective method for question answering system from bar chart images.
2.1 Literature Survey
Various traditional techniques related to question answering system are deliberated in this section. Kushal Kafle, et al. [1] developed DVQA for understanding the bar charts. Here, two DVQA algorithms were presented to handle chart-specific words in questions and answers. This model served as a significant proxy task for understanding visual attention, memory, and reasoning capabilities. However, even a slight variation was completely altered the chart's information is still remains as a challenging limitation. Hao Wang, et al. [2] modeled an efficient question answering system based on semi-structured tabular data. This system was mainly comprised with two parts that were utilized to choose the candidate tables and delivered answers. This system achieved higher performance due to the effect of attention layer. However, it failed to add MCQs with multiple correct choices to the dataset. In addition, the system also failed to concentrate on recall of table selection model. Xiaoyi Liu, et al. [3] devised a framework of single deep neural network that mainly includes text recognition, object detection, and object matching modules. The presented framework effectively controlled both bar and pie charts and there was a possibility to extend this framework to different types of charts by augmenting the training data. The method provided successful results for simulated bar charts. The major challenge lies in this technique is that it achieved poor performance while downloading the images from internet. Dae Hyun Kim, et al. [4], introduced an automatic chart question answering pipeline that creates visual explanations defining how the answer was obtained. The developed mechanism first extracted the data and visual encodings from an input vega-line chart. Then, it converted references into visual values. At last, it utilized a template-based model to describe by means of natural language in which how the answer was determined using the chart's visual features. The developed pipeline framework provided more transparency than the answers generated manually. The issues, such as slight variations, and low performance in fluency is also a major drawback of this system.
Kushal Kafle, et al. [5], developed a Chart Question Answeing (CQA) algorithm called Parallel Recurrent Fusion of Image and Language (PReFIL) for fine grained-measurements and effectively handled the out-of-vocabulary words for both questions and answers. Here, PReFIL knows about the bio-modal embeddings by merging question and image features and after that collaborated such leaned embeddings to answer the questions. Although the method attained better performance in terms of reconstruction of information from charts, but it could not able to provide better performance utilizing dynamic encoding method. Ritwick Chaudhry, et al. [6], devised LEAF-QA along with an attention network to effectively deal with the limitations of multimodal QA system. Here, the data was augmented with a set of test that was built from unavailable data sources to test in order to generate the question answering models. This LEAF-QA approach attained better performance across various question types, but failed to provide higher performance for more complicated relational questions. Monika Sharma, et al. [7], developed an effective QA system called ChartNet-based on a MAC-Network to provide answers from a predefined vocabulary of generic answers. This approach was also employed to process visual question answering over statistical charts. The main specialty of this approach was that it predicted both vocabulary and out of vocabulary answers. However, it failed to generate a textual summary of the statistical charts. Revanth Reddy, et al. [8], presented a deep learning model, which was mainly designed for handling the issues of reasoning task of question-answering system on categorical plots. The presented model was tested on the FigureQA dataset that provides images for scientific representations, such as pie charts, and bar graphs. Moreover, this model targeted to handle the numeric and visual reasoning tasks by exploiting modular components. The major limitation exists on this method is that it delivered low performance while processing low-median and high-median questions.
2.2 Major Challenges
Some of the challenges confronted by the existing QA system are deliberated below:
3. Hybrid architecture: LST-RES-NET
This research is focused to predict accurate answers from bar chart images by designing new hybrid network architecture named LST-ResNet for effective QA system. However, this hybrid network structure is derived by the integration of Deep LSTM and Deep ResNet. The proposed network consists of five layers, namely embedding layer, LSTM layer, residual layer, Attention layer, and Multi-layer perceptron (MLP) layer. The bar graph image, and Question and Answer pair are considered as an input data. The input data undergoes several processes and finally the answer is retrieved at the MLP layer. The schematic view of hybrid architecture of LST-ResNet is portrayed in figure 1. The layers in the hybrid LST-ResNet is described as follows:
3.1 Embedding layer
The first layer of the hybrid network architecture is embedding layer, in which the input data is acquired from the database. The input bar chart image is applied to the embedding layer for further processing. The purpose of utilizing the embedding layer is that it completely transforms the bar graph images into vectors. It is essential to encode the input data into integer. Moreover, an embedding layer is utilized to convert syntactic words into real vectors by considering the semantic and syntactic relationships between words.
(i) Kernel: Kernel is flexible in specifying a definite positive kernel that is employed to specify any data representations, like matrices, vectors, sequences, and graphs. The kernel-guided embedding layer usually encodes a similarity metric that is customized for matching document and query. In addition to this, kernel is used to offer a versatile framework to process statistical learning with data representations [26].
(ii) Bias: Bias plays a major role as a threshold for meaningful activation of neurons. The result obtained from the embedding layer is further subjected to LSTM layer.
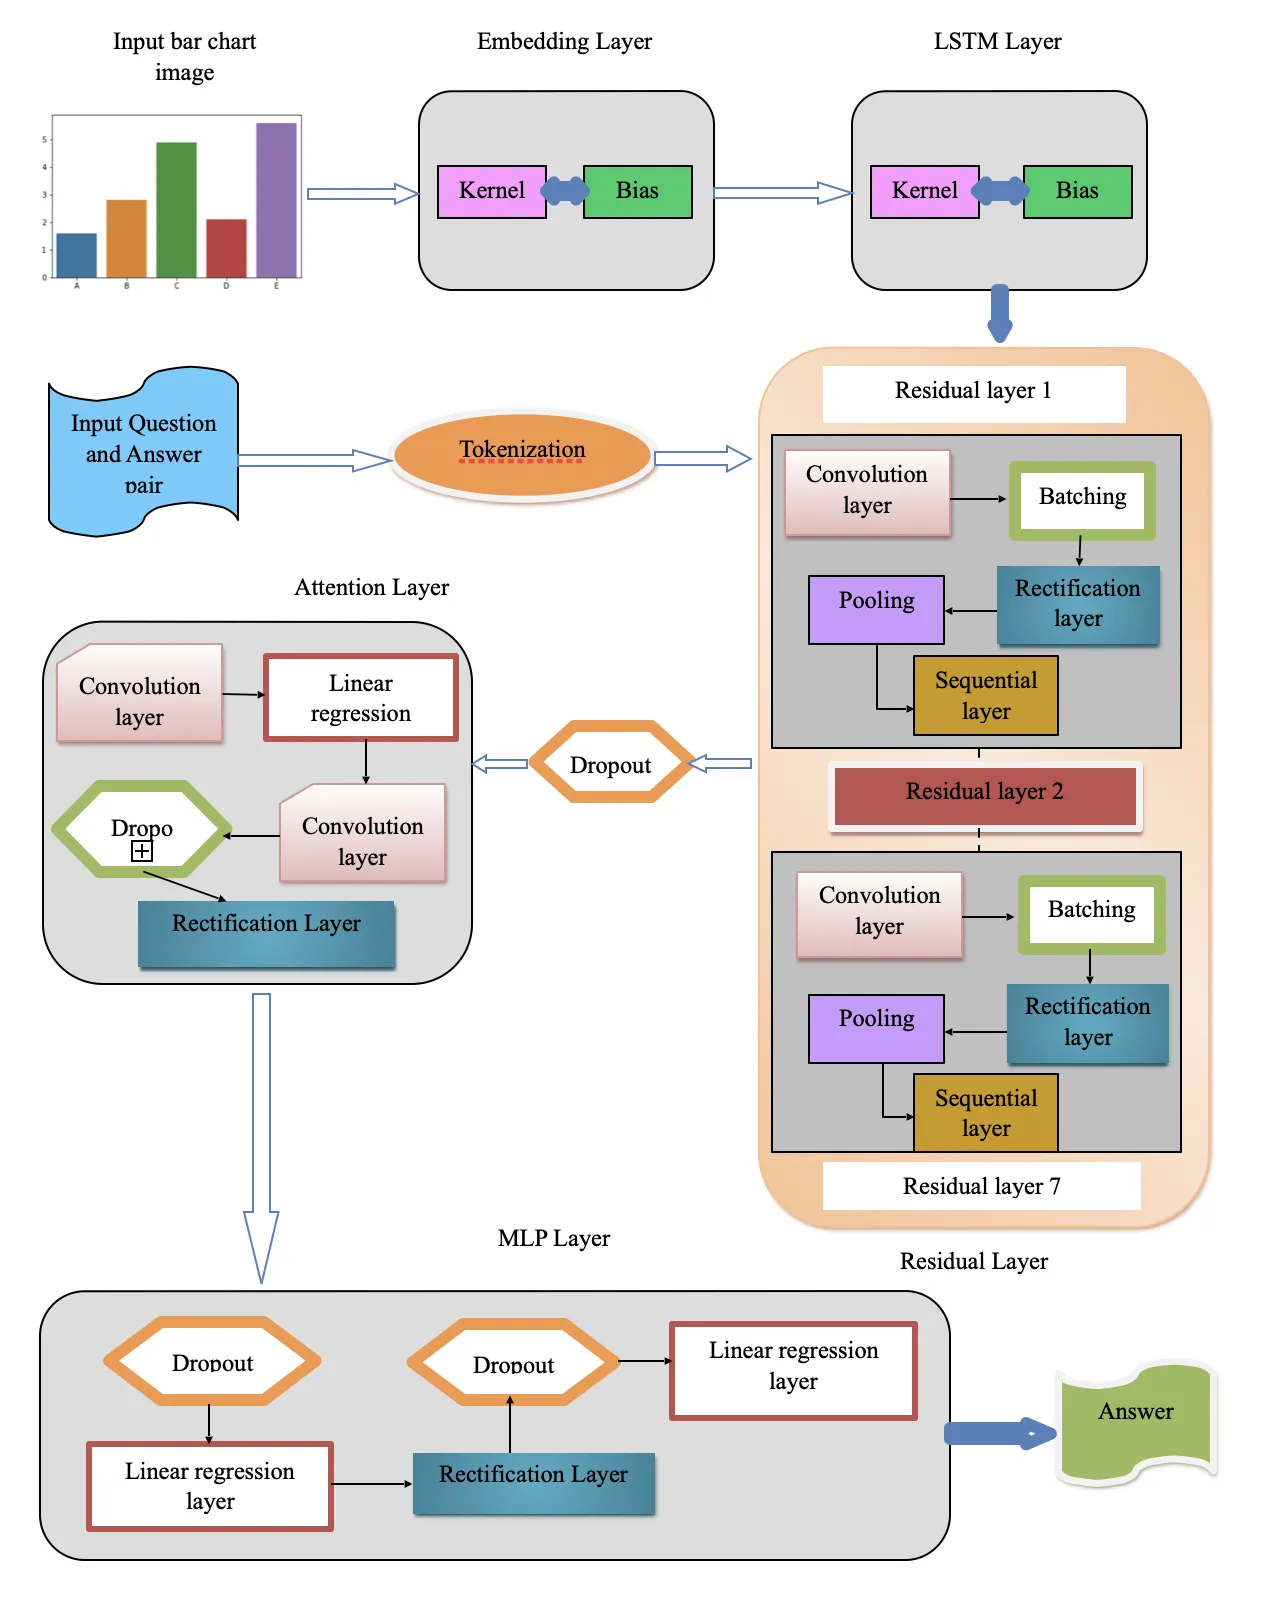
Figure 1. Proposed hybrid network architecture
3.2 LSTM layer
The LSTM layer is processed according to the selected input. However, not all input images are subjected to training process. Among all the input bar chart images, some specified and selected images are utilized to train the LSTM layer, thereby providing efficient information gain by effectively tuning the layer. With such inputs, LSTM layer observes the correlation and mapping between the input images and their projection. Typically, LSTM layer is mainly comprised with three elements, such as kernel, bias, and recurrent kernel.
(i) Kernel: The kernel is mainly utilized to filter small areas of an image in order to generate feature values of small areas. In some of the particular applications, it is significant to employ multiple convolution kernels, such that the convolutional kernels are considered to represent an image style.
(ii) Bias: For meaningful stimulation of neurons, these bias act as a significant threshold. Here, the kernel acquires the input of image along with the result of recurrent kernel in order to remember the former details based on the structure of image.
3.3 Residual layer
The third layer is the residual network layer, which is considered as an important layer in this architecture. Residual Network (ResNet) [18] is a kind of Convolutional Neural Network (CNN) structure that is generally utilized in the domain of ImageNet Large Scale Visual recognition challenge (ILSVRC). The benefit of ResNet is that it effectively trains the extreme deep neural networks by applying the principle of shortcut connections, such that one or more layers can be skipped. Moreover, it effectively addresses the issues of low accuracy without degrading the performance and solves the limitation of vanishing gradient [23]. Another advantage of ResNet is that it facilitates the training process due to the smooth travelling of gradients through the layers. Fast training process is a significant characteristic of ResNet because the residual connections do not hinder any gradients. There are number of residual layers in the residual network. The input image is passed through a number of units including Convolutional layer, Batching layer, Rectification layer, Pooling layer, and Sequential layer.
(i) Convolution layer: Convolution layers are used to extract the effective features automatically from input feature maps by a group of small receptive fields, like kernels with sufficient depth.The mathematical process of conv2D is given by,
where, e and g are utilized to record the coordinates. Here, j denotes thecpxp kernel matrix. The position index in the 2D matrix is denoted by W X H .
(ii) Batching layer: In most of the deep learning techniques, the training set are partitioned into a group of small sets known as mini-batches. After that, the model is trained based on these mini-batches in order to achieve a better tradeoff between the computation complexity and the convergence speed. However, the mini-batch technique is highly vulnerable to limitation such as, internal covariate shift that may degrade the performance of the training speed and its stability. Therefore, Batch Normalization (BatchNorm) is a technique developed by Ioffe and Szegedy to decrease the issue of internal covariate shift by normalizing the input layers by means of scaling, thereby enhancing the training speed and also mitigates the overfitting problem.
(iii) Rectification layer: Rectification layer is a linear function that results the input directly if it is a positive one or else it results as zero.The raw dataset contains complex and non-linear features, such that the non-linearity of extracted features is increased using the non-linear activation function.
(iv) Pooling layer: The pooling layer is generally impelled into the consecutive convolution layers is mainly employed to mitigate the spatial dimension of the feature map and effectively reduces overfitting. Moreover, it reduces the computational complexities. In fact, pooling layer effectively mitigates the dimensions of data when compared with the convolution layer.
(v) Sequential layer: It is utilized to make decision functions. The feature maps of every layer are subjected to sequential layer without any variation. However, the organization of sequential layer is usually depends upon the type of application and data.
3.3.1 Dropout
Dropout is mainly employed to ignore vanishing of all useful information from the units. It is essential to consider both of the output of neuron and its internal structure to develop an efficient dropout model. Typically, dropout processes by decoupling the nodes from present layer to the next layer and it is fully a stochastic regularization technique specifically utilized for maintaining the fully connected layers.
3.4 Attention layer
Attention layer processes only essential information and also it enhances the performances of entire system. Attention layer gives more priority to the target value rather than focusing on all information. It has enough potential to prevent all useful information and has the ability to handle various types of images over the conventional techniques. This layer automatically chooses the significant relevant source data to generate suitable output in various fields, such as video or image captioning, machine translation, and visual question answering system. The layers impelled in this attention layer are convolution layer, Linear regression layer, dropout, and rectification layer.
3.5 Multi-Layer Perceptron
A multi layer perceptrons (MLP) is a finite acyclic graph in which the nodes are known as neurons connected with logistic activation. The features are combined to form a feature vector and subjected to the linear regression layer.
(i) Linear regression layer: In linear regression layer, the final output is predicted and finally the answer for input bar image is obtained.
On the other hand, Question and answer pair is considered as an input and is subjected to tokenization, where the significant keywords are extracted. The detailed explanation of this process is presented in section 4.
4. Proposed ALPO-based hybrid network
The main intention of this research is to design and develop hybrid architecture named LST-RES-NET to provide an effective Question and Answering system. The proposed approach called ALPO-based hybrid network plays a main role in providing effective reading of answers from bar chart images. The proposed scheme consists of two phases, namely training phase and testing phase. In training phase, the bar chart image and Question and Answer pair are considered as an input, whereas the testing phase considers the bar image and question as an input in order to retrieve the appropriate answer.
4.1 Training phase
The training phase consists of two inputs, such as bar chart image, and Question and Answer pair, which are acquired from the dataset specified in [29]. Initially, the input bar chart image is subjected to the embedding layer of newly developed hybrid architecture called LST-RES-NET. Then, the output of the embedding layer is passed through the residual layer of Deep ResNet for further processing. On the other hand, the Quest and Answer pair is considered as an input image, which is subjected to stop word removal and stemming process in order to remove the redundant and unnecessary words from the Question and Answer pair. Furthermore, the obtained result is subjected to perform tokenization, where the significant keywords are extracted. Finally, the extracted keywords are passed through a residual network to provide an appropriate answer. However, the residual layer of hybrid network is trained using the proposed ALPO algorithm. The proposed ALPO is derived by the integration of Ant Lion Optimization (ALO) [14], and Political Optimizer (PO) [15]. The schematic diagram of training phase of proposed ALPO-based hybrid network is represented in figure 2.
Figure 2. Training Phase of proposed ALPO-based hybrid network
4.1.2 Embedding layer of LST-RES-NET
The input Bi is subjected to the embedding layer of hybrid LST-RES-NET, where the bar chart image is transformed into vectors. However, the embedding layer consists of kernel and bias and each has its own characteristics. The kernel assists to specify the data representations, such as bar chart, matrices, and sequences, whereas bias acts as a threshold activation function. The embedding layer of LST-RES-NET is elaborated in section 3.1.
4.1.3 Residual layer
The result obtained from embedding layer of LST-RES-NET is passed through the residual layer of Deep ResNet for further processing. The main purpose for selecting the residual network is that it provides fast training process and reduces the computational time. Moreover, it trains the deep neural networks effectively and also mitigates the problem of vanishing gradient. The residual layer in Deep ResNet consists of five units, including convolutional layer, batching, pooling, rectification and sequential layer, which are described in section 3.3.
4.1.4 Stop word removal
On the other hand, the input Qab is subjected to process stop word removal and stemming technique,
in which the unnecessary words are eliminated. In this process, the stop words, like am, is, are, etc., are eliminated according to the list of stop words prepared already. The existence of stop words overcomes several important words since they commonly occur in documents. Default words, such as of, is, and like are expelled from the features list as they do not represent any information. Typically, stop words are frequently happened at the time of sentence formation but does not have any significance to determine the subject of the document. The result obtained from stop word removal process is signified as Sr .
4.1.5 Stemming
Stemming is the process of reducing the term to its origin form by extracting the suffix and prefix of the word. Stemming is considered as a significant process. In this step, suffix list is utilized to eliminate the suffixes from words for generating appropriate stem word. Stemming process transforms the derivative words of document to its base root form and it is expressed as,
4.1.6 Tokenization
Tokenization is defined as the process of excerpting the suitable content from a document by breaking the content into small or chunks of text called as tokens [28]. The question entered into the tokenization process is transformed into single words or tokens and the process is mainly utilized to ease up the complex questions. It is used to extract the appropriate keywords from the given question.
4.2 Testing phase
The second step in this approach is the testing phase, in which the bar chart image and a random question are considered as an input. The input bar chart image is subjected to the embedding layer of LST-RES-NET and then to the residual layer similar to that of the training phase. On the other hand, the input question is subjected to stop word removal and stemming process. Moreover, the next phase is keyword extraction, where the document is broken into number of chunks called tokens. The tokenized keyword is passed through the residual layer in order to retrieve an appropriate answer. Figure 3 portrays the block diagram of testing phase of proposed ALPO-based hybrid network.
Figure 3. Testing phase of proposed ALPO-based hybrid network
4.3 Training model of proposed hybrid network
The main reason for selecting the residual network is that it helps to smooth out the training process in an easy manner due to the gradients and additional operators that bypass some layers. The architecture of proposed hybrid network is explained as follows.
4.3.1 Architecture of proposed hybrid network
The proposed hybrid network named LST-ResNet is derived by the combination of Deep LSTM and Deep ResNet. The hybrid architecture consists of five layers, namely embedding layer, LSTM layer, Residual layer, Attention layer, and Multi-layer perceptron. The embedding layer and LSTM layer is comprised with kernel and bias in order to transform the bar chart image into vector form. However, the residual layer consists of seven layers, in which each layer or block includes convolutional, batching, pooling, rectification, and sequential layer. The process of such layers are briefly explained in section 3.
4.3.2 Training residual layer of hybrid network using proposed ALPO
Politics is defined as the process of optimization from two different views, such as each individual discloses their goodwill in order to win the election and each party works well to increase their number of seats in the parliament to setup a new government. These reasons make the politics as a powerful inspiration for an optimization algorithm. However, each individual is assumed to be a candidate solution, and each individual's goodwill is assumed to be a position of the candidate solution. The objective function is evaluated by considering the election. PO is developed by inspiring from these four main aspects, like electoral process, intra-party collaboration, goodwill of the candidates, and cooperation of the winning candidates. In this research, a newly proposed method called ALPO is employed to train the proposed network. However, the proposed ALPO is derived by the incorporation of PO [15], and ALO [14]. The training procedure of PO is explained as follows:
Ant Lion Optimizer (ALO) [14] is a nature-inspired optimization algorithm that inspires about the hunting behavior of ant lions. The two interesting things that has been noticed in the hunting style of ant lions are level of hunger and shape of the moon. It traps the ants by digging a cone -shaped pit in sand. The edge of the pit easily trapped the ants as it is very sharp that grasps the ants to fall to the pit. In this step, ALO is incorporated with the PO to achieve optimal solution.
The random walk of ants are normalized using the below equation,
5. RESULTS AND DISCUSSION
This section describes the results and discussion of proposed ALPO with respect to the evaluation metrics.
5.1 Experimental setup
The implementation of proposed ALPO-based hybrid network is carried out in a PC with intel core-i3 processor and the experimentation is done in the PYTHON tool using DVQA dataset specified in [29].
5.2 Dataset description
The corpus of DVQA dataset consists of images, metadata, and question and answer pairs. The images utilized in this dataset have the ability to expand up to 6.5 GB, whereas the question and answer pairs expand up to 750 MB. Moreover, this dataset provides elaborated annotations of each and every object that can act as either the source of extra supervision or additional evaluation of algorithm's performance.
5.3 Evaluation metrics
(i) Precision: precision is also called as positive predictive value and it is termed as the ratio of relevant contents to the reconstructed contents.
(ii) Recall: Recall is also expressed as the ratio of relevant documents to the retrieved documents.
(iii) F-measure: F-measure is typically utilized to test the accuracy. However, it is determined from precision and recall measure and it is termed as the twice of the product of recall and precision to the sum of the two measures and it is expressed as,
5.4 Performance analysis
This section explains the performance analysis of proposed ALPO-based hybrid network with respect to the evaluation metrics, such as precision, recall, and F-measure.
5.4.1 Analysis of proposed ALPO-hybrid network using easy type images
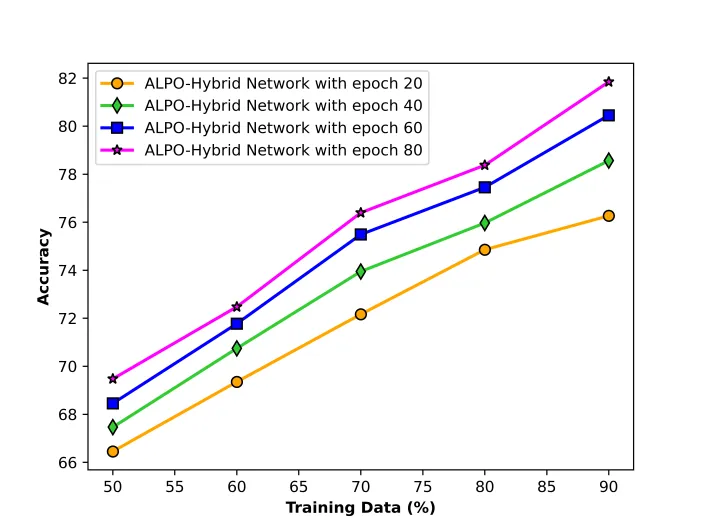
Figure 4 portrays the performance analysis of proposed ALPO-hybrid network with respect to the evaluation metrics by varying the percentage data for easy type images. Figure 4a) represents the analysis of proposed ALPO-hybrid network in terms of accuracy. When the training data=50%, the accuracy obtained by proposed ALPO-hybrid network with epoch 20=66.453, with epoch 40= 67.463, with epoch 60=68.453, and with epoch 80=69.475. Similarly, by varying the training data to 90%, the proposed ALPO-hybrid network attained the accuracy of 76.26 for epoch=20, 78.564 for epoch=40, 80.453 for epoch=60, and 81.846 for epoch=80
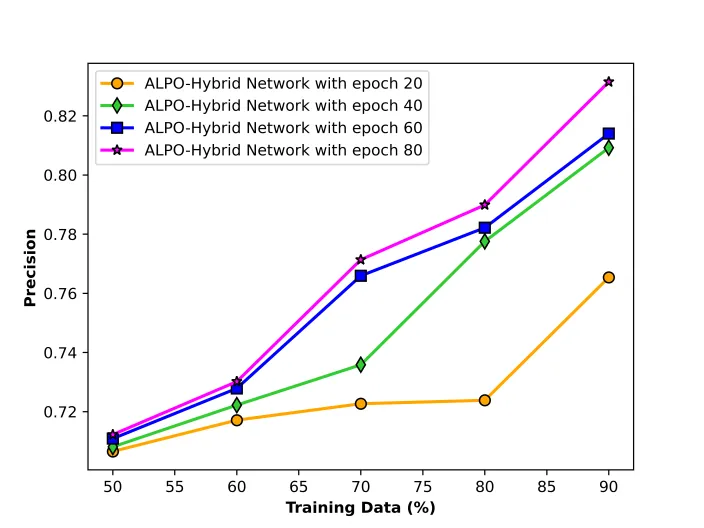
Figure 4b) represents the analysis of proposed ALPO-hybrid network in terms of precision. When the training data=50%, the precision obtained by proposed ALPO-hybrid network with epoch 20=0.707, with epoch 40= 0.708, with epoch 60=0.711, and with epoch 80=0.712. Similarly, by varying the training data to 90%, the proposed ALPO-hybrid network attained the precision of 0.765 for epoch=20, 0.809 for epoch=40, 0.814 for epoch=60, and 0.832 for epoch=80.
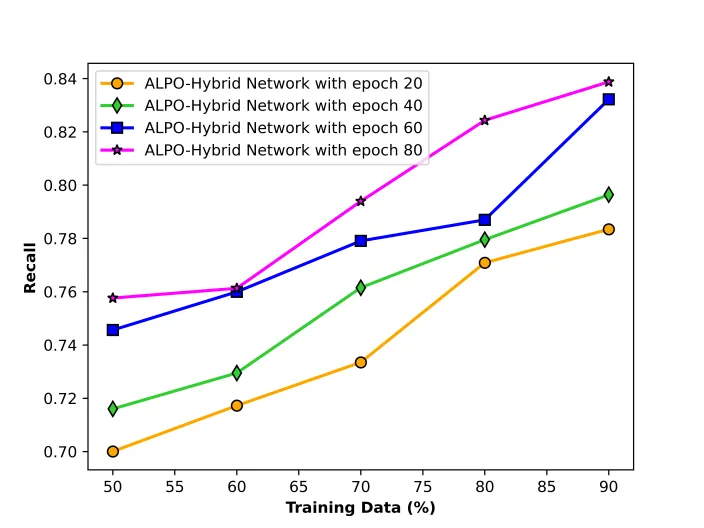
The analysis of proposed ALPO-hybrid network with respect to recall is depicted in figure 4c). If the training data=50%, the recall attained by the proposed ALPO-hybrid network with epoch 20, with epoch 40, with epoch 60, are 0.700, 0.716, 0.746, and with epoch 80 is 0.758, respectively. If the training data is increased to 90%, the recall obtained by the proposed approach with epoch 20 is 0.783, with epoch 40 is 0.796, with epoch 60 is 0.832, and with epoch 80 is 0.839.
Figure 4d) illustrates the analysis of proposed ALPO-hybrid network in terms of F1-measure. When the training data is 90%, the F1-measure achieved by the proposed ALPO-hybrid network with epoch=20 is 0.774, with epoch=40 is 0.803, with epoch=60 is 0.823, and with epoch=80 is 0.835.
|
|
|
|
(a) |
(b) |
|
|
|
|
(c) |
(d) |
Figure 4. Analysis of proposed ALPO-hybrid network based using easy type images a)Accuracy b)Precision c) Recall d) F1-measure
5.4.2 Analysis of proposed ALPO using hard type images
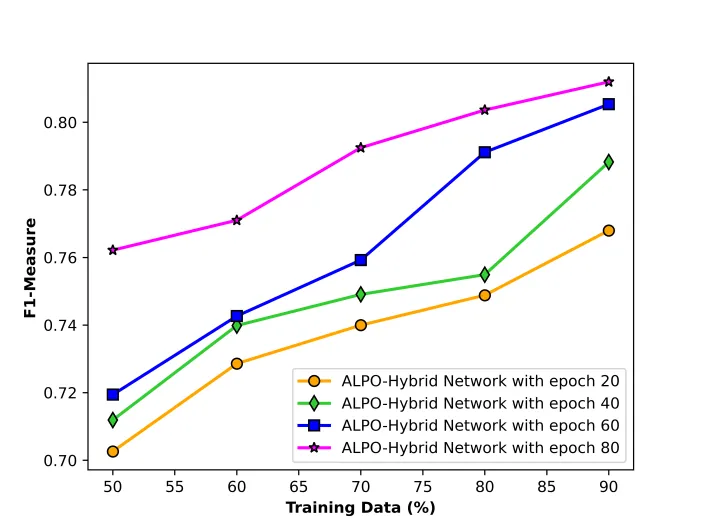
Figure 5 represents the analysis of proposed ALPO-hybrid network with respect to the evaluation metrics for hard type images by varying the training data.
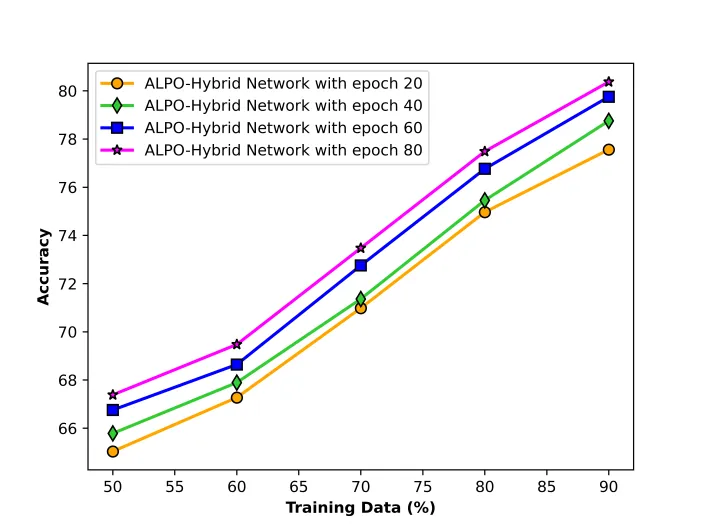
Figure 5a) depicts the analysis of developed scheme by considering accuracy. If the training data=50%, the accuracy achieved by the proposed ALPO-hybrid network with epoch=20 is 65.037, with epoch=40 is 65.786, with epoch=60 is 66.756, and with epoch=80 is 67.384.
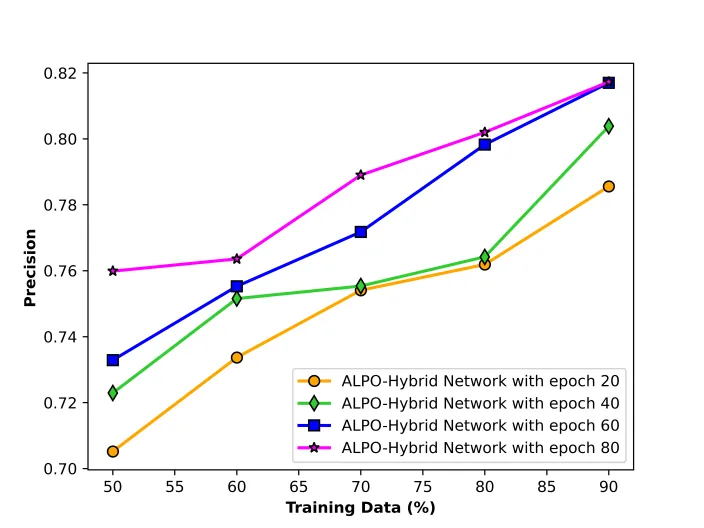
Figure 5b) depicts the analysis of developed scheme by considering precision. If the training data=50%, the precision achieved by the proposed ALPO-hybrid network with epoch=20 is 0.705, with epoch=40 is 0.723, with epoch=60 is 0.733, and with epoch=80 is 0.760.
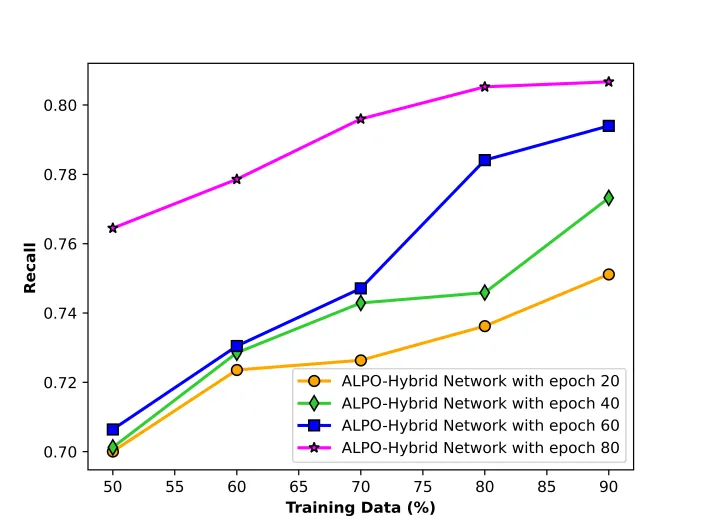
The analysis of proposed ALPO-hybrid network in terms of recall is portrayed in figure 5c). When the training data =50%, the recall attained by the developed ALPO-hybrid network with epoch 20 is 0.700, with epoch 40 is 0.701, with epoch 60 is 0.706, and with epoch 80 is 0.764. Correspondingly, if the training data is increased to 90%, the recall obtained by the proposed ALPO-hybrid network with epoch=20, with epoch=40, with epoch=60, and with epoch=80 is 0.751, 0.773, 0.794, and 0.807.
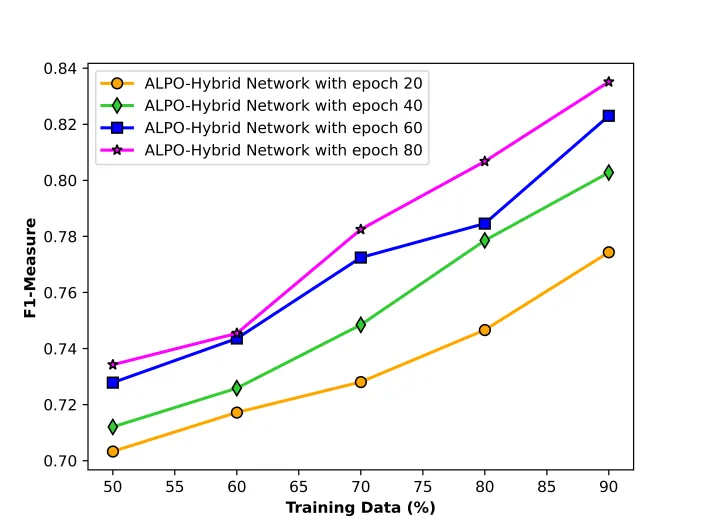
Figure 5d) depicts the analysis of proposed ALPO-hybrid network with respect to F1-measure. When the training data=90%, the F1-measure attained by the developed ALPO-hybrid network with epoch=20 is 0.768, with epoch 40 is 0.788, with epoch 60 is 0.805, and with epoch 80 is 0.812.
|
|
|
|
(a) |
(b) |
|
|
|
|
(c) |
(d) |
Figure 5. Analysis of proposed ALPO-hybrid network based using hard type images a)Accuracy b)Precision c) Recall d) F1-measure
5.5 Comparative methods
The performance improvement of the developed approach is analyzed by comparing it with the traditional schemes, such as MLP, ANN+ Attention [3], LSTM [9], and ResNet [18].
5.6 Comparative analysis
This section elaborates the comparative analysis made by the developed ALPO-hybrid network with respect to precision, recall, and F1-measure by varying training data.
5.6.1 Analysis using easy type images
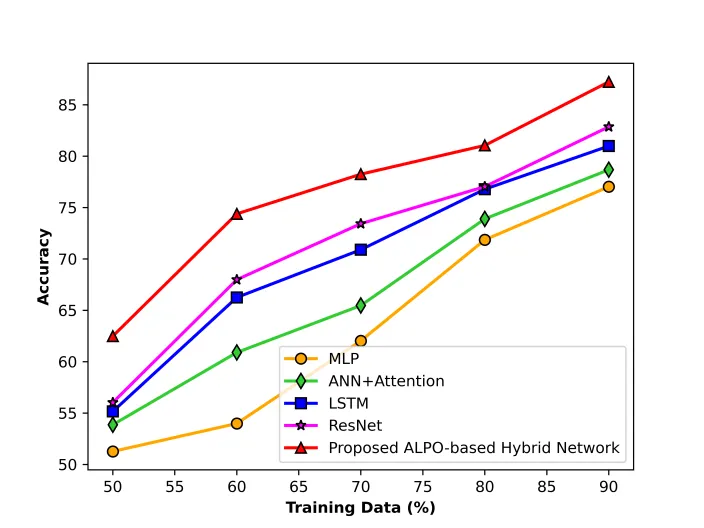
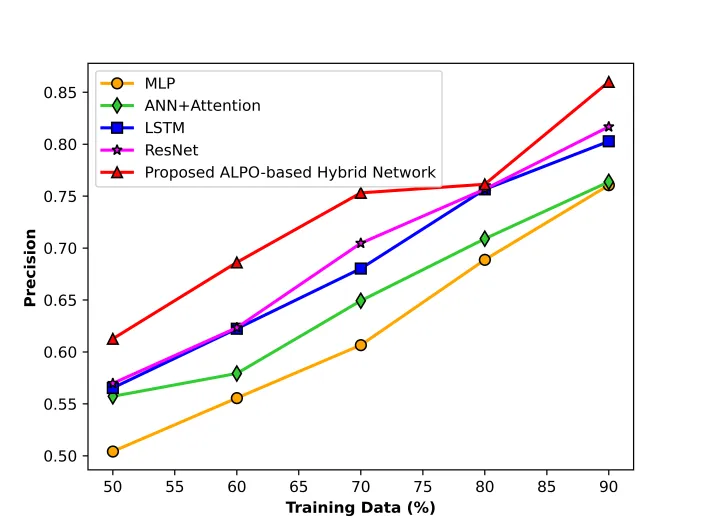
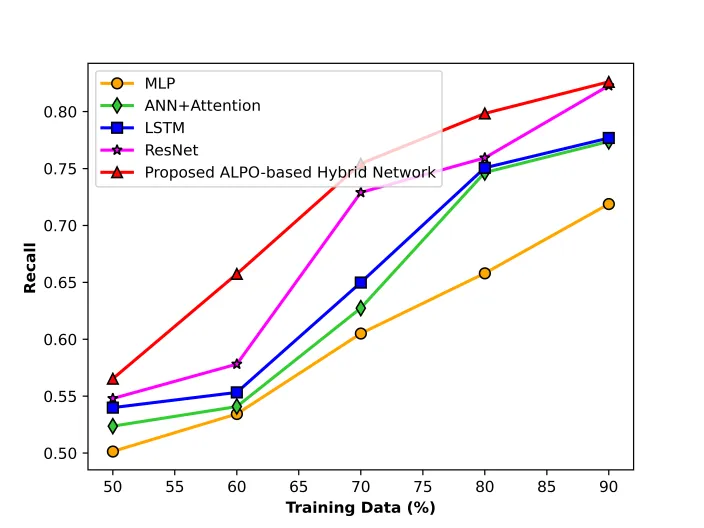
Figure 6 represents the comparative analysis of proposed ALPO-hybrid network with respect to the evaluation metrics by considering the easy type images.
The analysis of proposed scheme in terms of accuracy is illustrated in figure 6a). When the training data=90%, the accuracy obtained by the existing methods, like MLP is 77.023, ANN + Attention is 78.674, LSTM is 80.984, and ResNet is 82.856. However, the proposed ALPO-hybrid network achieved the accuracy of 87.231 that reveals the performance enhancement of proposed with that of the conventional approaches, such as, MLP is 11.7%, ANN + Attention is 9.8%, LSTM is 7.16%, and ResNet is 5.015%.
The analysis of proposed scheme in terms of precision is illustrated in figure 6b). When the training data=90%, the precision obtained by the existing methods, like MLP is 0.761, ANN + Attention is 0.764, LSTM is 0.803, and ResNet is 0.817. However, the proposed ALPO-hybrid network achieved the precision of 0.860 that reveals the performance enhancement of proposed with that of the conventional approaches, such as, MLP is 11.566%, ANN + Attention is 11.195%, LSTM is 6.661%, and ResNet is 5.027%.
Figure 6c) shows the comparative analysis of proposed scheme with respect to recall by varying the training data. If the training percentage=90%, the proposed ALPO-hybrid network attained the recall of 0.826, which shows the performance enhancement of proposed when compared with the traditional approaches, like MLP, ANN + Attention, LSTM, and ResNet is 12.988%, 6.343%, 5.976%, and 0.401%. However, the recall obtained by the existing methods, such as MLP is 0.719, ANN + Attention is 0.774, LSTM is 0.777, and ResNet is 0.823.
The comparative analysis of proposed ALPO-hybrid network by considering the F1-measure is depicted in figure 6d). By varying the training data to 90%, the traditional schemes achieved the recall of 0.766 for MLP, 0.781 for ANN + Attention, 0.804 for LSTM, and 0.821 for ResNet. However, the developed ALPO-hybrid network achieved the F1-measure of 0.866, which reveals the performance improvement of 11.559%, 9.782%, 7.075%, and 5.149%, respectively for MLP, ANN + Attention, LSTM, and ResNet.
|
|
|
|
(a) |
(b) |
|
|
|
|
(c) |
(d) |
Figure 6. Comparative analysis of proposed ALPO-hybrid network based using easy type images
a) Accuracy b) Precision c) Recall d) F1-measure
5.6.2 Analysis using hard type images
Figure 7 portrays the comparative analysis of proposed ALPO-hybrid network with respect to the evaluation metrics by considering the hard type images.
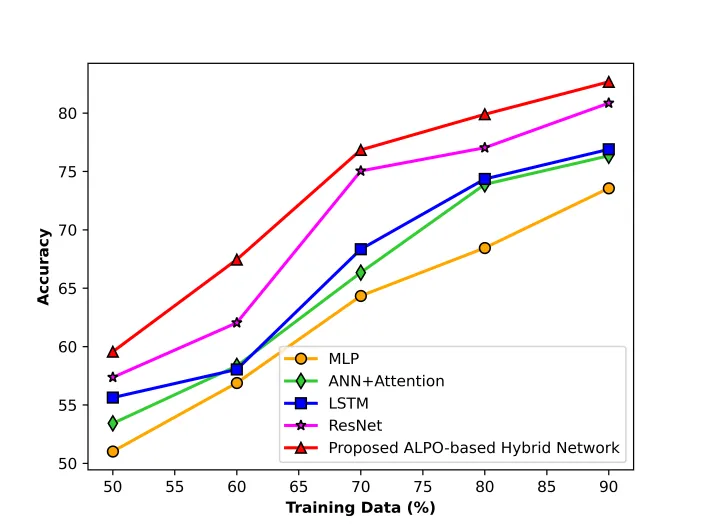
Figure 7a) represents the comparative analysis of proposed ALPO-hybrid network in terms of accuracy. If the training percentage=90%, the accuracy attained by the existing techniques, like MLP is 73.568, ANN + Attention is 76.342, LSTM is 76.894, and ResNet is 80.854, whereas the proposed ALPO-hybrid network achieved the accuracy of 82.674, which reveals the performance enhancement of developed with that of the conventional schemes, like MLP is 11.01%, ANN + Attention is 7.65%, LSTM is 7%, and ResNet is 4.100%.
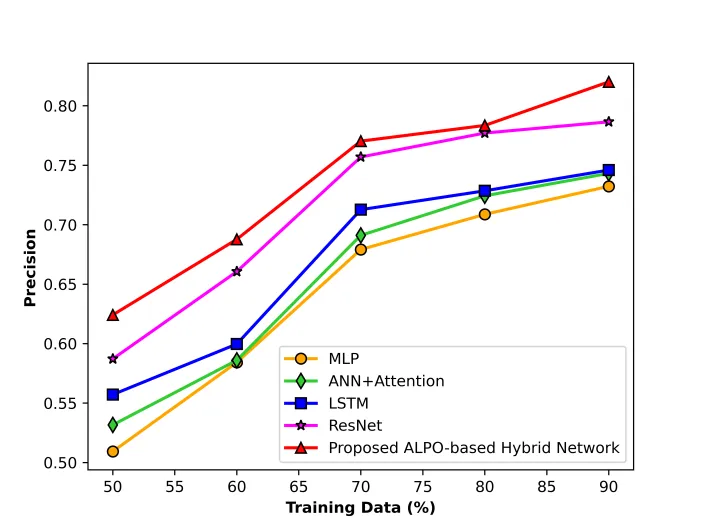
Figure 7b) represents the comparative analysis of proposed ALPO-hybrid network in terms of precision. If the training percentage=90%, the precision attained by the existing techniques, like MLP is 0.732, ANN + Attention is 0.743, LSTM is 0.746, and ResNet is 0.787, whereas the proposed ALPO-hybrid network achieved the precision of 0.820, which reveals the performance enhancement of developed with that of the conventional schemes, like MLP is 10.710%, ANN + Attention is 9.385%, LSTM is 9.044%, and ResNet is 4.100%.
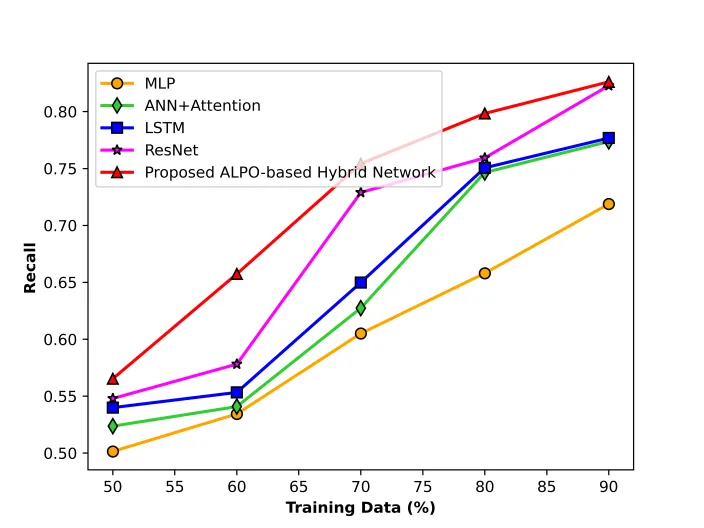
Figure 7c) depicts the comparative analysis of developed scheme with respect to recall by varying the training data. If the training data=90%, the recall obtained by the proposed ALPO-hybrid network is 0.826 that shows the performance improvement when compared with the existing techniques, such as MLP, ANN + Attention, LSTM, and ResNet is 12.988%, 6.343%, 5.976%, and 0.401%.
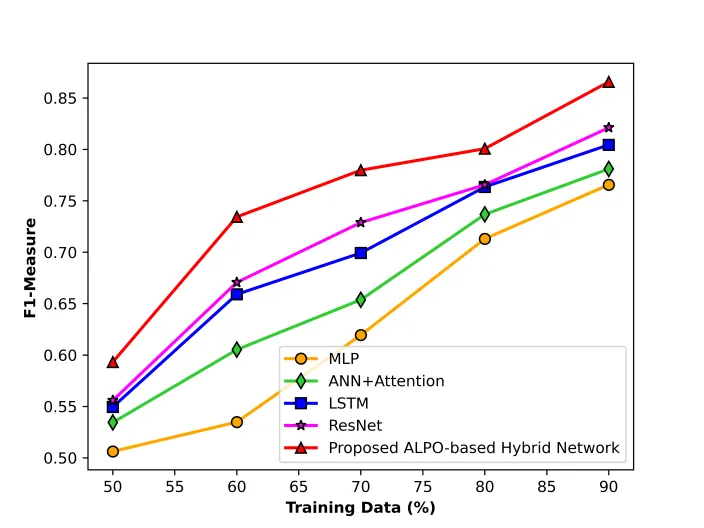
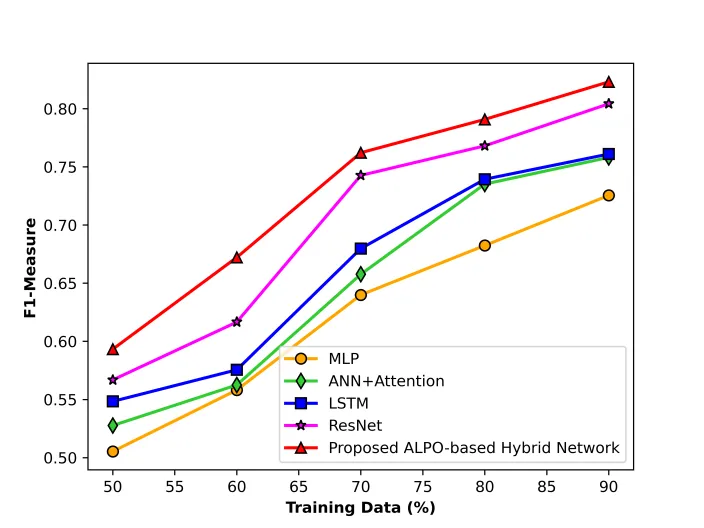
The comparative analysis of proposed ALPO-hybrid network in terms of F1-measure by varying the training data is illustrated in figure 7d). If the training data=90%, the proposed ALPO-hybrid network achieved the F1-measure of 0.823, whereas the existing methods, such as MLP, ANN + Attention, LSTM, and ResNet obtained the F1-measure of 0.726, 0.758, 0.761, and 0.804, respectively. However, the proposed ALPO-hybrid network shows the performance improvement of proposed with that of the traditional schemes, like MLP is 11.859%, ANN + Attention is 7.894%, LSTM is 7.541%, and ResNet is 2.292%.
|
|
|
|
(a) |
(b) |
|
|
|
|
(c) |
(d) |
Figure 7. Comparative analysis of proposed ALPO-hybrid network based using hard type images a) accuracy b)Precision c) Recall d) F-measure
5.7 Comparative discussion
Table 1 portrays the comparative discussion of proposed ALPO-hybrid network. By considering the easy type images, the accuracy, precision, recall, and F1-measure obtained by the proposed ALPO-hybrid network is 87.231, 0.860, 0.826, and 0.866, respectively, which is maximum when compared with the hard type images. The precision obtained by the existing methods, such as MLP is 0.732, ANN + Attention is 0.743, LSTM is 0.746, and ResNet is 0.787. However, the proposed method attained the precision of 0.820 by considering the hard type images. The proposed ALPO-hybrid network reveals the superiority of the performance when considering the easy type images.
|
Image |
Metrics |
MLP |
ANN + Attention |
LSTM |
ResNet |
Proposed ALPO-hybrid network |
|
Easy type image |
Accuracy |
77.02355 |
78.67454 |
80.98456 |
82.85675 |
87.23144 |
|
Precision |
0.761 |
0.764 |
0.803 |
0.817 |
0.860 |
|
|
Recall |
0.719 |
0.774 |
0.777 |
0.823 |
0.826 |
|
|
F1-measure |
0.766 |
0.781 |
0.804 |
0.821 |
0.866 |
|
|
Hard type image |
Accuracy |
73.56878 |
76.34216 |
76.89465 |
80.85467 |
82.6749 |
|
Precision |
0.732 |
0.743 |
0.746 |
0.787 |
0.820 |
|
|
Recall |
0.719 |
0.774 |
0.777 |
0.823 |
0.826 |
|
|
F1-measure |
0.726 |
0.758 |
0.761 |
0.804 |
0.823 |
Table 1. Comparative discussion
CONCLUSION
Recently, in many fields, such as business, academia, and industry are utilizing bar chart images to convey their information as it helps to express an individual opinions by means of analyzing the data. QA system is very effective in providing the accurate information about chart images. However, automatic extraction of data is a challenging issue in QA system. In order to address this issue, an effective strategy for QA system is introduced by developing hybrid architecture named LST-RES-NET, which is a combination of Deep LSTM and Deep ResNet. However, the Deep ResNet is trained using the proposed ALPO-hybrid network. The proposed approach consists of two phases, namely training phase, and testing phase. The bar chart and Question and Answer pair is considered as an input image in training phase, whereas the testing phase considers the bar chart image and question as an input. Finally, the results are predicted at the residual layer of Deep ResNet. Moreover, the proposed ALPO-hybrid network achieved higher performance in terms of accuracy of 87.231, precision of 0.860, maximum recall of 0.826, and maximum F1-measure of 0.866. The future dimension would be the inclusion of some other optimization algorithm in order to train the classifiers with efficient speed and also enhances the performance of the system.
REFERENCES

Neelu Verma*, LST-Resnet: Optimization-Based Hybrid Network Architecture For An Effective Question And Answering System With Bar Chart Images, Int. J. Sci. R. Tech., 2026, 3 (9), 243-265. https://doi.org/10.5281/zenodo.22674352
 10.5281/zenodo.22674352