

We use cookies to ensure our website works properly and to personalise your experience. Cookies policy
Independent Researcher, Sports Management, Bournemouth University, UK
Sports participation in childhood and adolescence builds fitness and lifelong activity habits, yet a large share of young athletes sustain an injury each season, and many of these injuries are recurrent, overuse-related or lead to early withdrawal from sport. Pre-participation movement screening, which asks an athlete to perform a short battery of standardised tasks such as squatting, lunging, balancing, hopping and landing, has become popular because it is quick, inexpensive and needs little equipment. The central claim behind it is that faulty movement patterns precede injury and can be corrected. Evidence for that claim is mixed. Tools such as the Functional Movement Screen (FMS), the Star Excursion Balance Test and Y-Balance Test, the Landing Error Scoring System (LESS) and the tuck jump assessment show acceptable reliability, but their ability to predict who will be injured is modest when a single cut-off score is applied to a single test on a single day. Three problems are especially acute in young people: rapid and uneven growth makes scores unstable, training load and sport specialisation strongly influence injury risk independently of movement quality, and injury arises from many interacting factors rather than one. This article reviews the principal screening tools and their evidence base, explains why prediction fails when screening is treated as a one-off pass or fail test, and proposes a new Maturity-Adjusted Profile Screening for Youth (MAPS-Y) framework. MAPS-Y combines four layers of information (biological maturity, movement quality, training load and injury history), interprets them as a profile that is tracked over time instead of as an isolated cut-off, and links a three-tier result (green, amber, red) to specific actions. A prospective validation protocol, designed to follow current prediction-model reporting standards, is also outlined. Screening is best regarded as a tool for guiding individualised preventive training and for monitoring athletes, not as a stand-alone injury forecast.
Organised sport is now a regular part of life for millions of children and adolescents. The health benefits are clear, but so is the cost: injuries are the most common reason young athletes leave sport, and a first injury raises the chance of another [1,2]. Prevention is therefore a public-health priority. Van Mechelen and colleagues described prevention as a four-step cycle in which the size of the problem is established, causes are identified, preventive measures are introduced and their effect is evaluated [3]. Movement screening belongs to the second and third steps: it is intended to identify athletes with modifiable risk factors so that preventive work can be directed to them.
The idea of screening fundamental movement for function was popularised in the mid-2000s, when Cook and colleagues proposed that tasks such as the deep squat and the hurdle step expose limitations in mobility, stability and motor control that are not obvious in the clinic [4]. Since then, dozens of tools have appeared (Figure 1 shows how the field is organised conceptually in the framework proposed here). Teams, schools and academies have adopted them widely, often with the expectation that a low score means a high chance of injury. Prospective studies, however, have produced results ranging from useful to no better than chance, and influential critics have argued that single screening tests cannot, in principle, sort athletes into those who will and will not be injured [5].
This review does not repeat existing meta-analyses [6,7,8]. Its aim is more practical and, we hope, more novel. First, it sets out what the main screening tools measure and what is known about their use in young athletes. Second, it explains why prediction falters, using the specific biology and training patterns of youth sport. Third, it proposes a framework, MAPS-Y, that treats screening as a repeated, multidimensional and maturity-aware process whose output is an action rather than a verdict. Finally, it describes a study design that would allow the framework to be tested properly.
Why young athletes are different
Children are not small adults. Growth cartilage at the physes and apophyses is relatively weak compared with adjacent tendon and ligament, which explains the pattern of growth-related injuries such as apophysitis and physeal stress injury [2]. During the adolescent growth spurt, limb length increases before muscle strength and neuromuscular control catch up, which temporarily alters centre-of-mass position, flexibility and coordination. Peak height velocity (PHV) is the point of fastest growth, and the years around it are widely regarded as a period of heightened vulnerability and of disrupted motor performance [9,10]. A movement score that was good at age 11 may deteriorate at age 13 without any change in training, and the reverse may occur later. This instability is rarely accounted for when a screening result is compared against a fixed adult-derived cut-off.
Training patterns add a second layer of difference. Early single-sport specialisation, high weekly hours of organised sport relative to age, and rapid week-to-week rises in load have each been associated with greater injury risk in young athletes [11,12]. Because load and movement quality both influence risk, and because load is easy to change, a screening process that ignores load will explain only part of the picture.
Advantages of movement screening
1. Quick: most batteries take 10 to 20 minutes per athlete and can be run in a school hall or on a pitch.
2. Low cost: equipment is limited to a mat, a stick or dowel, a tape measure, a box and a smartphone.
3. Scalable: trained teachers, coaches or physiotherapy students can administer several tools with brief training.
4. Educational: it gives athletes and coaches a shared language for movement quality.
5. Baseline data: repeated screens create a personal record that can be compared before and after injury, which supports return-to-sport decisions.
6. Link to action: results can be used to select exercises from neuromuscular training programmes, which are known to reduce injury in youth sport [13,14].
Types of Movement Screening Tools:
Table 1 summarises the tools most commonly used in young athletes. Each is described in turn below.
Table 1: Principal Movement Screening Tools, What They Measure and Key Considerations in Youth
| Tool | What it assesses | Typical time and equipment | Main considerations in young athletes |
|---|---|---|---|
| Functional Movement Screen (FMS) | Seven fundamental patterns scored 0 to 3 (composite 0 to 21), covering mobility, stability and motor control | About 15 min; kit with board, dowel and hurdle | Good inter-rater reliability with trained raters; prediction of injury varies between studies; adult cut-offs may not transfer to growing athletes [4,6,7] |
| Star Excursion Balance Test (SEBT) / Y-Balance Test | Dynamic single-leg balance and reach in multiple directions; asymmetry and normalised reach | About 10 min; marked floor or Y-Balance kit | Reach is normalised to leg length, which helps across ages, but leg length itself changes quickly in the growth spurt [15,16] |
| Landing Error Scoring System (LESS) | Landing mechanics from a box jump, such as knee valgus and trunk position, from video | About 5 min; box, two cameras or a smartphone | Developed for knee injury risk, particularly in female athletes; good reliability with training; useful for targeting jump-landing training [17] |
| Tuck jump assessment | Fault count during repeated tuck jumps for 10 seconds | About 5 min; video | Reflects landing technique and fatigue; high rater skill needed; limited prospective data [18] |
| Drop vertical jump with 3D or 2D analysis | Knee abduction motion and loading at landing | Laboratory or video; more demanding | Early work linked knee valgus loading to later ACL injury in female athletes [19]; cost limits mass use |
| Sport-specific and upper-limb tests | Overhead squat, shoulder mobility and closed chain upper-limb stability | 5 to 10 min | Useful in throwing and overhead sports; evidence base is smaller |
Functional Movement Screen (FMS):
The FMS comprises seven tests, including the deep squat, hurdle step, in-line lunge, shoulder mobility, active straight-leg raise, trunk stability push-up and rotary stability, plus three clearing tests that screen for pain. Each pattern is scored from 0 to 3 and the composite is out of 21. An early study in professional American football reported that a score of 14 or less was associated with serious injury in that team [20], and the cut-off was widely copied. Later systematic reviews and meta-analyses found that composite scores have limited ability to discriminate injured from uninjured athletes and that results differ greatly across populations, with low sensitivity at a commonly used cut-off [6,7,8]. Asymmetry between sides, which is scored separately, appears to carry some additional information, but studies in youth remain few.
Star Excursion Balance Test and Y-Balance Test:
The athlete stands on one leg and reaches the other foot as far as possible in set directions. In high-school basketball players, a large difference between limbs in anterior reach and a low composite reach were associated with a higher chance of lower-limb injury [15]. A review and meta-analysis later confirmed that these tests detect postural-control deficits in people with ankle instability and knee injury [16]. Their strengths are simplicity and good reliability. Their weakness is that reach distance depends on leg length, strength, flexibility and motivation, which all change during adolescence.
Landing Error Scoring System and jump-landing tools:
Landing technique is arguably the most direct window on knee-injury mechanisms. In elite youth soccer players, the LESS identified athletes with poor landing mechanics who benefited from a targeted prevention programme, and in that setting the score could be used to decide who needed the programme most [17]. Larger studies of whether a high LESS score predicts later injury have been less consistent, which again suggests that landing quality is one contributor among several.
Other approaches:
Pain provocation tests, single-leg squat and hop assessments, hip strength by hand-held dynamometry, and jump-and-landing video analysis on smartphones are used in various settings. None has been shown to be superior, and combining them has been proposed more often than it has been tested.
Why single-test prediction fails:
Bahr argued that a screening test must classify athletes accurately enough to justify withholding sport or assigning intervention, and that tests used for injury prediction rarely achieve this because the underlying risk factors are many, weak and interacting [5]. Three specific problems are worth setting out.
1. Injury is multifactorial and complex. Meeuwisse's model describes internal risk factors (such as age, prior injury, movement quality), exposure to an inciting event and the interplay among them [21]. Bittencourt and colleagues extended this by showing that injuries emerge from networks of interacting factors, so that one measured variable seldom has a stable effect on its own [22]. Single cut-offs reflect an additive way of thinking that does not fit this reality.
2. Load acts alongside, and sometimes against, movement quality. The training-injury paradox shows that appropriately high chronic training loads can protect, while rapid spikes in load increase risk [23]. A child with a perfect movement score who doubles weekly training hours in a month may be at greater risk than a child with an imperfect score and steady training.
3. Biology moves under the athlete. Maturity status alters body proportions, strength and neuromuscular control [9,10,24]. Screening scores in a 12-year-old early maturer and a 12-year-old late maturer are not comparable, and the same child may change categories within months.
A fourth, statistical, problem is that injury is a relatively uncommon event in any one team or school. Even a test with respectable sensitivity and specificity will generate many false positives when applied to a low-risk population, and a false positive in a child can mean unnecessary restriction or anxiety. These considerations argue for using screening to guide offer-of-support decisions, not to exclude athletes from play.
A new approach: the MAPS-Y framework
The Maturity-Adjusted Profile Screening for Youth (MAPS-Y) framework follows from the four problems above. It rests on five principles: (i) measure maturity and adjust for it; (ii) put movement quality in the context of training load and history; (iii) read results as a profile, not as a single score; (iv) repeat screening on a schedule tied to growth; and (v) link every result to an action. The workflow is shown in Figure 1, and the layers are detailed in Table 2.
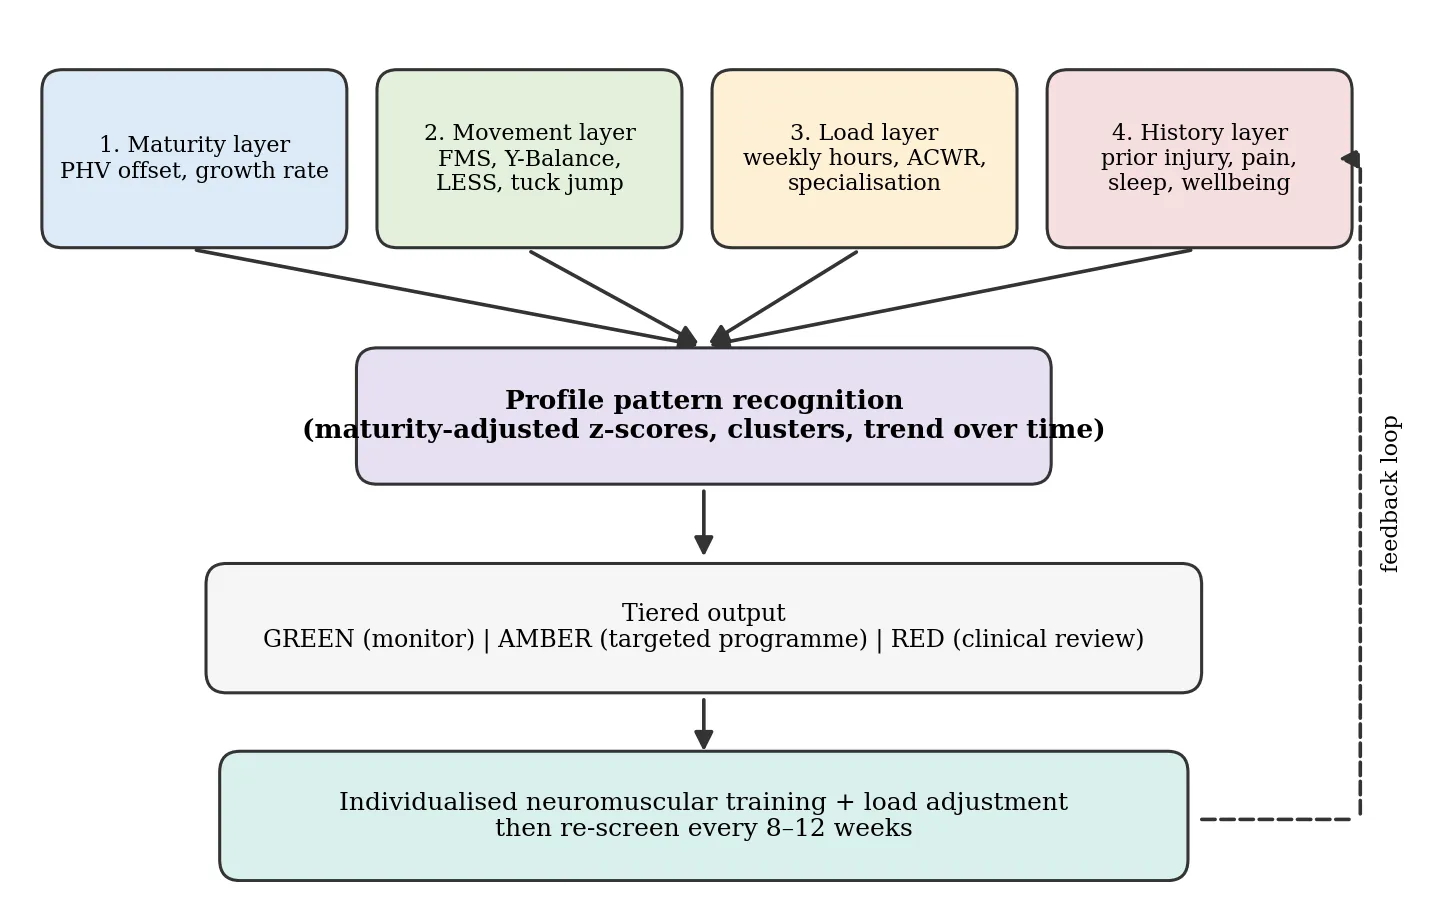
Figure 1: The MAPS-Y Workflow
Table 2: Layers of the MAPS-Y Framework
| Layer | Suggested measures | Purpose | Frequency |
|---|---|---|---|
| 1. Maturity | Standing height, sitting height, body mass and age, used in a maturity-offset equation to estimate years from PHV [24] | Adjust or stratify all other scores; define the growth phase | Every 3 months during growth spurt, otherwise every 6 months |
| 2. Movement quality | Core set of three: Y-Balance Test (lower quarter), a landing task such as LESS, and the FMS in-line lunge and deep squat patterns; add sport-specific test as needed | Capture mobility, balance and landing mechanics with limited burden | Every 8 to 12 weeks, and at the start of each season |
| 3. Load and exposure | Weekly hours of organised sport, sessional rating of perceived exertion, ratio of recent to chronic load, number of sports and months per year in one sport [11,12,23] | Detect spikes and early specialisation | Weekly, athlete or coach logged |
| 4. History and symptoms | Previous injury and time since return, current pain, sleep, school stress and wellbeing questions | Identify prior injury and early warning signs | Monthly and after any injury |
Principle 1: Maturity first.
Height, sitting height and weight are inexpensive to collect. A maturity offset can be calculated from these measures [24], although this method has acknowledged error, particularly in athletes who are very early or late maturers, and should be treated as an estimate. Athletes are grouped as pre-PHV, circa-PHV and post-PHV, and scores are interpreted against peers of the same stage rather than the same age. A practical benefit is that coaches obtain a reason for changes in an athlete's scores that is not a fault of the athlete.
Principle 2: Profile, not cut-off.
Instead of asking whether the total score falls below a number, MAPS-Y asks which pattern an athlete shows. Examples might include a landing-dominant pattern (poor landing mechanics with good balance), a mobility-dominant pattern (restricted squat and lunge with good landing), an asymmetry pattern (large between-limb differences), and a load-dominant pattern (acceptable movement but a recent spike in training load). Patterns can be found with simple rule sets in schools and, in larger programmes, with clustering or other pattern-recognition methods applied to pooled data. The benefit is that each profile suggests a different response.
Principle 3: Growth-linked re-screening.
Because scores are least stable around PHV, screening should be more frequent then. Figure 2 illustrates the idea: re-screening is more frequent in the peak-growth window and less so before and after it. The curves in Figure 2 are a schematic of the concept, not measured data.
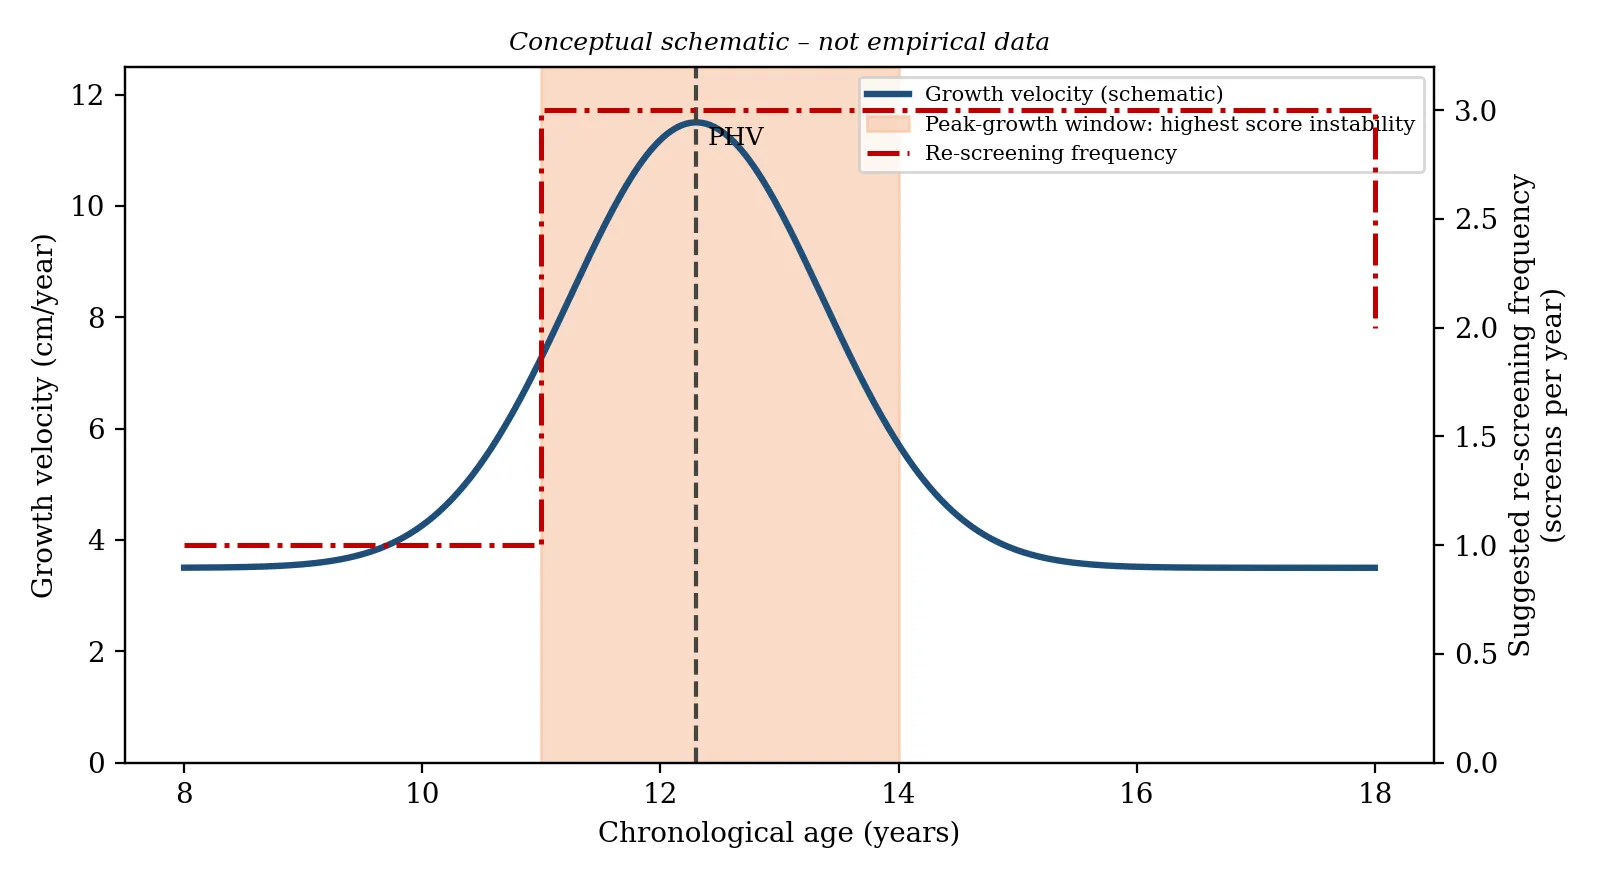
Figure 2: Conceptual Relation Between Growth, Score Instability and Re-Screening Frequency
Principle 4: Three tiers linked to action.
Each athlete is assigned to a tier based on the profile and trend, and each tier has defined steps (Table 3). The tiers are intended as triage for support, not as clearance decisions. No athlete is barred from sport on the basis of a screening result alone.
Table 3: MAPS-Y Tiers and Recommended Actions
| Tier | Typical profile | Recommended action |
|---|---|---|
| Green | No marked deficit or asymmetry for maturity stage; stable load; no current pain | Continue training; general warm-up with a neuromuscular component; re-screen on the standard schedule |
| Amber | One or more movement deficits or asymmetry, or a recent load spike, or a previous injury within the last season | Add a targeted 10 to 15 minute programme matched to the profile 2 to 3 times a week; limit week-to-week load rises; re-screen in 8 weeks |
| Red | Pain on movement or clearing tests, repeated deterioration across screens, or multiple amber features | Referral to a physician or physiotherapist for clinical assessment before further progression of load; individual plan |
The amber response draws on structured neuromuscular warm-up programmes. The FIFA 11+ programme lowered injury rates in youth football in a cluster randomised trial [13], and meta-analyses of exercise-based prevention in child and adolescent sport show that multi-component programmes reduce injuries overall [14,25]. Jump-landing training lowered knee injuries in female athletes in an earlier controlled study [26]. MAPS-Y proposes to apply such programmes where they are likely to be most useful, not to everyone equally.
Applications of the Framework:
1. Schools and community sport: physical-education teachers can run the core screen and the load log, which is particularly suited to settings with limited access to clinicians.
2. Academies and clubs: the profile and trend data inform individual training plans and help to plan the load across the season.
3. Return to sport: baseline profiles collected before injury provide a personal reference against which recovery can be judged.
4. Research: standardised data collection supports pooling across sites and the development of better prediction models.
5. Smartphone-assisted delivery: video capture and simple scoring tools can reduce cost and let low-resource programmes take part.
Proposed validation protocol:
MAPS-Y is a proposal and has not yet been tested. We suggest a multi-site prospective cohort study in school-age athletes (for example, 10 to 16 years) in team sports with a high rate of lower-limb injury. Baseline assessment would include the four layers, with follow-up screens every 8 to 12 weeks and weekly load and injury surveillance for at least one season. Injury would be defined in line with the consensus statement for football and its adaptations for other sports, recording both time-loss and substantial overuse problems [27]. The planned analysis would compare three models: a conventional model using a single test cut-off; a model that adds maturity, load and history; and the full profile-and-trend model. Discrimination, calibration and net clinical benefit would be reported, with internal validation by bootstrap resampling and, if possible, external validation in a separate site. Development and reporting would follow the TRIPOD statement for prediction models [28]. A second phase would test whether tier-linked intervention reduces injury through a cluster randomised design, since a model that predicts well but does not change outcomes has little practical value. Studies would require ethical approval, informed parental consent and child assent, and measures to avoid stigma from tier labels, such as sharing results privately and framing amber as a way to receive extra support.
Limitations and Future Directions:
Several limits should be kept in mind. MAPS-Y combines existing, individually imperfect tools, and its added value over simpler approaches is a hypothesis. Maturity-offset equations are least accurate at the extremes of timing, so alternative markers, such as skeletal-age estimates or percentage of predicted adult height, should be tested where feasible. Load logging relies on athlete and coach compliance. Finally, tier thresholds must be set and tested empirically, as we have deliberately avoided proposing numerical cut-offs that have no data behind them. Future work might explore wearable-sensor and markerless video analysis to measure movement without trained raters, apply machine-learning methods to pooled multi-site data, and examine sex-specific and sport-specific profiles.
CONCLUSION:
Movement screening is a reasonable and low-cost way to begin a conversation about injury prevention with young athletes, but the evidence does not support using any single test and cut-off to predict who will be injured. The difficulty is not that movement is unimportant but that, in growing athletes, it is one of several interacting factors that change over time. The proposed MAPS-Y framework addresses this by adjusting for maturity, combining movement, load and history, reading the result as a profile over time, and linking each tier to a specific preventive action. Whether it improves on existing practice must now be tested in prospective, adequately powered and transparently reported studies. Until then, screening should be used to individualise preventive training and to monitor athletes, not to exclude them.
ACKNOWLEDGMENTS: None
REFERENCES

Pankaj Yadav, Movement Screening for Sports Injury Risk Assessment in Young Athletes, Int. J. Sci. R. Tech., 2026, 3 (10), 819-826. https://doi.org/10.5281/zenodo.23339344
 10.5281/zenodo.23339344