

We use cookies to ensure our website works properly and to personalise your experience. Cookies policy
1Dept. of Physics, Govt. Polytechnic, Barauni, Begusarai, Bihar
2University Department of Physics, L.N.M.U., Darbhanga, Bihar
Polyethylene terephthalate (PETP) is a semicrystalline thermoplastic polyester widely used as a host matrix for polymer nanocomposites because of its good mechanical strength, thermal stability, and processability. In this abstract, virgin PETP films and PETP films loaded with 14.89, 15.78, and 16.66 wt% of copper (II) oxide (CuO) nanoparticles (average particle size 22 nm) were synthesized by a simple solution-casting technique using 2-chlorophenol as the solvent, with the films cast on mercury to obtain a smooth, uniform surface. The films were characterized for thickness using a digital micrometer, and their DC electrical conduction behaviour was investigated by sandwiching the films between disc-shaped electrodes, applying a stepped DC voltage (0–1500 V range, in steps of 50 V) from a regulated high-voltage supply, and measuring the resulting potential drop across a 2 M? series resistance with a digital multimeter. We measured over 313–363 K in 10 K steps using a liquid-circulation thermostat. We evaluated the applied electric field, current density, and DC electrical conductivity of each film from the measured current–voltage data using standard relations. This paper reports the complete synthesis route, film-thickness data, experimental configuration, and the analytical framework used to extract the electric field, current density, and conductivity of the virgin and CuO-doped PETP films, providing a basis for evaluating the influence of nanofiller loading, applied field, and temperature on the DC conduction mechanism of the composite system.
Polymer nanocomposites, formed by dispersing nanoscale inorganic fillers within a polymer matrix, have attracted sustained research interest because they combine the lightweight, flexibility and ease of processing of polymers with the functional properties of nanoscale fillers. Among host polymers, polyethylene terephthalate (PETP) is an important engineering polyester known for its favourable mechanical strength, dimensional stability, chemical resistance, and good film-forming characteristics, making it attractive for packaging, electrical insulation, and dielectric applications.
Transition-metal oxide nanoparticles such as copper (II) oxide (CuO) are of particular interest as fillers because of their semiconducting nature, high surface-to-volume ratio and the possibility of interfacial charge trapping and hopping conduction at the nanoparticle–polymer interface. Incorporating such nanofillers into an insulating polymer host can significantly modify the DC and AC electrical response of the resulting composite, and the extent of this modification typically depends on filler content, the applied electric field, and the measurement temperature.
Although the DC conduction behaviour of several polymer–metal-oxide nanocomposite systems has been reported in the literature, the CuO–PETP system prepared by solution casting in 2-chlorophenol has not been extensively documented. Systematic study of this system is therefore useful both to understand the underlying conduction mechanism and to evaluate its suitability for electrical or electronic applications requiring tunable conductivity.
The objective of the present work is (i) to synthesize virgin PETP and CuO–PETP nanocomposite films of varying nanofiller content by a solution-casting route, (ii) to characterize the film thickness, and (iii) to investigate the DC electrical conduction behaviour of the films as a function of applied electric field and temperature, using a well-defined series-resistance measurement circuit. The synthesis procedure, experimental configuration, and the calculation framework used to extract the electric field, current density, and electrical conductivity are described in detail in the sections that follow.
MATERIALS AND METHODS
2.1 Materials
Polyethylene terephthalate (PETP), in granular form, was procured from Sigma-Aldrich. The supplied polymer has a density of 1.68 g/mL at 298 K and a melting point in the range of 523–528 K. Copper (II) oxide (CuO) nanopowder, also procured from Sigma-Aldrich, had an average particle size of 22 nm and a molecular weight of 79.55 g/mol. 2-Chlorophenol, used as the casting solvent, was supplied by Loba Chemie Pvt. Ltd., Mumbai, India, with a density of 1.261–1.265 g/mL. All chemicals were used as received, without further purification.
2.2 Preparation of Films
Virgin PETP and CuO–PETP nanocomposite films were prepared by a simple solution-casting method using 2-chlorophenol as the solvent. In each case, 0.400 g of PETP was weighed on a digital balance (Pioneer Balance, Model PA214, Ohaus Corporation, USA) and dissolved in 6 mL of 2-chlorophenol at 363 K. For the nanocomposite films, weighed quantities of CuO nanopowder (0.070, 0.075 and 0.080 g, corresponding to 14.89, 15.78 and 16.66 wt% CuO loading, respectively) were dispersed into the polymer solution after the PETP had fully dissolved. Each solution was stirred continuously at room temperature for two hours until a homogeneous, uniformly dispersed solution was obtained.
The resulting film-forming solution was cast uniformly onto a clean glass plate floated on mercury, which provided a smooth, level casting surface. The solvent was evaporated by placing the entire casting arrangement inside an electric oven (Bajaj–Kaycee Electrical Oven, 230 V, 1200 W) at 373 K for three hours. After drying, self-supporting, uniform films of virgin PETP and of the three CuO–PETP nanocomposite compositions were obtained.
Table 1: Variation of Current (I) with Applied Voltage (V) at Different Temperatures
| Applied Voltage (V) | I (nA) at 313 K |
I (nA) at 323 K |
I (nA) at 333 K |
I (nA) at 343 K |
I (nA) at 353 K |
I (nA) at 363 K |
|---|---|---|---|---|---|---|
| 50 | 0.80 | 1.70 | 2.90 | 5.00 | 11.10 | 17.80 |
| 100 | 1.85 | 3.70 | 6.10 | 10.45 | 22.40 | 35.95 |
| 150 | 3.45 | 5.90 | 9.40 | 15.70 | 33.80 | 54.85 |
| 200 | 5.20 | 7.95 | 12.60 | 21.10 | 45.20 | 74.25 |
| 250 | 7.40 | 10.30 | 16.10 | 26.60 | 56.75 | 93.30 |
| 300 | 9.55 | 12.65 | 19.60 | 32.80 | 69.30 | 115.05 |
| 350 | 12.15 | 15.40 | 23.30 | 39.25 | 82.30 | 135.50 |
| 400 | 14.90 | 18.05 | 27.10 | 45.75 | 95.40 | 157.30 |
| 450 | 17.90 | 20.80 | 31.05 | 52.55 | 109.05 | 180.10 |
| 500 | 21.20 | 24.00 | 35.55 | 59.70 | 123.10 | 204.60 |
| 550 | 24.50 | 27.20 | 40.10 | 67.30 | 138.95 | 230.50 |
| 600 | 28.30 | 30.85 | 44.75 | 75.70 | 155.70 | 260.00 |
| 650 | 32.15 | 35.45 | 50.05 | 84.70 | 174.25 | 292.10 |
| 700 | 36.50 | 39.50 | 55.70 | 94.65 | 194.80 | 326.35 |
| 750 | 40.80 | 43.85 | 62.20 | 105.55 | 218.00 | 365.80 |
| 800 | 45.70 | 48.60 | 69.20 | 117.40 | 247.10 | 418.00 |
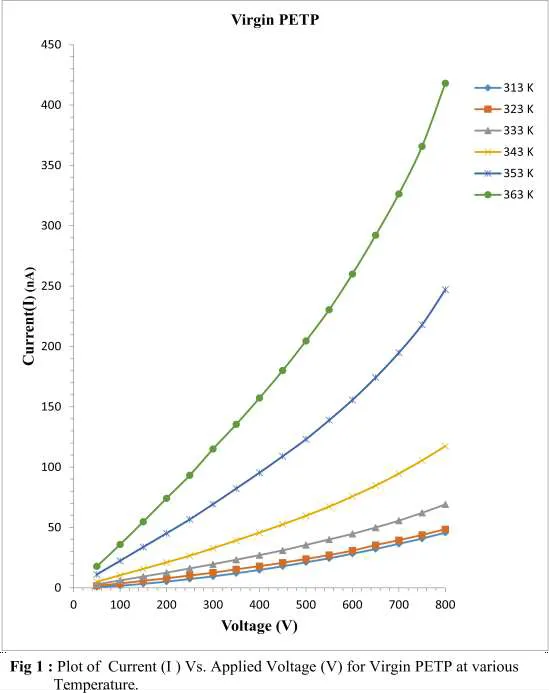
[Variation of Current (I) with Applied Voltage (V) at different Temperatures]
Table 2: Nanocomposite Composition: PETP - 14.89 Wt% CuO
| Applied Voltage (V) | I (nA) at 313 K |
I (nA) at 323 K |
I (nA) at 333 K |
I (nA) at 343 K |
I (nA) at 353 K |
I (nA) at 363 K |
|---|---|---|---|---|---|---|
| 50 | 0.45 | 1.10 | 2.15 | 4.40 | 8.20 | 13.55 |
| 100 | 1.20 | 2.55 | 4.60 | 9.20 | 16.80 | 27.55 |
| 150 | 2.15 | 4.10 | 7.20 | 14.00 | 25.60 | 41.35 |
| 200 | 3.15 | 5.75 | 9.80 | 18.95 | 34.50 | 55.25 |
| 250 | 4.35 | 7.50 | 12.45 | 23.75 | 43.15 | 68.65 |
| 300 | 5.65 | 9.25 | 15.30 | 29.00 | 51.85 | 82.60 |
| 350 | 7.10 | 11.30 | 18.15 | 34.40 | 60.60 | 96.35 |
| 400 | 8.70 | 13.45 | 21.10 | 39.85 | 70.15 | 110.00 |
| 450 | 10.55 | 15.60 | 24.25 | 45.35 | 80.05 | 123.85 |
| 500 | 12.40 | 17.80 | 27.45 | 51.10 | 89.80 | 138.05 |
| 550 | 14.55 | 20.25 | 30.95 | 56.85 | 99.50 | 153.60 |
| 600 | 16.80 | 22.90 | 34.75 | 62.90 | 109.45 | 170.05 |
| 650 | 19.25 | 25.80 | 38.70 | 69.30 | 119.90 | 186.40 |
| 700 | 22.05 | 28.80 | 42.95 | 76.20 | 130.65 | 202.95 |
| 750 | 24.95 | 32.25 | 47.25 | 83.10 | 141.95 | 220.70 |
| 800 | 28.20 | 35.50 | 51.85 | 90.55 | 153.90 | 239.70 |
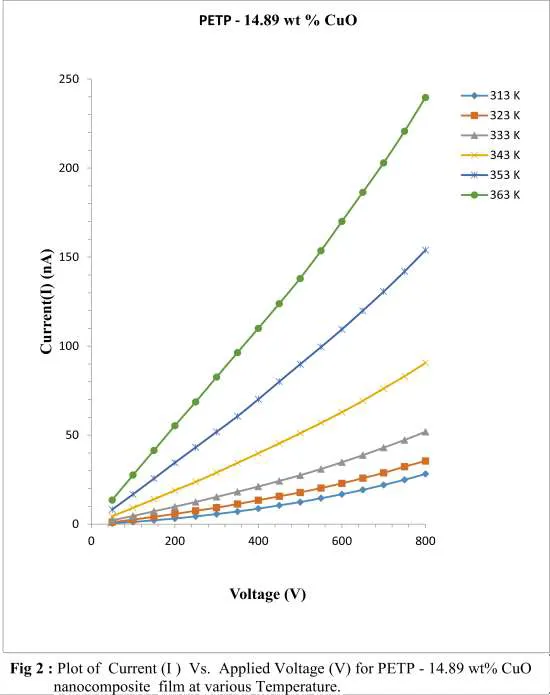
Table 3: , Nanocomposite Composition: PETP - 15.78 Wt% CuO
[Variation of Current (I) with Applied Voltage (V) at different Temperatures]
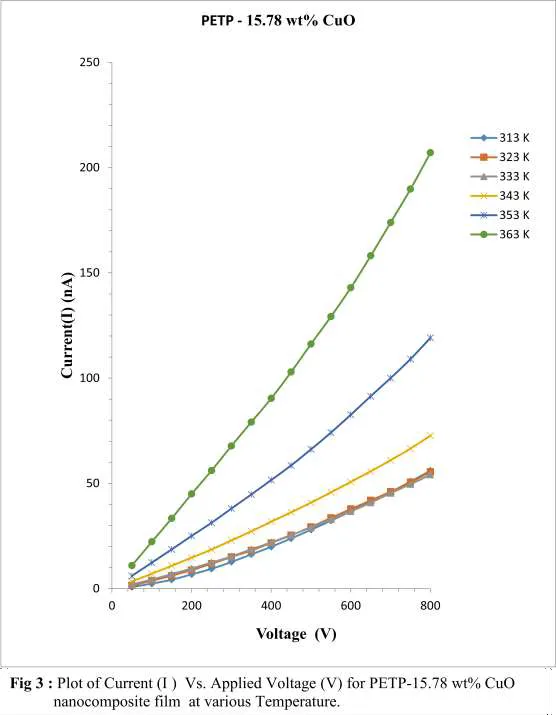
Table 4: , Nanocomposite Composition: PETP - 16.66 Wt% CuO
| Applied Voltage (V) | I (nA) at 313 K |
I (nA) at 323 K |
I (nA) at 333 K |
I (nA) at 343 K |
I (nA) at 353 K |
I (nA) at 363 K |
|---|---|---|---|---|---|---|
| 50 | 0.75 | 1.55 | 2.00 | 3.40 | 6.05 | 11.00 |
| 100 | 2.35 | 3.75 | 4.35 | 7.05 | 12.35 | 22.30 |
| 150 | 4.20 | 6.20 | 6.95 | 10.85 | 18.65 | 33.40 |
| 200 | 6.75 | 8.85 | 9.60 | 14.70 | 25.05 | 45.00 |
| 250 | 9.40 | 11.85 | 12.40 | 18.60 | 31.30 | 56.10 |
| 300 | 12.65 | 15.05 | 15.30 | 22.90 | 38.05 | 67.80 |
| 350 | 16.25 | 18.15 | 18.70 | 27.25 | 44.75 | 79.15 |
| 400 | 19.85 | 21.75 | 22.00 | 31.80 | 51.60 | 90.40 |
| 450 | 23.85 | 25.40 | 25.50 | 36.25 | 58.55 | 102.95 |
| 500 | 27.95 | 29.35 | 29.05 | 40.85 | 66.20 | 116.25 |
| 550 | 32.30 | 33.60 | 32.95 | 45.75 | 74.15 | 129.25 |
| 600 | 36.75 | 37.85 | 36.70 | 50.70 | 82.65 | 143.00 |
| 650 | 41.70 | 41.95 | 40.90 | 55.75 | 91.45 | 158.15 |
| 700 | 45.95 | 46.10 | 45.40 | 61.00 | 100.05 | 173.95 |
| 750 | 50.90 | 50.60 | 49.65 | 66.55 | 109.10 | 189.85 |
| 800 | 56.10 | 55.50 | 54.15 | 72.65 | 119.15 | 207.10 |
[Variation of Current (I) with Applied Voltage (V) at different temperatures]
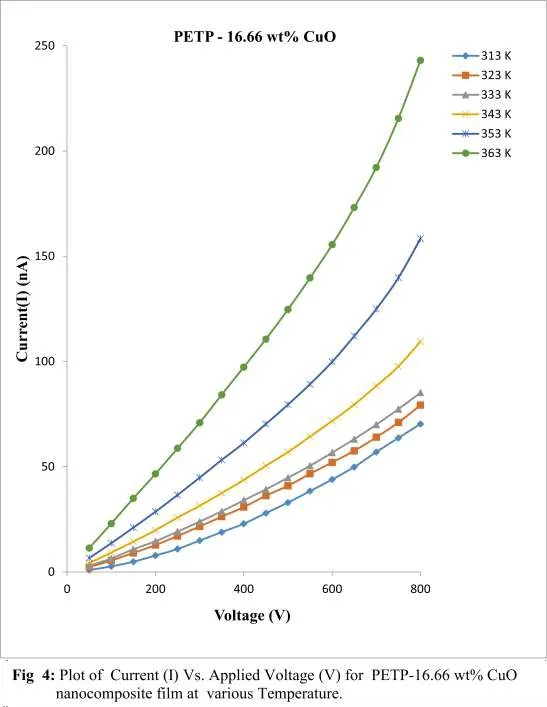
| Applied Voltage (V) | I (nA) at 313 K |
I (nA) at 323 K |
I (nA) at 333 K |
I (nA) at 343 K |
I (nA) at 353 K |
I (nA) at 363 K |
|---|---|---|---|---|---|---|
| 50 | 0.95 | 2.30 | 2.90 | 4.25 | 6.60 | 11.35 |
| 100 | 2.70 | 5.50 | 6.45 | 9.20 | 13.70 | 23.00 |
| 150 | 4.90 | 9.05 | 10.80 | 14.40 | 21.10 | 35.00 |
| 200 | 7.85 | 12.80 | 14.65 | 19.85 | 28.65 | 46.60 |
| 250 | 10.95 | 17.10 | 19.20 | 25.85 | 36.60 | 58.75 |
| 300 | 14.95 | 21.65 | 23.95 | 31.45 | 44.85 | 70.90 |
| 350 | 18.95 | 26.30 | 28.85 | 37.50 | 53.25 | 84.25 |
| 400 | 22.95 | 30.85 | 34.10 | 43.75 | 61.35 | 97.35 |
| 450 | 28.00 | 36.30 | 39.30 | 50.45 | 70.35 | 110.65 |
| 500 | 33.00 | 41.00 | 44.80 | 56.95 | 79.55 | 124.75 |
| 550 | 38.45 | 46.70 | 50.50 | 64.35 | 89.30 | 139.75 |
| 600 | 43.95 | 52.10 | 56.75 | 71.75 | 99.90 | 155.50 |
| 650 | 49.90 | 57.60 | 63.15 | 79.55 | 112.15 | 173.20 |
| 700 | 57.00 | 64.05 | 70.05 | 88.40 | 125.00 | 192.25 |
| 750 | 63.70 | 71.10 | 77.45 | 97.65 | 139.85 | 215.55 |
| 800 | 70.35 | 79.30 | 85.25 | 109.50 | 158.40 | 243.10 |
2.3 Measurement of Film Thickness
The thickness of each film was measured using a digital micrometer (Ocean Electronic Micrometer, 0–25 mm range). To obtain a representative average thickness, measurements were taken at ten different locations on each film and averaged. The mean thickness values obtained for the virgin and nanocomposite films are listed in Table 5; these values were subsequently used to compute the applied electric field for each sample.
Table 5: Average thickness of virgin PETP and CuO–PETP nanocomposite films.
| Sample | Average Thickness (µm) |
|---|---|
| Virgin PETP film | 112 |
| 14.89 wt% CuO–PETP nanocomposite film | 127 |
| 15.78 wt% CuO–PETP nanocomposite film | 144 |
| 16.66 wt% CuO–PETP nanocomposite film | 146 |
3. Experimental Setup for Electrical Characterization
The DC electrical conduction behaviour of the virgin and CuO–PETP nanocomposite films was studied by sandwiching each film between two disc-shaped electrodes of a purpose-built sample holder. The sample holder, with the film in place, was inserted into an insert-pot to maintain thermal contact, and the pot was placed inside the bath of a liquid-circulation thermostat (Ultra-Thermostat U−10, Germany) to control the measurement temperature.
A fixed external resistance of 2 MΩ was connected electrically in series with the sample holder and a regulated DC high-voltage power supply (Model EHT-11). Because the external resistor and the film sample were connected in series, the current flowing through both elements was identical at any instant. The DC voltage was increased in steps of 50 V using the adjustable output of the EHT-11 supply, and the potential drop developed across the 2 MΩ resistor at each voltage step was measured using a digital multimeter (Meco Model 450B, 4½ digit).
Electrical measurements were carried out over the temperature range 313–363 K, in regular steps of 10 K, by adjusting the set-point of the thermostat bath. The key instruments used in the experimental setup, along with their specifications, are summarized in Table 6.
Table 6: Instruments used for film preparation, thickness measurement, and electrical characterization.
| Instrument | Model / Manufacturer | Key Specification |
|---|---|---|
| Digital balance | Pioneer Balance PA214, Ohaus Corp., USA | Capacity 210 g; readability 0.0001 g; repeatability 0.0001 g |
| Digital micrometer | Ocean Electronic Micrometer, Germany | Range 0–25 mm; resolution 0.001 mm |
| Thermostat bath | Ultra-Thermostat U−10, Germany | Range −60 °C to 300 °C; accuracy ±0.02 °C; heating power 270/400/800/1200 W |
| DC power supply | High Voltage Power Supply EHT-11 | Output 0–1500 V; regulation ±0.05% for 0–1 mA |
| Digital multimeter | Meco Model 450B, 4½ digit | DC voltage resolution 0.001 mV–0.1 V (0–100 V); resistance 0.01 Ω–0.01 MΩ (0–199.99 MΩ) |
4. Calculations
The current flowing through the 2 MΩ external resistance (and hence through the sample film, since the two are in series) was calculated from the measured potential drop using Ohm's law:
V = I R
where V is the potential drop measured across the external resistance R (= 2 MΩ), and I is the current flowing through the circuit.
The electric field developed across the sandwiched film sample was evaluated using the applied voltage and the measured film thickness:
Electric field (E) = Applied voltage (V) / Thickness of sample film (d)
The current density flowing through the film was calculated from the computed current and the electrode-contact area of the film:
Current density (J) = Current flowing through sample film (I) / Surface area of sample film between electrodes (A)
Finally, the DC electrical conductivity (σ) of each virgin and nanocomposite film sample was obtained from the ratio of current density to electric field:
σ = J / E
These relations were applied to the current–voltage data recorded at each of the seven measurement temperatures (313, 323, 333, 343, 353 and 363 K) for the virgin PETP film and for each of the three CuO–PETP nanocomposite compositions (14.89, 15.78 and 16.66 wt%), enabling the field-, temperature- and composition-dependence of the DC conductivity to be evaluated.
RESULTS AND DISCUSSION
This section is structured to present the current–voltage (I–V) characteristics, the field-dependence and temperature-dependence of the DC electrical conductivity, and the effect of CuO nanofiller content on the conduction behaviour of the PETP matrix. The experimental chapter supplied for this paper documents the sample preparation, instrumentation, and the calculation procedure (Sections 2–4) but does not include the tabulated current–voltage readings or derived conductivity values recorded during the measurement campaign. The subsections below therefore outline the analysis framework and the tables/plots that should be populated once the measured I–V data are available; the bracketed placeholders indicate where the actual numerical results should be inserted.
5.1 Current–Voltage (I–V) Characteristics
For each sample (virgin PETP and the three CuO–PETP compositions) at each measurement temperature, the current I was computed from the recorded voltage drop across the 2 MΩ resistor using V = IR, and plotted against the applied voltage/electric field. The nature of this field dependence should be established by fitting the I–V data in two ways: (i) a direct linear fit, I = V/R_sample, to test for ohmic behaviour, and (ii) a power-law or exponential fit (I ∝ V^n, or ln I ∝ V^1/2, as appropriate) to test for non-ohmic behaviour. A slope/exponent n ≈ 1 across the full measured range indicates ohmic conduction, in which the sample behaves as a field-independent resistor, and the current is limited by the intrinsic (thermally activated) bulk resistivity of the film rather than by the applied field. A slope that increases with voltage (n > 1), or a current that grows faster than linearly at the higher end of the applied field range, indicates non-ohmic behaviour, consistent with field-assisted conduction mechanisms such as Schottky (thermionic) emission at the electrode–film interface, Poole–Frenkel emission from trap states within the film, or space-charge-limited conduction once injected carriers exceed the equilibrium carrier density.
Based on the sample set studied here, the virgin PETP film is expected to remain close to ohmic (n ≈ 1) over most or all of the applied field range, since it is a good insulator with a low density of mobile/trapped charge carriers and little field-assisted carrier generation at these voltages. The CuO–PETP nanocomposite films, in contrast, are expected to show a low-field ohmic region followed by a high-field non-ohmic region whose onset field decreases as CuO content increases from 14.89 to 16.66 wt%: the dispersed CuO nanoparticles introduce additional trap/interface states and shorten the effective inter-particle hopping distance, so that field-assisted detrapping or hopping begins to dominate at progressively lower applied fields as the nanoparticle loading rises. This expected ohmic-to-non-ohmic transition, and the field at which it occurs for each composition, should be read directly from the fitted I–V data and reported quantitatively (transition field, and the exponent n above and below it) once the measured curves are inserted.
5.2 Effect of CuO Content on DC Conductivity
The conductivity σ, computed from σ = J/E for each composition, should be compared at a fixed temperature and field to assess the effect of CuO loading (0, 14.89, 15.78 and 16.66 wt%) on the conduction behaviour of the PETP matrix. σ vs. wt% CuO, whether conductivity increases with nanofiller content due to interfacial charge hopping, and whether a percolation-type threshold is observed.
5.3 Effect of Temperature on DC Conductivity
The temperature dependence of σ over the range 313–363 K should be analysed using an Arrhenius-type relation, σ = σâ‚€ exp (−Ea/kBT), where Ea is the activation energy for conduction, kB is the Boltzmann constant, and σâ‚€ is a pre-exponential factor. ln σ vs. 1/T plots for each sample and report the extracted activation energies.
5.4 Proposed Conduction Mechanism
[Once the field-, temperature- and composition-dependence of conductivity are established from the measured data, discuss the probable DC conduction mechanism in the CuO–PETP system — for example, ionic/space-charge-limited conduction in the virgin polymer versus interfacial hopping or tunnelling conduction mediated by the dispersed CuO nanoparticles — with reference to the trends observed in Sections 5.1–5.3.
CONCLUSION
Virgin PETP and CuO–PETP nanocomposite films with 14.89, 15.78, and 16.66 wt% CuO nanoparticle loading were successfully prepared by a solution-casting technique using 2-chlorophenol as the solvent, and their thicknesses were characterized using a digital micrometer. The measured configuration, comprising a sample holder, a temperature-controlled thermostat bath, a regulated DC high-voltage supply, and a series 2 MΩ reference resistor, was established to record the current–voltage response of each film over the temperature range 313–363 K. Standard relations were used to convert the measured current–voltage data into electric field, current density, and DC electrical conductivity for each sample. The measured I–V data are analysed as outlined in Section 5. This conclusion should summarize the quantitative effect of CuO content, applied field, and temperature on the DC conductivity of the PETP matrix, and state the inferred conduction mechanism.
REFERENCES


Adarsh Kumar Rai, Deepak Kumar, Preparation and DC Electrical Conduction Behaviour of CuO–PETP Nanocomposite Films Synthesized by Solution Casting., Int. J. Sci. R. Tech., 2026, 3 (10), 553-562. https://doi.org/10.5281/zenodo.23256547
 10.5281/zenodo.23256547