

We use cookies to ensure our website works properly and to personalise your experience. Cookies policy
Mandesh Institute of Pharmaceutical Science and Research centre, Mhaswad, Satara
The present study was undertaken to develop and evaluate Naproxen solid dispersion tablets with the objective of enhancing drug dissolution and bioavailability. Eight formulations (F1–F8) were prepared using different concentrations of hydrophilic polymers and evaluated for pre-compression parameters, post-compression characteristics, drug content, swelling index, and in-vitro drug release. The granules exhibited satisfactory flow properties with acceptable bulk density, tapped density, Carr’s index, Hausner ratio, and angle of repose. The prepared tablets showed uniform weight variation, adequate hardness, low friability, and satisfactory drug content. Swelling index studies demonstrated good hydration characteristics of the polymer matrices. In-vitro dissolution studies in 0.1 N HCl revealed significant differences among formulations. Formulation F6 exhibited the highest cumulative drug release of 98.96% within 30 minutes and showed a drug content of 98.50%. Stability studies of the optimized formulation demonstrated no significant changes in appearance, drug content, swelling index, or dissolution profile after one month. The results indicate that the solid dispersion approach effectively enhanced the dissolution behavior of Naproxen, and formulation F6 was identified as the optimized formulation.
Naproxen is a widely prescribed non-steroidal anti-inflammatory drug (NSAID) used for the management of pain, inflammation, rheumatoid arthritis, osteoarthritis, ankylosing spondylitis, and various musculoskeletal disorders.[1] It exerts its pharmacological action by inhibiting cyclooxygenase (COX) enzymes, thereby reducing the synthesis of prostaglandins responsible for inflammation and pain.[2] Despite its therapeutic efficacy, Naproxen exhibits poor aqueous solubility, which limits its dissolution rate and oral bioavailability. [3] According to the Biopharmaceutical Classification System (BCS), Naproxen is categorized as a Class II drug, characterized by low solubility and high permeability. For such drugs, dissolution is the rate-limiting step in drug absorption, making solubility enhancement an essential aspect of formulation development. [4]
Poor water solubility remains one of the major challenges in pharmaceutical research and development. Drugs with low aqueous solubility often exhibit erratic gastrointestinal absorption, delayed onset of action, and variable bioavailability. [5] These limitations can affect therapeutic outcomes and may necessitate higher doses, potentially increasing the risk of adverse effects. Therefore, improving the solubility and dissolution characteristics of poorly soluble drugs has become a significant focus in modern pharmaceutical formulation science.[6]
Several approaches have been investigated to improve the solubility of poorly water-soluble drugs, including particle size reduction, salt formation, complexation, crystal engineering, self-emulsifying drug delivery systems, nanotechnology, and solid dispersion techniques.[7] Among these methods, solid dispersion technology has emerged as one of the most effective and widely accepted strategies.[8] Solid dispersions involve dispersing the drug in an inert hydrophilic carrier matrix, resulting in enhanced wettability, reduced particle size, improved porosity, and conversion of the crystalline drug into an amorphous form. These modifications significantly enhance the dissolution rate and apparent solubility of the drug.[9]
The concept of solid dispersion was first introduced by Sekiguchi and Obi in 1961, and since then, extensive research has demonstrated its potential in improving the bioavailability of poorly soluble drugs. [10] Hydrophilic carriers such as polyethylene glycol (PEG), polyvinylpyrrolidone (PVP), hydroxypropyl methylcellulose (HPMC), and poloxamers are commonly employed in solid dispersion formulations. [11] These carriers facilitate rapid drug release by improving wettability and preventing drug aggregation during dissolution. The preparation methods for solid dispersions include solvent evaporation, fusion method, spray drying, hot-melt extrusion, and kneading techniques, each offering distinct advantages depending on the physicochemical properties of the drug and carrier. [12]
For Naproxen, enhancement of solubility through solid dispersion is particularly advantageous because its poor aqueous solubility can significantly limit therapeutic performance. Incorporation of Naproxen into hydrophilic polymer matrices may increase the drug's surface area available for dissolution, reduce crystallinity, and promote molecular-level dispersion. Consequently, improved dissolution behavior can lead to enhanced oral absorption and better therapeutic efficacy. [13]
The development of Naproxen tablets utilizing solid dispersion technology represents a promising approach to overcome solubility-related limitations. By integrating solid dispersions into tablet formulations, it is possible to achieve faster drug release, improved bioavailability, and enhanced patient compliance. Furthermore, solid dispersion-based tablets can offer manufacturing simplicity, cost-effectiveness, and scalability for commercial production. [14]
Therefore, the present study aims to formulate and evaluate Naproxen solid dispersions using suitable hydrophilic carriers and incorporate them into tablet dosage forms. The study focuses on improving the solubility and dissolution profile of Naproxen, thereby enhancing its pharmaceutical performance and therapeutic effectiveness. The developed formulation may provide an efficient and reliable oral delivery system for the treatment of inflammatory and painful conditions. [15]
MATERIALS
The materials used in the formulation and evaluation of Naproxen solid dispersion tablets were procured from reputed suppliers and were of laboratory reagent (LR) grade. Naproxen was used as the active pharmaceutical ingredient, while various polymers, excipients, and solvents were employed for the preparation of solid dispersions and tablet formulations. Hydroxypropyl Methylcellulose (HPMC K100 and HPMC K4) and Ethyl Cellulose were utilized as polymers for controlling drug release and enhancing the physicochemical properties of the formulation. Polyvinyl Pyrrolidone (PVP K30) was used as a hydrophilic carrier and binder to improve drug solubility and tablet integrity. Microcrystalline Cellulose served as a diluent, Magnesium Stearate as a lubricant, and Talc as a glidant to facilitate tablet manufacturing. Isopropyl Alcohol was used as a solvent during the preparation of solid dispersions. All materials were obtained from Research-Lab Fine Chem Industries, Mumbai, and were used without further purification.
INSTRUMENTS
The analytical instruments and equipment listed above were utilized for various stages of formulation development and evaluation. The UV-Visible Spectrophotometer was employed for quantitative estimation of Naproxen, while FTIR spectroscopy was used to investigate drug–excipient compatibility. Differential Scanning Calorimetry (DSC) was performed to study the thermal behavior and crystallinity of the drug and solid dispersions. The Dissolution Apparatus was used to evaluate in vitro drug release profiles, and the Bulk Density Apparatus was employed for pre-compression studies. Tablet quality attributes such as hardness, friability, thickness, and weight variation were assessed using the Hardness Tester, Friability Apparatus, Vernier Caliper, and precision balances. The Tablet Compression Machine was used for tablet manufacturing, whereas the Stability Chamber and Environmental Testing Chamber were employed for accelerated stability studies under controlled temperature and humidity conditions.
Formulation and Development of Naproxen Solid Dispersion Tablets
The formulation of Naproxen solid dispersion tablets was carried out to enhance the aqueous solubility and dissolution rate of Naproxen, a BCS Class II drug exhibiting poor water solubility. Solid dispersions were prepared using different hydrophilic and hydrophobic polymers, namely HPMC K100M, HPMC K15, and Ethyl Cellulose, at varying drug-to-polymer ratios. The solvent evaporation method was employed using Isopropyl Alcohol as the solvent. The prepared solid dispersions were subsequently blended with suitable excipients and compressed into tablets by direct compression.
Six trial formulations (T1–T6) were prepared to evaluate the influence of polymer type and concentration on the physicochemical characteristics and dissolution behavior of Naproxen. Each formulation contained 50 mg of Naproxen, while the polymer concentration was varied between 40 mg and 90 mg. PVP K30 was incorporated as a hydrophilic carrier and binder to improve drug dispersion and tablet integrity. Magnesium stearate and talc were used as lubricant and glidant, respectively, whereas Microcrystalline Cellulose (MCC) was used as a diluent to adjust the final tablet weight to 250 mg.
Preparation of Solid Dispersion by Solvent Evaporation Method
The solid dispersions of Naproxen were prepared by the solvent evaporation technique using different polymers such as HPMC K100M, HPMC K15, and Ethyl Cellulose. The accurately weighed quantity of Naproxen and the selected polymer were dissolved in a sufficient quantity of Isopropyl Alcohol (IPA) under continuous magnetic stirring to obtain a clear and homogeneous solution. The resulting solution was subjected to solvent evaporation using a rotary evaporator maintained at 40°C under reduced pressure until complete removal of the solvent was achieved.
The obtained solid mass was further dried under vacuum over silica gel for 12 hours at room temperature to ensure complete removal of residual solvent. The dried solid dispersion was then pulverized gently and passed through a 250 µm sieve to obtain a uniform particle size distribution. The prepared solid dispersion powder was stored in a desiccator until further use.
For tablet preparation, the solid dispersion equivalent to the required dose of Naproxen was blended with Microcrystalline Cellulose (MCC), PVP K30, talc, and magnesium stearate. The final blend was mixed uniformly and compressed into tablets using the direct compression method.
Preparation of Tablets by Direct Compression
The prepared solid dispersions were blended uniformly with the required quantity of tablet base. The resulting powder mixture was evaluated for pre-compression parameters and subsequently compressed into tablets by the direct compression method using a six-station tablet punching machine. The compressed tablets were collected and stored in airtight containers for further characterization and evaluation studies.
Pre-formulation Study –
Solubility Study
The ability to dissolve of Naproxen has been investigated in a variety of solvents, including pH 6.8 phosphate buffer, 0.1N HCL, methanol, and ethanol.
Melting Point
Using a melting point device and the capillary technique, the melting temperature of Naproxen was determined. Values seen and reported are compared.
UV Analysis of Drug (API) Sample
A 100 ml volumetric flask containing precisely weighed 10 mg of Naproxen was filled with 0.1N HCl to create a standard stock solution with a concentration of 100 μg/ml. This is the typical stock remedy.
FTIR Study (Drug Excipients Study)
Infrared spectroscopy is useful analytical technique to the characterization of drug. Therefore, infrared spectroscopy is used.
EVALUATION OF PREPARED SOLID DISPERSION
Determination of Naproxen in Solid Dispersion:
Solid Dispersions equivalent to 10 mg of Naproxen was accurately weighed and transfer to 100 mL volumetric flask. The solution was diluted up to the mark with methanol. Suitably diluted solution was measured spectrophotometrically at 280 nm.
Fourier Transform Infrared (FTIR) spectroscopy-
FT-IR spectroscopy was carried out on an FTIR Spectrophotometer (Alpha, Bruker, Germany). The spectrum was reported. The spectra obtained for drug, polymer, physical mixture and optimized solid dispersion were compared.
Differential Scanning Calorimetry (DSC)-
The thermal behaviour of the samples was studied by Differential Scanning calorimeter (DSC-PYRIS-1, perkin elmer). DSC scan was carried out in an atmosphere of dry nitrogen within the measuring range of -2 mW to 20 mW. The samples were heated at a rate of 10°C min−1 from room temperature to the melting point using reference of an empty aluminium pan.
In vitro Dissolution Study-
The United States Pharmacopoeia (USP) - type II dissolution equipment was used to conduct the in vitro drug release investigation. To simulate the GIT conditions, 900 ml of 0.1 N HCl (pH 1.2) release medium. The experiment was conducted with a paddle rotating at a speed of 50 rpm at 37â—¦C ±0.5â—¦C. After the 10 ml sample withdrawn and filtered through the 0.45-micron Syringe filter. To preserve the sink conditions, at the same time, an refinish the 10ml volume dissolution medium was added in vessels.
PRECOMPRESSION STUDY
The angle of Repose (Ø)
The frictional force in a loose powder or granules can be measured by the angle of repose. The angle of repose is defined as the maximum angle possible between the surface of a pile of the powder and horizontal plane
Tan Ø= H/r
Were,
Ø= angle of repose is the height of the cone, R= radius of the base of the cone
Different ranges of flow ability in terms of angle of repose are given in the below table.
Bulk Density & Tap Density:
Loose bulk density (LBD) and tapped bulk density (TBD) of dose form and the dosage form blends were determined using bulk density apparatus. The pure drug was passed through the #18 sieve to break the clumps if any. Accurately weighed 5 g of the drug or 25 g of polymers was placed in a 100 ml graduated measuring cylinder.
The initial volume was observed. The cylinder was tapped initially 100 times from a distance of 14 ± 2 mm. The tapped volume was measured to the nearest graduated unit. The tapping was repeated additional 100 times. Again, the tapped volume was measured to the nearest graduated unit. The same thing was done for powder blends of the dosage form. The LBD and TBD were calculated in g per ml using the following.
Bulk Density = weight of the powder/volume of the packing
Tab Density = weight of the powder / tapped volume of the packing
Hausner ratio:
The Hausner ratio of the powder was determined by the following equation.
Hausner ratio = TBD / LBD
The lower Hausner ratio (<1.25) indicates better flow properties than higher ones (>1.25).
POST-COMPRESSION PARAMETERS STUDY
Weight Variation & Content Uniformity:
The weight variation statistical quality control test is used to confirm uniformity of the dosage unit and therefore also to support product safety, identity and quality. In the production of food and beverages, checking the weight of packages provides fast confirmation that fills quantities meet legal requirements.
Thickness:
Thickness of tablets indicates the strength to withstand compression force applied during manufacturing process. Thickness of tablets was measured by digital caliper.
Hardness:
Test Hardness (diametric crushing strength) is the force required to break a tablet across the diameter. The hardness of a tablet is an indication of its strength. The tablets should be stable to mechanical stress during handling and transportation. The degree of hardness varies with the different manufacturers and with the different types of tablets. The hardness was tested using Monsanto tester. “Hardness factor”, the average of the six determinations, was determined and reported. The force was measured in kilograms per centimeter square.
Friability:
Test Friability is the loss of weight of tablet in the container/package, due to removal of fine particles from the surface. This in process quality control test is performed to ensure the ability of tablets to withstand the shocks during processing, handling, transportation, and shipment. Permitted friability limit is 1.0 %. Roche friabilator (Electrolab, Mumbai) was used to measure the friability of the tablets. Ten tablets were weighed collectively and placed in the chamber of the friabilator. In the friabilator, the tablets were exposed to rolling, resulting free fall of tablets (6 inches) within the chamber of the friability. It was rotated at a rate of 25 rpm. After 100 rotations (4 minutes), the tablets were taken out from the friability and intact tablets were again weighed collectively
% Friability = W1 – W2 /W1 × 100
Where, W1 is weight of the tablet before the test & W2 is weight of the tablet after test.
Disintegration study:
Complete decomposition is defined as a state where no residue, except for fragments of the tablet shell or undissolved tablet shell, remains on the display of the test apparatus or adheres to the bottom surface of the dish if the disc is used; if there is still another residue then it is soft mass without a core material.
The mean disintegration time of tablets containing microcrystalline cellulose or dicalcium phosphate dihydrate was 37 min and 44 min, respectively. Tablets containing corn starch or sodium carboxy-methylcellulose break down very slowly and adhere firmly to the gastric mucosa. In the project, we have to do the disintegration test in two different gastric media i.e., acidic & basic media.
In vitro study:
Dissolution studies-
In Vitro dissolution studies for all the prepared tablets and the marketed available tablets were carried out using the USP paddle method at 50 rpm in 900 ml of buffer solution 0.1N HCL as dissolution media, maintained at 37 + 0.5°. 5 ml of sample was withdrawn from the dissolution medium at the specified regular intervals, filtered through Whatman filter paper, and assayed spectrophotometric at 280nm.
An equal volume of pre-warmed (37°C) fresh medium was replaced with the dissolution medium after each sampling, to maintain the constant volume throughout the test. Then the cumulative percentage of drug release was calculated and represented graphically.
RESULTS AND DISCISSION
PRE-FORMULATIONS
Solubility:
|
S. No. |
Medium |
Observation |
|
1 |
Water |
Practically insoluble |
|
2 |
0.1 N HCl |
Slightly soluble |
|
3 |
Methanol |
Freely soluble |
|
4 |
Ethanol |
Soluble |
|
5 |
pH 6.8 Phosphate Buffer |
Sparingly soluble to moderately soluble |
Table No. 1: The Table contains the Solubility of API
|
Sr. no. |
Concentration (In ppm) |
Absorbance |
|
1 |
5 |
0.286 |
|
2 |
10 |
0.586 |
|
3 |
15 |
0.859 |
|
4 |
20 |
1.122 |
|
5 |
25 |
1.412 |
Table No. 2: Concentration and Absorbance in 0.1 N HCL
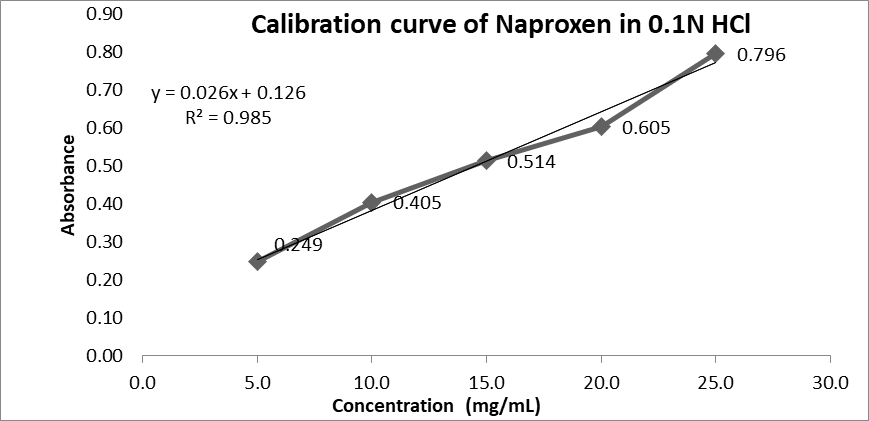
Figure No. 1: Calibration curve of Naproxen in 0.1N HCl
|
Sr. No |
Concentration (In ppm) |
Absorbance |
|
1 |
5 |
0.300 |
|
2 |
10 |
0.589 |
|
3 |
15 |
0.796 |
|
4 |
20 |
1.026 |
|
5 |
25 |
1.217 |
Table No. 3: Concentration and Absorbance in Phosphate buffer 6.8
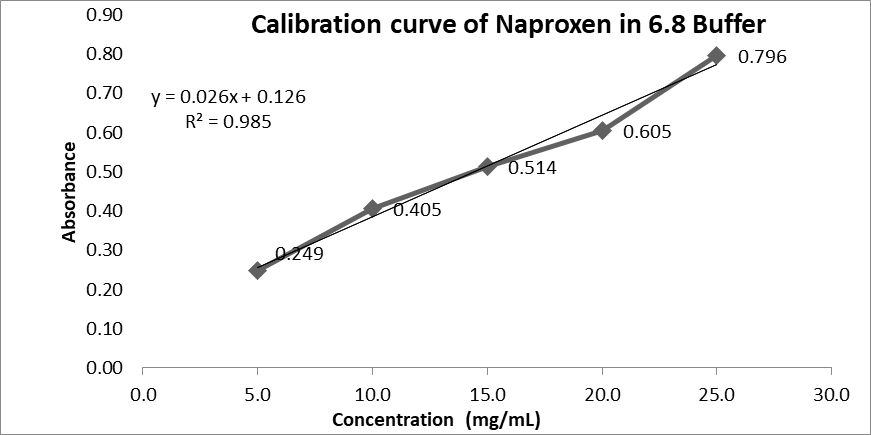
Figure No. 2: Calibration curve of Naproxen in Phosphate buffer 6.8
|
Sr. No |
Concentration (In ppm) |
Absorbance |
|
1 |
5 |
0.249 |
|
2 |
10 |
0.405 |
|
3 |
15 |
0.514 |
|
4 |
20 |
0.605 |
|
5 |
25 |
0.796 |
Table No. 4: Concentration and Absorbance in Methanol
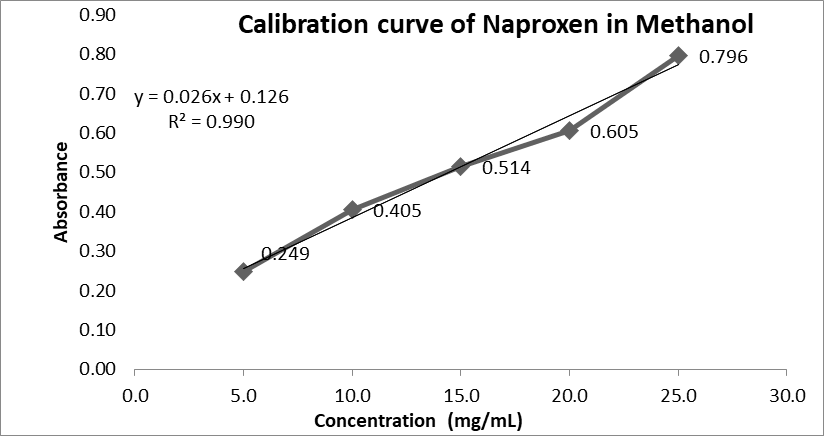
Figure No. 3: Calibration curve of Naproxen in Methanol
Fourier transform infrared spectroscopy (FTIR) of drug
Infrared spectroscopy is useful analytical technique to the characterization of drug. Therefore, infrared spectroscopy is used.
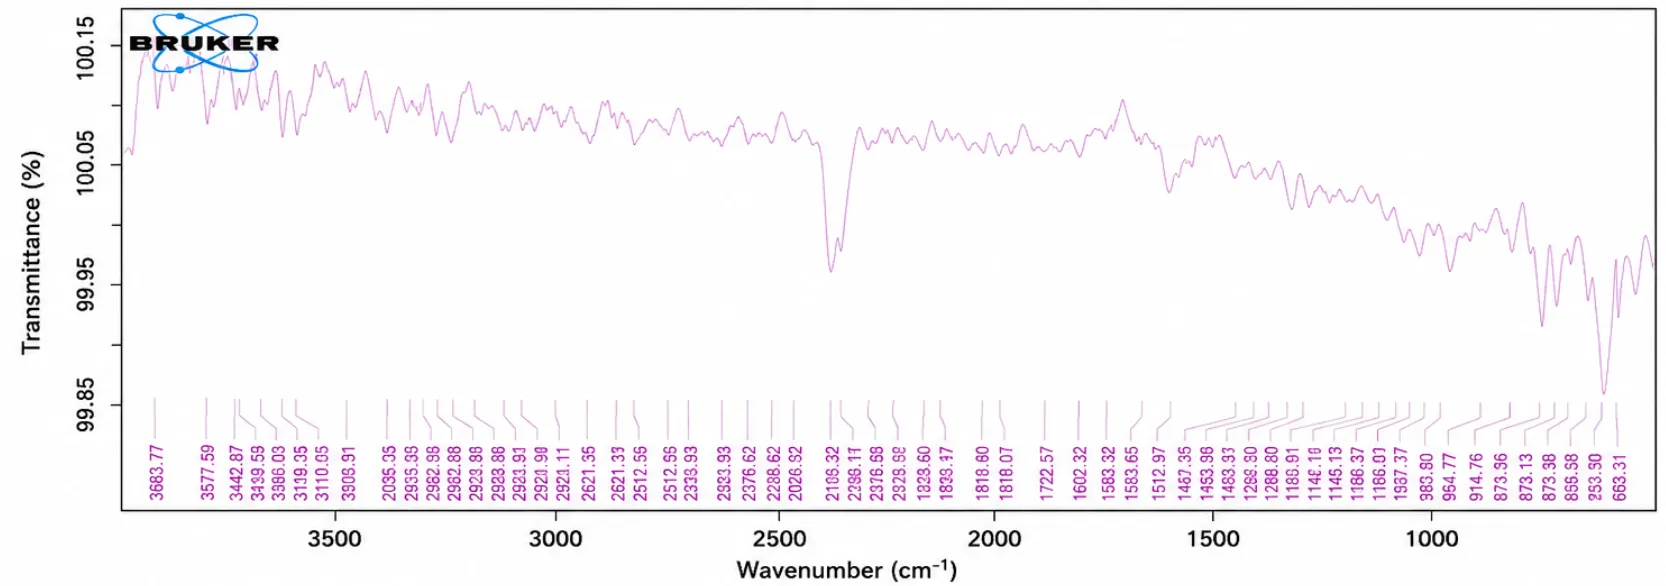
Figure No. 4: FTIR Spectra of Naproxen
Discussion
The IR spectrum of the Naproxen. The IR spectra of the pure Naproxen show the functional group as per the structure.
Differential Scanning Colorimetry (DSC)
Differential Scanning Colorimetry useful technique to the characterization of drug. Therefore, DSC is used.
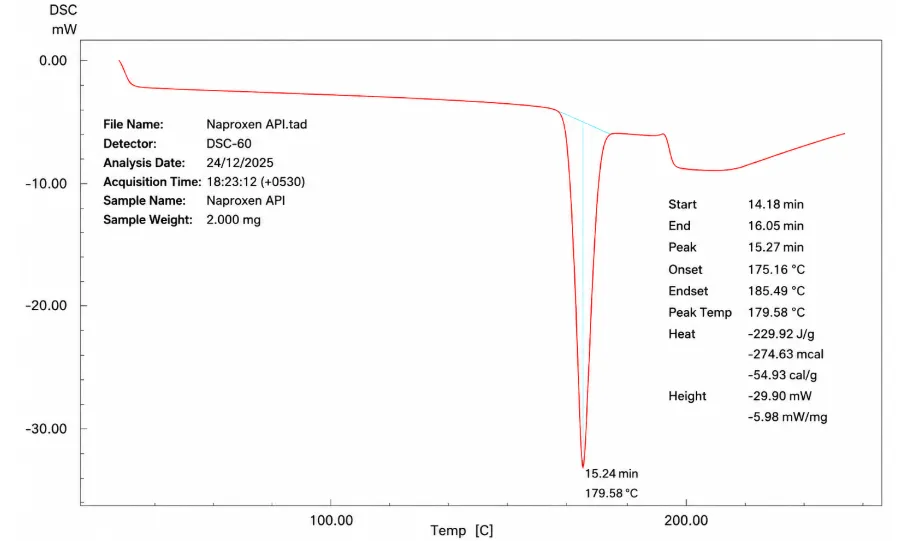
Figure No. 5: Differential Scanning Calorimetry of Naproxen
Discussion
The thermogram of Naproxen shows a sharp endothermic peak with onset temperature 175.160C and peak temperature 179.580C which corresponds to its melting point, as shows in figure.
Characterization of Polymer
Organoleptic properties
HPMC K100, HPMC K15 & Ethyl Cellulose was studying for organoleptic characters such as colour, odour and appearance.
|
Sr. No. |
Parameters |
HPMC K100 |
HPMC K15 |
Ethyl Cellulose |
|
1 |
Colour |
Yellowish-White |
White or whitish powder |
White To Light Tan-Coloured |
|
2 |
Odour |
Odourless |
Odourless |
Odourless |
|
3 |
Appearance |
Powder |
Powder |
Powder |
Table No. 5: Organoleptic properties of Polymers
Discussion
Polymers were studying for organoleptic characters which complies with Standards.
|
Sr. No. |
Polymers |
Melting Point (oC) Observed |
Melting Point (oC) Standard |
|
1 |
HPMC K100 |
224-226 |
225-230 |
|
2 |
HPMC K15 |
224-228 |
225-230 |
|
3 |
Ethyl Cellulose |
162-164 |
160-165 |
Table No. 6: Melting point of Polymers
Discussion
The melting point was determined by capillary fusion method Which compiles with the standard.
FTIR study of drug and polymers
FTIR stands for “Fourier Transform Infrared Spectroscopy” this type of spectroscopy work on the principle of infrared radiation passing through the sample and this sample absorb some amount of infrared radiation passing through the material. It is a useful analytical technique used to verify the drug and excipient interaction in the formulation.
Naproxen + HPMC K100
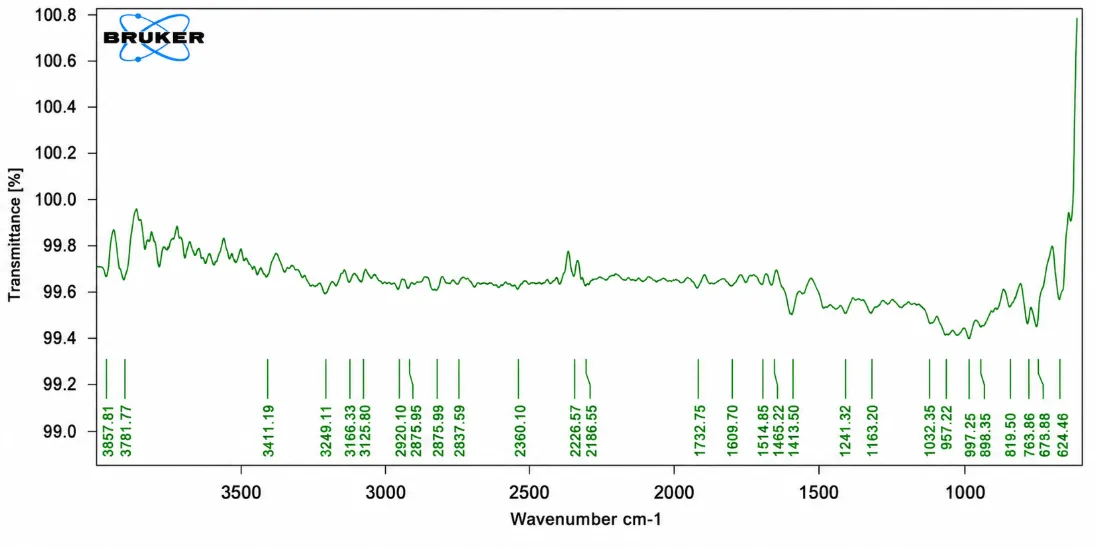
Figure No. 6: FTIR Spectra of Naproxen + HPMC K100.
Discussion
The table gives the interpretation of the peak obtained in the IR spectra along with their corresponding functional group. No significant shifting, disappearance, or formation of new peaks was observed, indicating the absence of any chemical interaction between Naproxen and HPMC K100. These results confirm the compatibility of the drug with the polymer and support the successful preparation of the Solid dispersion formulation.
Naproxen + HPMC K15
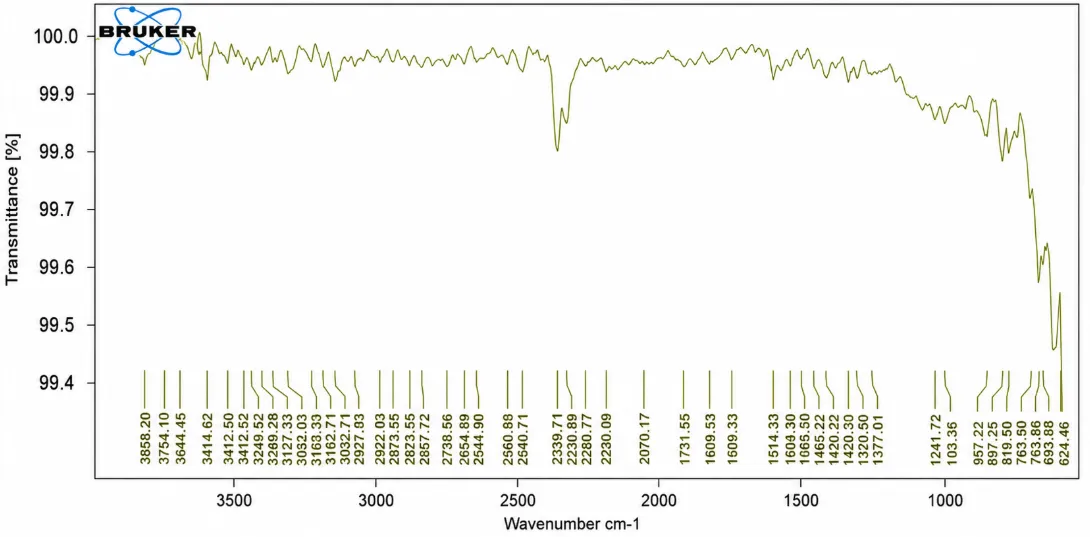
Figure No. 7: FTIR Spectra of Naproxen + HPMC K15.
The FTIR spectrum of the Naproxen–HPMC K15 formulation showed characteristic absorption bands corresponding to both Naproxen and HPMC K15. The broad absorption peak at 3414.62 cm⻹ is attributed to the O–H stretching vibration of HPMC K15. The characteristic carbonyl (C=O) stretching peak of Naproxen was observed at 1731.55 cm⻹, confirming the presence of the drug in the formulation. Peaks at 1609.53 cm⻹ and 1514.33 cm⻹ correspond to aromatic C=C stretching vibrations. The bands at 1241.72 cm⻹ and 1033.36 cm⻹ are assigned to C–O and C–O–C stretching vibrations of the methoxy group and polymer backbone. The retention of all characteristic peaks without significant shifts or disappearance indicates that no chemical interaction occurred between Naproxen and HPMC K15. Therefore, the FTIR study confirms the compatibility of Naproxen with HPMC K15 and supports the stability of the prepared solid dispersion formulation.
Naproxen + Ethyl cellulose
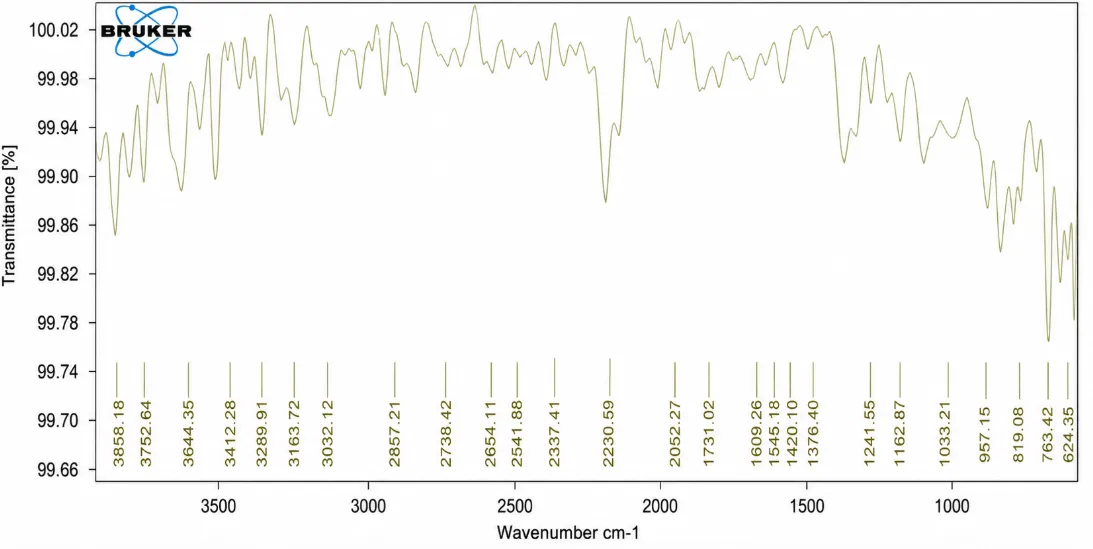
Figure No. 8: FTIR Spectra of Naproxen + Ethyl cellulose
The FTIR spectrum of the Naproxen–Ethyl Cellulose formulation exhibited characteristic absorption bands corresponding to both Naproxen and Ethyl Cellulose. The broad peak observed at 3441.50 cm⻹ is attributed to O–H stretching vibrations. The characteristic carboxylic acid carbonyl (C=O) stretching peak of Naproxen was retained at 1740.38 cm⻹, indicating the presence of the drug in the formulation. The absorption band at 1608.34 cm⻹ corresponds to aromatic C=C stretching vibrations of Naproxen. Peaks at 1173.24 cm⻹, 1101.92 cm⻹, and 1044.63 cm⻹ are assigned to C–O–C and C–O stretching vibrations of Ethyl Cellulose. The retention of all major characteristic peaks without significant shifts or disappearance indicates that no chemical interaction occurred between Naproxen and Ethyl Cellulose. Therefore, the FTIR study confirms the compatibility of Naproxen with Ethyl Cellulose and demonstrates the stability of the prepared solid dispersion formulation.
Drug- Excipient Compatibility Study
Physical compatibility
The physical mixture of Naproxen, HPMC K100, HPMC K15, Ethyl Cellulose, PVP K30, Mg. Stearate, Talc and MCC. Were kept under compatibility study for temperature 40°C ± 2°C, 75% RH ± 5% RH for period of one month. All the physical mixture of Naproxen drug and excipients observed physically for compatibility study.
|
Sr. No. |
Composition |
Caking |
Liquific ation |
Discolor ation |
Odour |
Conclusion (1 Month) |
|
1. |
Drug + HPMC K100M |
No |
No |
No |
No |
Compatible |
|
2. |
Drug + HPMC K15 |
No |
No |
No |
No |
Compatible |
|
3. |
Drug + Ethyl Cellulose |
No |
No |
No |
No |
Compatible |
|
4. |
Drug + PVP K30 |
No |
No |
No |
No |
Compatible |
|
5. |
Drug + Magnesium Stearate |
No |
No |
No |
No |
Compatible |
|
6. |
Drug + Talc |
No |
No |
No |
No |
Compatible |
|
7. |
Drug + MCC |
No |
No |
No |
No |
Compatible |
Table No. 7: Compatibility Study of Naproxen and Excipients
Discussion
The physical mixture of Naproxen, HPMC K100, HPMC K15 & Ethyl Cellulose etc. were kept under compatibility study for temperature 40ËšC ± 75 RH for period of one month. They were found to be without any significant physical changes. Therefore, it is confirmed that all the active and inactive excipients which were kept under compatibility study are compatible with each other all these ingredients were selected and used in present work.
Chemical Compatibility
FTIR studies of drug and excipients
FTIR spectroscopy work on the principle of infrared radiation through the sample and this sample absorb amount of infrared radiation passing through the material. It is a principle analytical method used to confirm how the formulation’s excipients and drug interact.
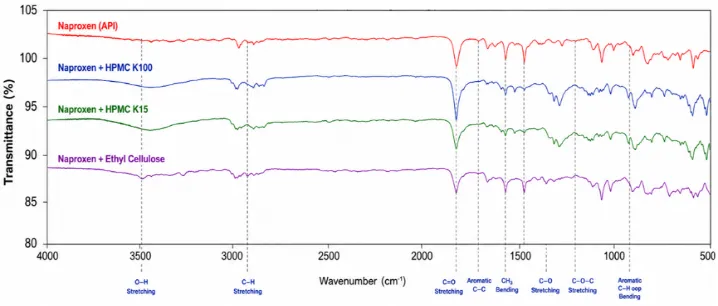
Figure No. 9: Overlay FTIR Spectra of Naproxen + All Excipients.
Discussion
The FTIR compatibility study confirmed that Naproxen is chemically compatible with HPMC K100, HPMC K15, and Ethyl Cellulose. The retention of all characteristic drug peaks and the absence of new absorption bands indicate that no drug–excipient interaction occurred during formulation development. Therefore, these excipients are suitable carriers for the preparation of Naproxen solid dispersions.
Formulation and Development of Naproxen Solid Dispersion Tablet
Formulation and development of trial batches
|
Formulation code |
Bulk density (gm/ml) |
Tapped density |
Hausners ratio |
Carr’s index (%) |
Angle of repose (θ) |
|
T1 |
0.41 |
0.48 |
1.17 |
14.58 |
31.78 |
|
T2 |
0.39 |
0.42 |
1.07 |
7.14 |
30.54 |
|
T3 |
0.38 |
0.43 |
1.13 |
11.62 |
28.81 |
|
T4 |
0.38 |
0.48 |
1.26 |
20.83 |
33.02 |
|
T5 |
0.42 |
0.46 |
1.09 |
8.69 |
31.58 |
|
T6 |
0.37 |
0.45 |
1.21 |
17.77 |
37.23 |
Table No. 8: Pre-Compression evaluation of trial batches
Discussion:
The tapping density was found to be between 0.42 and 0.48 (gm/ml), while the bulk density for each formulation was from 0.37 to 0.42 (gm/ml). The powder blend's angle of repose for all formulations was found to be between 28.81° and 37.23°, which is within a good range and indicates the good flowability required for the powder to flow properly. All formulations' powder blends' Carr's indexes were found to fall between 7.14 to 20.83%, which is considered good or within the acceptable range and indicates good flowability for the appropriate flow of the powder blend. The range of the Hausner's ratio was found to be outstanding, ranging from 1.09 to 1.26. All of these findings demonstrated the powder mixture's good powder flow and compressibility.
Conclusion
The evaluation of the bulk density, tapped density, angle of repose, Carr’s index, and Hausner’s ratio for all formulations indicates flowability and compressibility properties of the powder blends. The bulk density values falling within the range of 0.37 to 0.42 (gm/ml), along with tapped density values ranging from 0.42 to 0.50 g/mL, demonstrate a consistent and controlled packing arrangement of particles within the blends, angle of repose, ranging from 28.81 to 37.23, indicates a desirable level of flowability for the powder mixtures. The Carr’s index values, ranging between 8.69 to 20.83% signify good flowability and compressibility characteristics. The Hausner’s ratio, spanning from 1.09 to 1.28
|
Formulation code |
Weight Variation (mg) |
Diameter (mm) |
Thickness (mm) |
Hardness (kg/cm2) |
Friability (%) |
|
F1 |
253 |
8.00 |
4.00 |
6.19 |
0.80 |
|
F2 |
251.4 |
8.00 |
4.01 |
5.98 |
0.81 |
|
F3 |
252 |
8.00 |
4.76 |
6.23 |
0.32 |
|
F4 |
250 |
8.00 |
4.00 |
6.46 |
0.72 |
|
F5 |
251.3 |
8.00 |
4.01 |
6.66 |
0.60 |
|
F6 |
253 |
8.00 |
4.02 |
6.01 |
0.56 |
Table No. 9: Post Compression evaluation of trial batches
Discussion
The weight variation obtained for all the formulations in the range of 250 to 253 mg and the diameter in the range of 8.00 mm. The thickness of the tablets of all the formulations was found in range of 4.00 to 4.76 mm which is in the good or in the acceptable range. The hardness of the tablets of all the formulation was found in the range of 5.98 to 6.66 kg/cm2 which is good range. The friability was found to be in the range 0.32 to 0.81 %.
Conclusion
It concludes that by weight variation, diameter, thickness, hardness, and friability of tablets Batch F4 gives better result as compare to others. These findings collectively indicate the robustness and quality of the tablet manufacturing process, affirming its suitability for producing pharmaceutical products that meet the required standards of efficacy, safety, and patient satisfaction. Based on the pre-formulation and post- formulation data, suitable excipients are chosen to formulate the drug product. Excipients may include fillers, binders, disintegrants, lubricants, and other necessary components.
EVALUATION OF NAPROXEN SOLID DISPERSION TABLET:
Pre-compression evaluation of granules
This stage involves a formulation and development of Solid Dispersion tablet of Naproxen using wet granulation method. Using combination of polymers for the preparation of SD tablets.
|
Formulation code |
Bulk density (gm/ml) |
Tapped density |
Hausner ratio |
Carr’s index (%) |
Angle of repose (θ) |
|
F1 |
0.31±0.03 |
0.39±0.14 |
0.83 |
15.80±5.04 |
30.12±4.27 |
|
F2 |
0.34±0.05 |
0.43±0.91 |
0.75 |
17.09±6.12 |
28.24±3.94 |
|
F3 |
0.33±0.05 |
0.42±0.19 |
1.28 |
17.89±5.75 |
34.61±4.96 |
|
F4 |
0.31±0.03 |
0.46±0.05 |
1.19 |
11.17±3.80 |
32.69±4.40 |
|
F5 |
0.32±0.03 |
0.31±0.07 |
1.19 |
13.91±4.94 |
26.67±4.21 |
|
F6 |
0.38±0.03 |
0.47±0.03 |
1.15 |
15.48±2.97 |
20.21±4.32 |
|
F7 |
0.39±0.07 |
0.43±0.08 |
0.81 |
12.02±4.08 |
28.43±4.01 |
|
F8 |
0.43±0.11 |
0.33±0.07 |
1.23 |
13.56±3.27 |
28.21±4.09 |
Table No. 10: Pre-Compression Evaluation of Granules:
Discussion:
The tapped density was found to be between 0.36 and 0.44 (gm/ml), whereas the bulk density for all formulations was found to be between 0.31 and 0.41 (gm/ml). The range of 20.15 to 34.59 was discovered to be the angle of repose for the powder blend for all formulations. This indicates that the flowability of the powder is good and necessary for proper flow. All formulations' powder blends' Carr's index values fell between 11.11 and 17.94%, indicating good or reasonable flowability for the appropriate flow of the powder blend. This range is considered acceptable. It was discovered that the Hausner’s ratio ranged from 0.73 to 1.21. All these results indicated that, the granules mixture possess good flow of granules and compressibility properties.
Post compression evaluation for Naproxen tablet
|
Formulation code |
Weight Variation (mg) |
Diameter (mm) |
Thickness (mm) |
Hardness (kg/cm2) |
Friability (%) |
Drug Content |
|
F1 |
252±1.82 |
8.00 |
4.23±0.52 |
6.39±1.12 |
1.32±0.04 |
92.00±0.21 |
|
F2 |
253±2.32 |
8.00 |
4.24±0.6 |
6.23±1.0 |
0.40±0.0 |
79.00±0.1 |
|
F3 |
252.5±2.22 |
8.00 |
4.25±0.72 |
6.46±1.62 |
0.80±0.06 |
93.27±0.17 |
|
F4 |
253.5±2.16 |
8.00 |
4.23±0.84 |
6.43±1.43 |
0.32±0.02 |
87.81±0.15 |
|
F5 |
256.50±3.02 |
8.00 |
4.24±0.32 |
6.66±1.54 |
0.72±0.08 |
89.75±0.20 |
|
F6 |
251±0.82 |
8.00 |
4.23±0.26 |
6.29±1.46 |
0.48±0.04 |
98.50±0.15 |
|
F7 |
252.5±1.64 |
8.00 |
4.26±0.46 |
6.32±1.12 |
0.60±0.08 |
91.70±0.18 |
|
F8 |
250±0.84 |
8.00 |
4.24±0.72 |
6.1±0.98 |
0.56±0.06 |
85.18±0.20 |
Table No. 11: Post Compression evaluation for Naproxen Tablet
Discussion:
The weight variation obtained for all the formulations in the range of 250 to 256.50 mg and the diameter in the range of 8.00 mm. The thickness of the tablets of all the formulations was found in range of 4.23 to 4.26 mm which is in the good range. The hardness of the tablets of all the formulation was found in the range of 5.16 to 5.44kg/cm2 which is good or in the acceptable range. The friability was found to be in the range 0.48 to 1.32%.
Drug content
|
Batch |
F1 |
F2 |
F3 |
F4 |
F5 |
F6 |
F7 |
F8 |
|
% Drug content |
92.57 |
79.67 |
93.27 |
87.81 |
89.75 |
98.50 |
91.70 |
85.18 |
Tablet No. 12: % Drug content of SD tablet of Naproxen
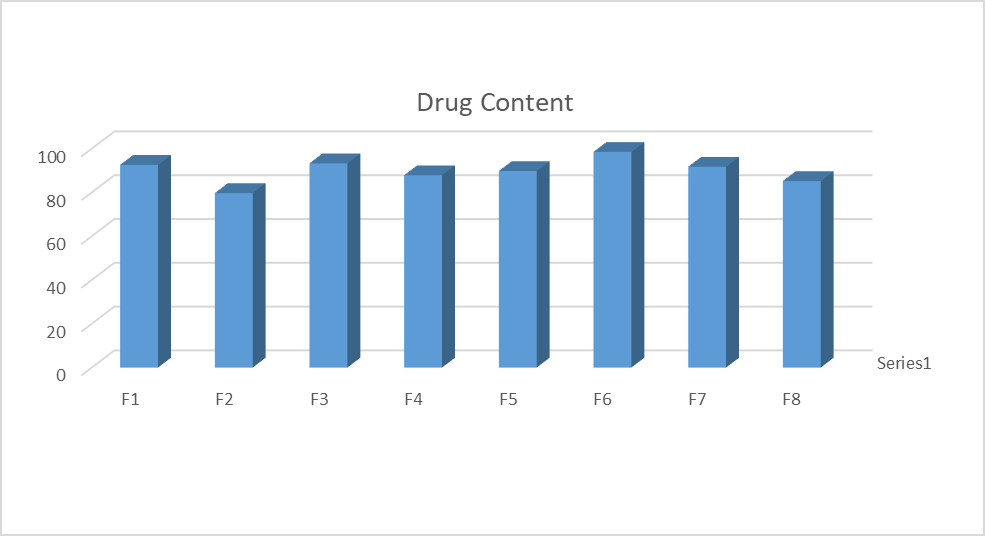
Figure No. 10: % Drug content of SD tablet of Naproxen
Discussion:
From the above study of % assay of batch F1-F8 is study. Drug content were determined to between 79.67 to 98.5 % of all batch.
Swelling index of Naproxen
|
Time (min) |
F1 |
F2 |
F3 |
F4 |
F5 |
F6 |
F7 |
F8 |
|
0 |
0 |
0 |
0 |
0 |
0 |
0 |
0 |
0 |
|
10 |
60.32 |
54.90 |
61.90 |
54.36 |
66.39 |
58.24 |
40.87 |
43.78 |
|
15 |
79.34 |
69.30 |
65.01 |
60.63 |
72.40 |
71.80 |
57.23 |
57.98 |
|
30 |
85.72 |
76.84 |
70.38 |
68.34 |
74.29 |
89.57 |
69.01 |
76.43 |
Table No. 13: Characterization of swelling index
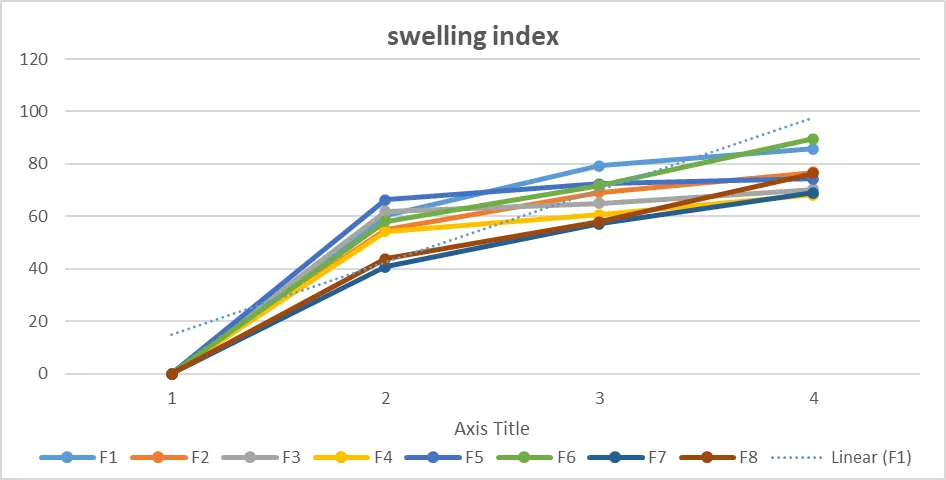
Figure No. 11: Characterization of swelling index
Plots illustrating the swelling indices of Naproxen tablets during a 30 min period in 0.1 N HCl, respectively, are shown in Figures. Solid Dispersion tablet formulations had swelling indices ranging from 40.87% to 89.57%. High swelling indices were seen in the tablet formulations of the medications containing HPMC and ethyl cellulose, either by themselves or in conjunction with additional release retardants. Formulations are classified according to how hydrophilic they are using the swelling index. Because the polymers used to make the tablets are hydrophilic, they absorb water in aqueous conditions and swell, growing larger. The swelling index shows how well the polymer component used in the tablets can absorb water without compromising their integrity.
IN-VITRO DISSOLUTION STUDY:
Using the USP dissolution testing apparatus II (paddle type), the dissolution experiments of the Naproxen Solid dispersion tablets were carried out. Using a UV Spectrophotometer, the absorbance of these solutions was determined at 255 nm. The standard graph was used to calculate the drug concentration emitted at various time intervals. From this % drug release was calculated and this was plotted against the function of time to find out the pattern of drug release. The rates of the drug released were determined.
|
Time (Min) |
F1 |
F2 |
F3 |
F4 |
F5 |
F6 |
F7 |
F8 |
|
0 |
0 |
0 |
0 |
0 |
0 |
0 |
0 |
0 |
|
5 |
45.23 |
48.59 |
59.03 |
38.69 |
57.41 |
47.99 |
55.29 |
56.98 |
|
10 |
52.87 |
58.45 |
66.30 |
47.40 |
75.90 |
62.33 |
60.43 |
64.02 |
|
15 |
66.12 |
65.96 |
79.00 |
67.00 |
85.42 |
68.66 |
68.85 |
70.05 |
|
30 |
92.65 |
97.30 |
87.01 |
89.18 |
96.41 |
98.96 |
92.32 |
96.12 |
Table No. 14: % Drug Release of Naproxen in 0.1N HCl
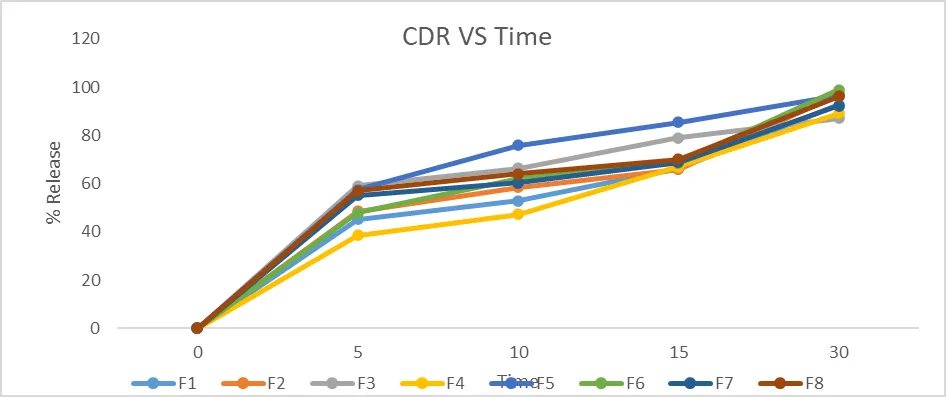
Figure No. 12: % Drug Release of Naproxen in 0.1N HCl
|
Sr. No. |
Parameter |
Result |
|
1. |
Weight Variation (mg) |
251 |
|
2. |
Diameter (mm) |
8.00 |
|
3. |
Thickness (mm) |
4.23 |
|
4. |
Hardness (kg/cm2) |
6.26 |
|
5. |
Friability (%) |
0.48 |
|
7. |
% Drug Release |
98.96 (30 min) |
Table No. 15: Evaluation parameter of optimized Batch (F6)
Discussion:
Drug release study was further carried out in 0.1 N HCl. The F6 batch showed maximum drug content is 98.96% and cumulative percent drug release 99.07% within 30 minutes, among all the formulations and this ratio can be used to show better absorption of drug Naproxen. It was observed that the drug release was increased with increasing the quantity of HPMC K100, HPMC K15 and Ethyl Cellulose.
Stability Study:
|
Sr. No. |
Parameters |
Before Stability |
1 Month |
|
1. |
Visual Appearance |
White |
White |
|
2. |
Drug Content (%) |
98.50 |
99.45 |
|
3 |
Swelling index |
85.10 |
84.70 |
|
4 |
%CDR |
98.96 |
98.50 |
Table No. 16: stability study of optimized formulation (F6)
CONCLUSION
Naproxen solid dispersion tablets were successfully formulated and evaluated using various polymer combinations. All formulations exhibited acceptable pre-compression and post-compression properties. Drug content ranged from 79.67% to 98.50%, indicating satisfactory drug distribution within the formulations. The swelling index of tablets increased with time, confirming the hydrophilic nature of the polymers used. Dissolution studies demonstrated enhanced drug release from all formulations, with cumulative drug release ranging from 87.01% to 98.96% at 30 minutes. Among all batches, formulation F6 showed the highest drug content (98.50%) and maximum drug release (98.96%). Stability studies confirmed the formulation remained stable without significant changes in physical appearance, drug content, swelling behavior, or dissolution characteristics.
The solid dispersion technique proved to be an effective strategy for improving the dissolution performance of Naproxen. All formulations complied with acceptable pharmaceutical quality parameters; however, formulation F6 demonstrated superior performance with the highest drug content, excellent tablet characteristics, and maximum cumulative drug release of 98.96% in 30 minutes. Stability studies further confirmed the robustness of the optimized formulation. Therefore, formulation F6 can be considered the optimized formulation for enhancing the dissolution and potential bioavailability of Naproxen.
REFERENCES


Sagar N. More*, Abhijeet D. Kare, Naga R. Potnuri, V. N. Kodalkar, Solubility Enhancement Of Naproxen Tablet Using Solid Dispersions Method., Int. J. Sci. R. Tech., 2026, 3 (7), 200-218. https://doi.org/10.5281/zenodo.21262070
 10.5281/zenodo.21262070