

We use cookies to ensure our website works properly and to personalise your experience. Cookies policy
1Department of Electrical Engineering LNCT University, J.K. Town, Kolar Road, Bhopal - 462042, Madhya Pradesh, India
2Department of Electrical Engineering, School of Computer Science and Technology LNCT University, J.K. Town, Kolar Road, Bhopal - 462042, Madhya Pradesh, India
This paper presents a techno-economic and environmental case study of a proposed grid-connected solar photovoltaic (PV) intervention for two municipal sewage treatment plants (STPs) operated by Nagar Nigam Jabalpur, Madhya Pradesh, India. The source Detailed Project Report (DPR) proposes a 1039 kW PV plant at Kathonda STP (32 MLD) and a 198.83 kW PV plant at Lalpur STP (34 MLD), for a combined capacity of 1237.83 kW. The DPR reports combined electricity consumption of approximately 1.50 lakh kWh/month, or about 18 lakh kWh/year, and projected PV generation of approximately 18.07 lakh kWh/year. Based on the DPR tariff of ?12.5/kWh, the gross annual electricity-offset value is approximately ?225.88 lakh/year. The total project cost, including associated civil/vehicle-washing shading infrastructure, is ?723.00 lakh. Derived performance indicators are a specific yield of approximately 1459.6 kWh/kWp-year and an implied capacity utilization factor of approximately 16.66%. The study develops an IEEE-style analytical framework covering energy balance, PV sizing, cost allocation, simple payback, carbon accounting, and post-commissioning measurement and verification. Comparison with recent literature shows that PV integration can reduce grid dependence and improve the sustainability of energy-intensive wastewater treatment, but annual energy equivalence should not be interpreted as real-time energy independence. The DPR also contains internal numerical inconsistencies in financial and performance statements; these are explicitly identified rather than reconciled by assumption. The paper therefore provides a research-ready baseline for subsequent measured-performance evaluation of the Jabalpur STP solar installations.
Municipal wastewater treatment is essential public infrastructure but is also electricity intensive because of aeration, pumping, sludge handling, control systems and auxiliary loads. Recent studies have demonstrated that wastewater utilities can reduce grid dependence by combining energy-efficiency measures with photovoltaic generation, biogas recovery and other renewable resources [1]–[8]. PV deployment at wastewater treatment plants is particularly attractive where treatment loads are continuous and suitable roof, ground or parking-shade areas are available [1], [3], [4].
The Jabalpur case considered in this paper is based on the municipal DPR prepared under the Jal Hi Amrut initiative of AMRUT 2.0. The DPR proposes grid-connected PV systems at Kathonda and Lalpur STPs and identifies the intervention as an energy-efficiency and climate-action measure. The purpose of this paper is not to redesign the DPR, but to convert its project information into a research framework and to derive transparent indicators that can subsequently be validated using operational data.
II. LITERATURE REVIEW
Research on renewable-energy integration in WWTPs has progressed from plant-level energy benchmarking to integrated techno-economic optimization. He et al. analyzed 1184 Chinese WWTPs and demonstrated the importance of treatment scale, process selection and operating conditions in determining energy use [9]. Borzooei et al. developed an integrated optimization approach linking treatment-process operation with energy and environmental performance [10]. Strazzabosco et al. reviewed PV adoption across 105 Californian WWTPs and found that PV deployment is strongly influenced by plant scale and site characteristics [1]. Colacicco and Zacchei proposed analytical methods for sizing PV to increase self-consumption by aeration systems [3].
Bey et al. evaluated grid-connected PV for a WWTP in Algeria using energy balance, available area and levelized cost of energy, illustrating that PV can materially offset treatment electricity requirements [4]. Campana et al. investigated high-renewable-share WWTP configurations through dynamic modelling and optimization, with PV becoming a major contributor to the optimized renewable mix [5]. Chen and Zhou evaluated 31 large WWTP-PV projects in China and reported both economic feasibility and substantial potential for carbon-emission reduction [6]. More recent studies have expanded the analysis toward low-carbon scheduling, renewable-energy integration and energy-efficiency optimization [7], [11]–[15].
The recent literature also provides an important caution for the present case: annual energy balance alone does not describe hourly self-consumption. PV generation, treatment load, tariff structure, grid export rules and operational flexibility must be evaluated together. García-López et al. showed the importance of PV self-consumption in determining water-service energy costs [2], while Alrbai et al. and Milani and Nabi Bidhendi demonstrated broader renewable integration pathways for WWTP energy and carbon management [7], [8].
III. CASE STUDY AND SOURCE DATA
The source DPR identifies Lalpur STP as a 34 MLD facility and Kathonda STP as a 32 MLD facility. Both plants use Sequential Batch Reactor (SBR) technology and operate continuously throughout the year. The reported monthly electricity consumption is approximately 65,000–70,000 kWh at Kathonda and 75,000–80,000 kWh at Lalpur. The combined consumption is reported as approximately 1.50 lakh kWh/month, or about 18 lakh kWh/year, at an electricity tariff of approximately ₹12.5/kWh [16].
|
Parameter |
Kathonda |
Lalpur |
Combined |
|
Treatment capacity |
32 MLD |
34 MLD |
66 MLD |
|
PV capacity |
1039.00 kW |
198.83 kW |
1237.83 kW |
|
Annual PV generation |
15.17 lakh kWh |
2.90 lakh kWh |
18.07 lakh kWh |
|
Reported monthly load |
65,000–70,000 kWh |
75,000–80,000 kWh |
≈150,000 kWh |
|
Grid interface |
LT, 415 V |
LT, 415 V |
Grid-tied |
Table I. Project And Energy Parameters Reported In The DPR.
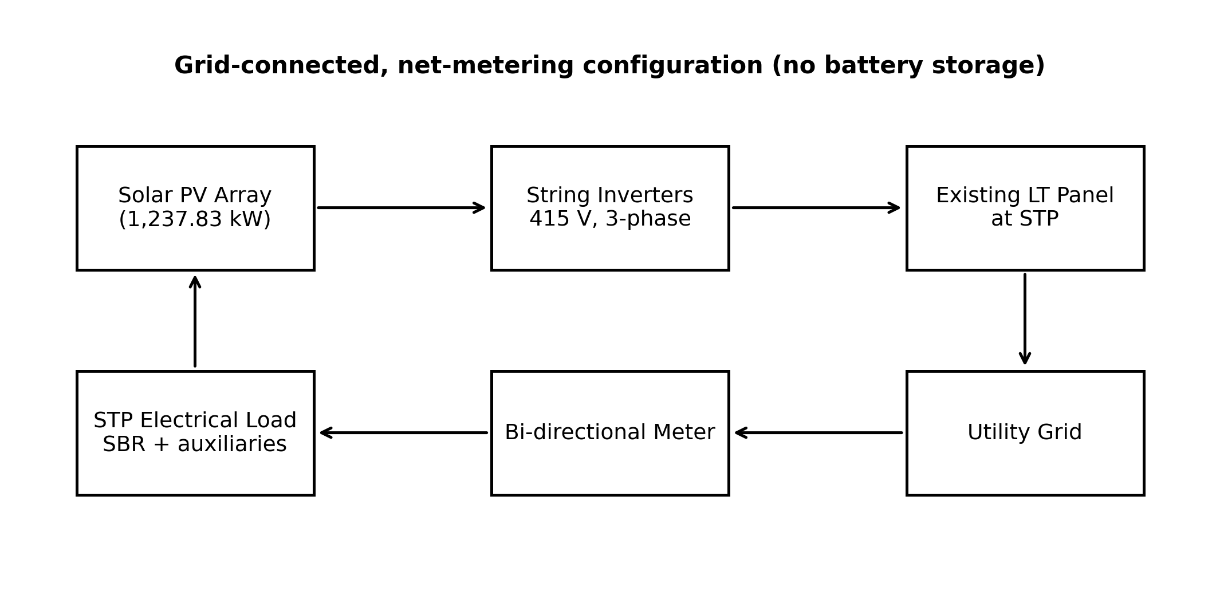
Fig. 1. Conceptual architecture of the proposed grid-connected PV system for the two STPs.
IV. PV SYSTEM CONFIGURATION
The DPR proposes a grid-connected, net-metering configuration without battery storage. The inverter output is connected to the existing LT panels, and surplus energy is intended to be exported through a bi-directional meter under the applicable state net-metering arrangement [16]. At Kathonda, the PV deployment combines rooftop, ground-mounted and vehicle-parking-shade areas. The DPR identifies approximately 79,105 ft² of total available area and an installable capacity of 1039 kW. At Lalpur, approximately 16,355 ft² of total available area is reported, with an installable capacity of 198.83 kW [16].
The technical specification calls for high-efficiency crystalline PV modules of at least 590 W, module efficiency above 22% under STC, IEC/BIS-compliant certification, RFID-based identification/traceability and long-term performance warranty provisions. The mounting structures are specified for corrosion resistance and wind speeds up to approximately 150 km/h. The inverter specification includes 415 V, three-phase, 50 Hz operation, MPPT control, THD below 3%, inverter efficiency above 95% at full load and operating capability up to approximately 55 °C [16].
V. METHODOLOGY AND EQUATIONS
The analysis uses the DPR values as source data and applies transparent secondary calculations. The following indicators are used.
Specific PV yield: Y_f = E_PV / P_PV
Capacity utilization factor: CUF = E_PV / (P_PV × 8760) × 100
Gross annual electricity value: S = E_self × C_e
Simple payback period: SPP = C_0 / S
Avoided carbon emissions: M_CO2 = E_grid,displaced × EF_grid
Levelized cost of electricity: LCOE = Σ[C_t/(1+r)^t] / Σ[E_t/(1+r)^t]
where E_PV is annual PV generation, P_PV is installed PV capacity, C_e is electricity tariff, C_0 is initial capital cost, E_grid,displaced is grid electricity displaced, EF_grid is the applicable grid-emission factor, C_t is annual cost, E_t is annual electricity generation and r is the discount rate.
Because the DPR does not provide an hourly load profile, the paper does not claim an hourly self-consumption ratio. The term 'gross annual electricity-offset value' is therefore used rather than guaranteed cash saving.
VI. RESULTS AND ANALYSIS
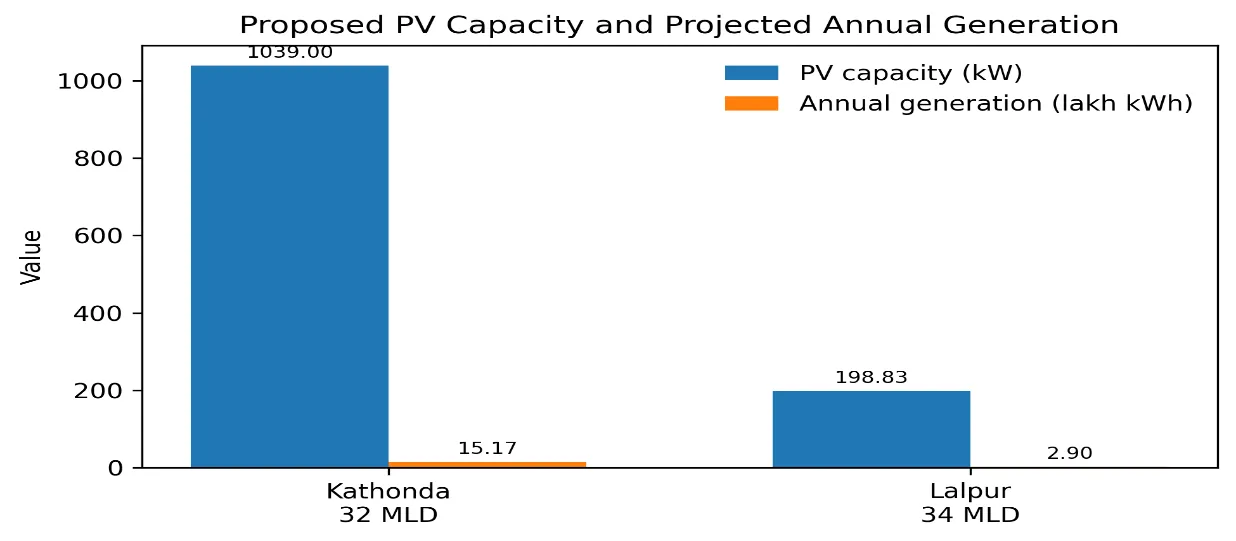
Fig. 2. Proposed PV capacity and projected annual generation at Kathonda and Lalpur.
The combined proposed PV capacity is 1237.83 kW and the projected annual generation is 18.07 lakh kWh. The corresponding specific yield is approximately 1,459.8 kWh/kWp-year. The implied CUF is approximately 16.66%. The source DPR separately specifies a minimum plant CUF of 17%; the projected generation of 18.07 lakh kWh therefore corresponds to a CUF slightly below that threshold when calculated directly from the stated installed capacity. This is a source-data consistency issue that should be checked against the final PV simulation and sanctioned capacity.
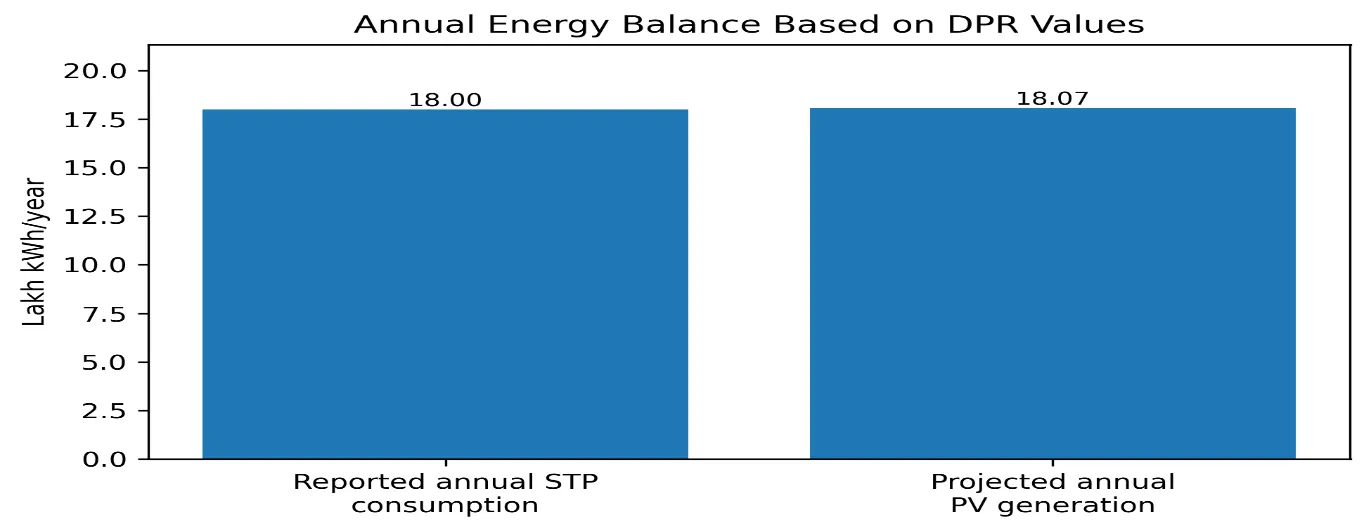
Fig. 3. Comparison of reported annual STP electricity consumption and projected annual PV generation.
The projected annual PV generation (18.07 lakh kWh) is approximately 0.39% higher than the reported annual electricity consumption (18.00 lakh kWh). This near-equivalence supports the DPR's objective of annual energy offset. However, it should not be interpreted as 100% real-time energy independence because PV output is intermittent and the STP load persists at night and during low-irradiance periods.
|
Indicator |
Derived value |
Interpretation |
|
Combined PV capacity |
1237.83 kW |
Sum of two proposed plants |
|
Annual PV generation |
18.07 lakh kWh |
DPR projection |
|
Specific yield |
1459.6 kWh/kWp-year |
Derived from DPR values |
|
Implied CUF |
16.66% |
Derived from DPR values |
|
Annual reported consumption |
18.00 lakh kWh |
DPR baseline |
|
Generation/consumption |
100.39% |
Annual energy basis only |
Table II. Derived Performance Indicators.
VII. ECONOMIC ANALYSIS
The DPR reports a total project cost of ₹723.00 lakh including the solar PV systems and associated vehicle-washing-centre shading/civil infrastructure. The solar PV components alone are reported at ₹564.27 lakh. The remaining ₹158.73 lakh is associated with the additional civil/shading infrastructure [16].
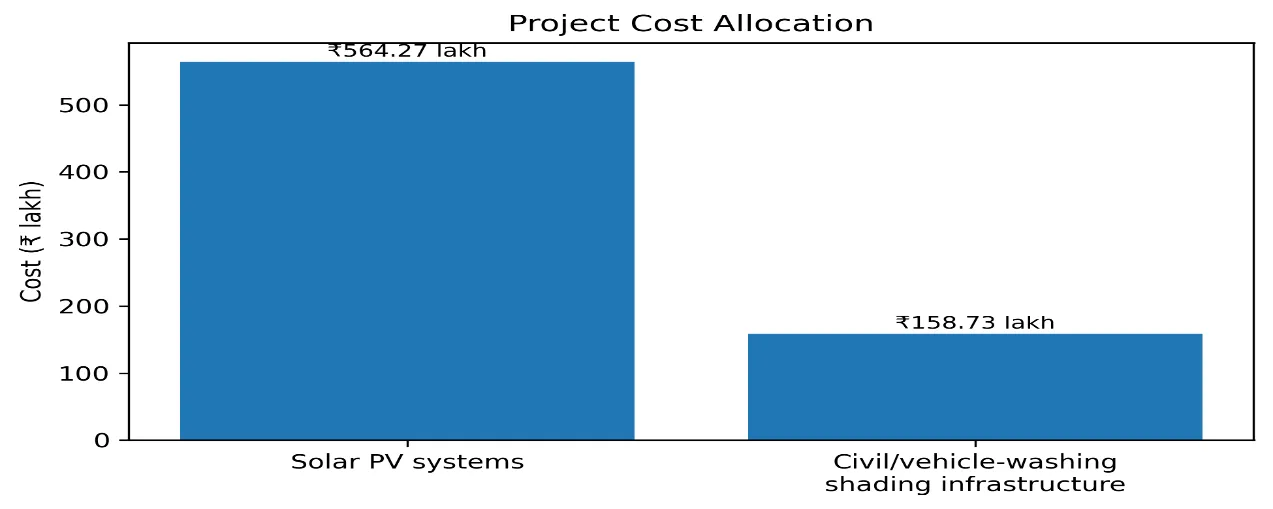
Fig. 4. Cost allocation reported in the DPR.
Using the DPR generation projection and tariff, the gross annual electricity-offset value is ₹225.88 lakh/year. Using the full project cost of ₹723.00 lakh gives a simple payback of approximately 3.20 years (38.4 months). Using only the reported solar-system cost of ₹564.27 lakh gives approximately 2.50 years. These are simple, pre-financing payback indicators and exclude O&M, degradation, tariff escalation, financing cost, net-metering settlement and downtime.
The source DPR also contains a separate financial-analysis table with OCR-readable payback statements that do not fully reconcile with the ₹564.27 lakh and ₹723.00 lakh costs and the 18.07 lakh kWh generation. The research version therefore uses the directly calculable values and recommends reconciliation against the final approved financial schedule.
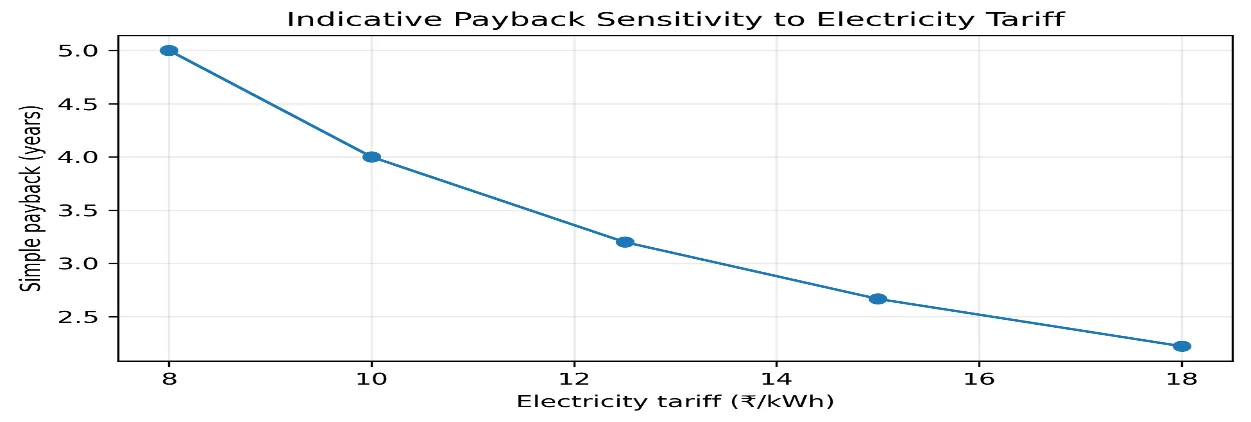
Fig. 5. Indicative simple-payback sensitivity to electricity tariff, holding DPR generation and total project cost constant.
VIII. ENVIRONMENTAL ASSESSMENT
PV electricity can reduce indirect emissions associated with grid electricity consumption. The appropriate calculation is M_CO2 = E_grid,displaced × EF_grid. The final carbon result should use the Central Electricity Authority's applicable grid-emission factor for the reporting year rather than transferring an emission factor from another study or year [17]. The CEA maintains a COâ‚‚ baseline database for the Indian power sector, and its current database provides versioned emission-factor information [17].
Recent literature supports the environmental relevance of PV-WWTP integration. Chen et al. reported 10–40% carbon-emission reductions for the analyzed Chinese WWTP-PV cases [6], while Milani and Nabi Bidhendi reported that combined renewable-energy approaches can substantially reduce WWTP greenhouse-gas emissions [8]. A 2025 study of PV deployment in Chinese WWTPs reported an average annual electricity contribution of about 20% across 31 case projects and an average GHG reduction of about 11%, emphasizing the dependence of performance on panel coverage and solar resource [15].
IX. OPERATION, MAINTENANCE AND PERFORMANCE VERIFICATION
The DPR specifies routine module cleaning, inverter checks, cable and structure inspection, earthing tests, SCADA/remote-monitoring checks and periodic energy auditing. It calls for module cleaning approximately twice per month or according to dust level, monthly inverter checks, quarterly cable/structure inspections, biannual earth-resistance testing, monthly SCADA checks and monthly/quarterly energy reporting. It also proposes training at least two ULB staff members and maintaining essential spare parts [16].
The DPR specifies minimum plant availability of 98% and a minimum CUF of 17%, together with a 24-hour response arrangement for major faults [16]. For research-grade verification, the following additional measurements are recommended: plane-of-array irradiance, module temperature, inverter DC/AC power, hourly plant import/export energy, STP load, inverter availability, soiling condition, downtime cause and maintenance expenditure.
X. DISCUSSION
The Jabalpur proposal is consistent with the broader research direction toward renewable-energy-supported wastewater infrastructure. The proposed capacity is close to the annual electricity requirement on an energy basis, and the grid-connected configuration avoids the additional complexity and cost of battery storage. The project also uses multiple site surfaces—rooftops, ground areas and vehicle-parking structures—which can increase the usable PV footprint in a municipal facility.
Nevertheless, the distinction between annual energy offset and instantaneous self-sufficiency is critical. A PV system producing 18.07 lakh kWh/year cannot guarantee that 100% of the STP load is supplied by PV at every moment. Literature on PV self-consumption and WWTP energy optimization indicates that hourly load profiles, aeration scheduling, tariff structures and energy-management strategies can materially affect economic performance [2], [3], [7], [11].
Another important issue is the treatment of the reported CUF. Direct calculation from the stated 1237.83 kW capacity and 18.07 lakh kWh/year generation yields 16.66%, while the DPR specifies a minimum CUF of 17%. This difference is small but meaningful in a performance-guarantee context. The final EPC/PV simulation should therefore define whether the 1237.83 kW refers to DC module capacity, AC inverter capacity or another contractual basis.
XI. LIMITATIONS
The DPR is a project-planning document and does not provide a post-commissioning measured-performance dataset.
No hourly STP electricity-load profile was available for this research version; therefore hourly self-consumption and export cannot be quantified.
The DPR contains financial statements that do not fully reconcile when independently recalculated from the stated capacity, generation, tariff and project-cost values.
The minimum CUF requirement and projected annual generation produce a small internal consistency gap when calculated directly.
Carbon benefits should be recalculated using the applicable CEA grid-emission factor and actual grid electricity displaced.
Final economic performance depends on actual tariff settlement, net-metering rules, O&M expenditure, degradation, availability and financing conditions.
XII. RECOMMENDED POST-COMMISSIONING RESEARCH DESIGN
A 12–24 month measurement-and-verification program is recommended. The study should establish a baseline period using utility bills and plant SCADA data, followed by continuous PV and electrical-load monitoring. At minimum, monthly data should include PV generation, grid import, grid export, plant electricity consumption, irradiation, downtime, maintenance activity and electricity tariff. Preferably, 15-minute or hourly data should be retained.
|
Metric |
Formula |
Purpose |
|
Specific yield |
E_PV/P_PV |
Compare PV production across sites |
|
CUF |
E_PV/(P_PV×8760) |
Performance verification |
|
Performance ratio |
E_PV/(H_POA×P_PV) |
Separate solar resource from system losses |
|
Self-consumption ratio |
E_self/E_PV |
Measure direct PV utilization |
|
Grid offset ratio |
E_grid,displaced/E_load |
Quantify load displacement |
|
Simple payback |
C0/S |
Screening-level economics |
|
COâ‚‚ avoided |
E_grid,displaced×EF_grid |
Environmental accounting |
Table III. Recommended Post-Commissioning Performance Metrics.
CONCLUSION
This paper reformulates the Jabalpur municipal solar-STP DPR into a research-oriented IEEE/Scopus-style case study. The project proposes 1237.83 kW of grid-connected PV across Kathonda and Lalpur STPs and projects approximately 18.07 lakh kWh/year of generation against a reported annual STP electricity requirement of approximately 18 lakh kWh. Derived indicators give a specific yield of approximately 1459.6 kWh/kWp-year and an implied CUF of 16.66%. The total project cost is ₹723.00 lakh, while the directly calculable gross annual electricity-offset value at ₹12.5/kWh is approximately ₹225.88 lakh. The central research finding is that the project has a strong annual energy-offset rationale, but its actual techno-economic and environmental performance must be established through measured hourly data. The most important pre-publication action is reconciliation of the DPR's financial schedules and CUF/generation assumptions. Once commissioned, the project can provide a valuable Indian case study for renewable-energy integration into urban wastewater infrastructure and can support comparative research with other WWTP-PV systems.
REFERENCES

MD Mister1*, Amol Barve1, Nand Kishore2, Techno-Economic And Environmental Assessment Of Grid-Connected Solar Photovoltaic Systems For Urban Sewage Treatment Plants: A Case Study Of Jabalpur, Madhya Pradesh, Int. J. Sci. R. Tech., 2026, 3 (9), 314-322. https://doi.org/10.5281/zenodo.22876690
 10.5281/zenodo.22876690