
 Hugues-Yvan GOMAT*
 Suspense Averti IFO
The spectral analysis of biological materials, particularly plants, represents a significant scientific challenge for understanding the biochemical processes and structural modifications that occur over time. Mid-infrared (MIR) spectroscopy is a widely used technique for evaluating the chemical properties of plant tissues due to its ability to identify diverse functional groups (Savitzky & Golay, 1964; Cozzolino & Mor?n, 2003). By recording molecular vibrations specific to chemical bonds within a defined spectral range, MIR spectroscopy detects sample-specific chemical signatures, such as O-H, C=O, and N-H bonds, which are crucial for characterizing the organic components of tissues. Quantitative infrared spectrometry, commonly applied in studies on soil biology (Brunet & Barth?s, 2005), also demonstrates potential for the rapid and non-destructive assessment of biological properties in soils, expanding the scope of spectral analysis across various biochemical contexts.
This study, conducted in Congo in the Bat?k? Plateaux region, specifically in Ngo, aims to investigate the chemical variations associated with the age of cassava samples (Manihot esculenta). Plant growth and maturation result in biochemical changes, particularly evident in tissue composition (Buchanan, Gruissem, & Jones, 2015; Taiz & Zeiger, 2010). These changes can be observed with sample age, such as an increase in structural compounds like lignin, a phenomenon well-documented in wood and other lignified tissues (Hatfield & Fukushima, 2005). Brunet and Barth?s (2010) further demonstrated that near-infrared spectroscopy (NIRS) is an effective tool for estimating the carbon content of tropical ferrallitic soils, showcasing its applicability in evaluating samples with high organic matter content, such as plant tissues. To better understand the influence of age on the chemical composition of plants, it is crucial to employ robust analytical methods, enabling MIR spectra to be reliably compared across samples of varying ages and tissue types. rincipal Component Analysis (PCA) is a dimensionality reduction technique that facilitates the interpretation of complex spectral data by identifying the most significant axes of variation. Applying PCA to MIR spectra simplifies the analysis by highlighting the primary sources of variance (Jolliffe & Cadima, 2016). This method enables the visualization of groupings and variations among samples based on factors such as age and tissue type (e.g., leaves, roots, trunks), providing valuable insights into the maturation and biochemical specialization of plant tissues (Naumann et al., 2010; Schwanninger et al., 2004). In this study, cassava samples from plots of different ages (5 to 15 months) were analyzed to assess chemical changes associated with ripening using MIR spectroscopy. Average spectra were compared across plots and plant compartments, including leaves, roots, and trunks, to identify distinctive chemical differences. Spectroscopic preprocessing techniques, such as Savitzky-Golay smoothing, derivative normalization, and Standard Normal Variate (SNV), were applied to enhance spectral quality and reduce noise, enabling the detection of subtle spectroscopic details (Barnes et al., 1989; Savitzky & Golay, 1964). ?The results of this study provide insights into the chemical evolution of cassava samples based on age and tissue type. By identifying variations in functional groups and dominant chemical bonds at different growth stages, this analysis enhances the understanding of biochemical processes in plants. The spectral data reveal that age- and compartment-specific differences can be detected and interpreted through PCA, which highlights significant spectral frequencies (Cozzolino & Mor?n, 2003). This integrated approach, combining MIR spectroscopy and PCA, could be applied to other comparative studies, thereby improving the precision and scope of chemical analyses in plant tissue research.
MATERIALS AND METHODS
2.1 Study Area
This study was conducted in the Ngo region, situated in the Bat?k? Plateaux of Congo, approximately 250 km north of Brazzaville. Covering an area of 13,000 km?2;, this region lies between latitudes 2? and 4? South and is bordered to the east by the Congo River. The climate is classified as Lower Congolese, featuring a 9-month rainy season with an annual rainfall of 1600 to 1800 mm and an average temperature of 26 ?C (Elenga & Ikoli, 1996, as cited in Nungi-Pambu, 2018). The dry season, shorter than that of Brazzaville, lasts approximately three months, from June to August. The vegetation consists of a mosaic of grassy and shrubby savannas interspersed with humid gallery forests, typical of forest transition zones (Descoings, 1975, as cited in Situatala, 2017).
The soils of the Bat?k? Plateaux are predominantly ferralitic, resting on sandstone and siliceous substrates. Three main soil classes are identified: groundwater podzols, peaty hydromorphic soils found in marshy valleys, and desaturated ferralitic soils that dominate the plateaux (Schwartz, 1988, as cited in Situatala, 2017). These soils provide an ideal environment for studying the influence of edaphic characteristics on the chemical composition of crops, particularly cassava.
2.2 Biological Material
The study focused on a single cassava variety, ?Ad?le,? chosen for its prevalence in the Ngo region and its high productivity. Well-adapted to local conditions, this variety represents the agricultural practices of the Bat?k? Plateaux, where it is widely cultivated by local farmers.
2.3 Plot Selection and Sampling
The Obima area in the Ngo region was selected for its network of cassava plantations featuring diverse ages and varieties. The studied plots are managed by local producers, with their selection based on criteria such as plant age, maintenance practices, and the availability of detailed information for each plot. Within each plot, a 6 m ? 9 m (54 m?2;) inventory plot was established to provide a representative sample of local agricultural areas. A chronosequence of five plots with different ages was established: P1 (5 months), P2 (15 months), P3 (10 months), P4 (12 months), and P5 (7 months). This design allows for tracking the evolution of the chemical properties of cassava compartments over time, which is crucial for analyzing the effects of tissue maturation (Sch?del et al., 2010).
2.4 Biometry and Biomass
In each plot, biometric measurements were performed to evaluate the growth and biomass of cassava plants (Photo 1). Plant height and diameter were measured using a field ruler and caliper, respectively, and the number of stems per plant was recorded. Biomass samples were collected from each plant compartment (roots, cuttings, trunk, lignified branches, green branches, and leaves) from a representative plant in each plot. These compartments were then separated and weighed to determine their fresh weight. To assess moisture content, aliquots from each compartment were dried at 65?C until their weight stabilized. The biomass of each compartment was calculated by multiplying the average biomass per plant by the plant density in the plot. This methodology enabled the quantification of the specific biomass for each plant part, providing critical data for interpreting the chemical composition of the various compartments (Hatfield & Fukushima, 2005).
2.5 Mid-Infrared (MIR) Spectroscopic Analysis
The dried samples were ground into a fine, homogeneous powder and analyzed using mid-infrared spectroscopy (MIR) at the Biogeochemistry of Forest Ecosystems Laboratory in Nancy (GE-Nancy). This technique enables the identification and quantification of characteristic functional groups (O-H, C-H, C=O, and C-O) associated with organic compounds in both lignified and non-lignified tissues. The MIR spectra obtained were analyzed to compare the chemical composition of cassava compartments, with a particular focus on carbohydrates, lipids, and lignin (Naumann et al., 2010; Schwanninger et al., 2004). These spectra provide valuable insights into the role of these compounds in plant physiology by identifying chemical signatures that change with plant age.
2.6 Data Analysis
Data analysis was performed using R software, enabling the integration of spectral and biometric data through multivariate techniques and advanced visualizations. The MIR spectra, following preprocessing steps such as Savitzky-Golay smoothing and SNV normalization, were analyzed using Principal Component Analysis (PCA) to identify the primary sources of variation based on age and compartment (Savitzky & Golay, 1964; Barnes et al., 1989). This approach revealed trends in chemical composition and identified significant spectral frequencies linked to biochemical differences between samples.
RESULTS AND DISCUSSION
3.1 Analyse des Chargements Spectraux par MIRS des ?chantillons de Manioc des Plateaux Bat?k?
Figure 1 illustrates the loading coefficients on the first dimension (Dim 1) of a mid-infrared spectroscopy (MIRS) analysis performed on cassava samples from the Bat?k? Plateaux in Ngo. The horizontal axis represents absorption frequencies (in cm??1;), while the vertical axis shows the influence of various chemical functional groups on the variability of the samples. Significant peaks correspond to characteristic vibrations, notably those of N?H, O?H, and C?H bonds, as well as carbonyl (C=O), aromatic, and amine groups, reflecting the presence of biochemical compounds such as alcohols, acids, esters, or starches. These findings align with studies on infrared spectroscopy of tropical soils, where specific spectral regions, such as 3500?3000 cm??1; for O?H and around 1700 cm??1; for carbonyls, have been identified as major indicators of soil chemical properties (Parikh et al., 2014). Variations in spectral loadings highlight interactions between soil properties and the biochemical composition of cassava, influenced by organic matter content and agricultural practices, enabling the identification of biomarkers to assess soil and crop quality. Indeed, MIRS is recognized as a non-destructive and efficient tool for characterizing the biochemical composition of soils and plants in diverse environmental contexts (Stenberg et al., 2010; Viscarra Rossel & Behrens, 2010). This approach proves valuable for promoting sustainable agricultural management and evaluating the impact of cultivation conditions on production systems.
? ? ? ?
? ? ? ? ? ? 
? ? ? ? ? ??
Figure?1: Contribution des Groupes Fonctionnels ? la Variabilit? Chimique des ?chantillons de Manioc (Analyse MIRS, Dimension 1)
3.2 Analyse Spectrale des Sols sous Plantation de Manioc : Variabilit? Chimique et Indices Fonctionnels
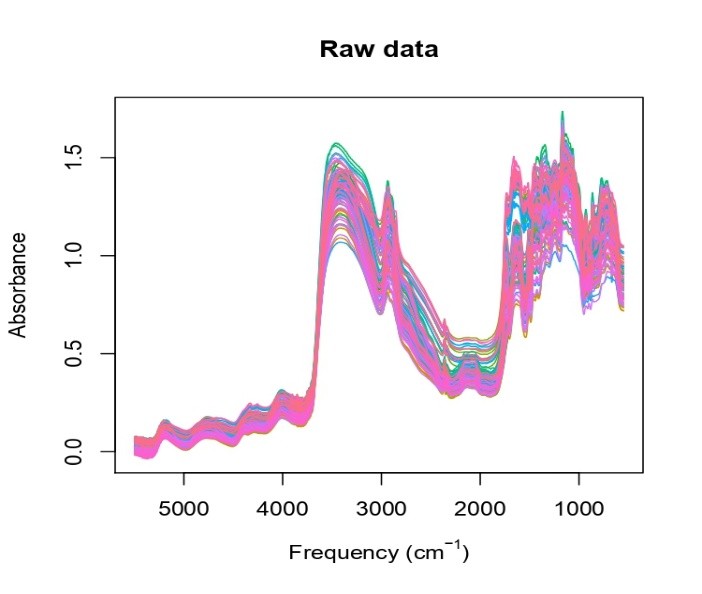
Figure 2 illustrates the variations in preprocessed absorbance as a function of infrared frequencies (cm??1;) for soils under cassava plantations, with an average curve (in red) representing overall trends and individual curves (in black) reflecting sample heterogeneity. The spectral regions highlight specific functional groups: O?H vibrations (water, hydroxyl groups) around 3500?3000 cm??1;, carbonyl groups (C=O) between 1700?1500 cm??1;, and C?O or aromatic bonds between 1000?1500 cm??1;, while frequencies below 1000 cm??1; indicate signatures of minerals such as silicates or carbonates. Variations between spectra reveal chemical variability related to organic matter, minerals, and soil moisture. These findings provide insights into the physicochemical properties influencing cassava growth and can guide sustainable agricultural practices for better soil management. This is consistent with prior studies showing the utility of mid-infrared spectroscopy for characterizing soil properties and composition (Parikh et al., 2014; Stenberg et al., 2010; Viscarra Rossel & Behrens, 2010).
? ? ? ?
? ? ? ? ? ? 
? ? ? ? ? ??
Figure?2: Spectres Infrarouges Moyens des Sols sous Plantation de Manioc ? Ngo
3.3 Scree Plot of PCA
The Scree Plot (Figure 3) indicates that the first two principal components account for 91.8% of the total variance (64.4% for the first component and 27.4% for the second), demonstrating their effectiveness in capturing the chemical variability between samples. This high proportion of explained variance justifies focusing on these two dimensions for analysis, enabling interpretation without significant loss of information. This approach, recommended for PCA (Jolliffe & Cadima, 2016; Wold et al., 1987), simplifies the data, allowing for a more targeted and meaningful examination of differences based on the age of plots and compartments.
? ? ? ?
? ? ? ? ? ? 
? ? ? ? ? ??
Figure 3: Distribution of Variance Explained by Principal Components in MIR Spectra
3.4 Factor Maps of Individuals by Plot and Compartment
The factor maps (Figures 4 and 5) display clear groupings of samples based on plot age and plant compartments. The separation by plot age reflects chemical variations likely driven by the accumulation of lignin and other compounds over time (Hatfield & Fukushima, 2005). Differentiation by compartment underscores chemical signatures unique to each tissue type, such as chlorophylls in leaves and phenolics in roots, aligning with the distinct biochemical roles of each plant part (Pandey & Pitman, 2003).
? ? ? ?
? ? ? ? ? ? 
? ? ? ? ? ??
Figure 4: Distribution of Samples by Plot Age (P1 to P5) in the Factorial Space
? ? ? ?
? ? ? ? ? ? 
? ? ? ? ? ??
Figure 5: Distribution of Samples by Plant Compartment in the Factorial Space
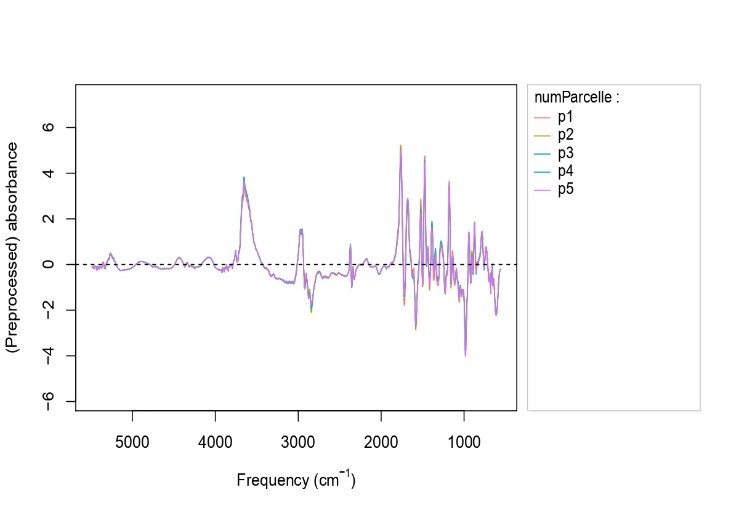
3.5 Average Spectra by Plot
The average spectra per plot (Figure 6) reveal significant differences in absorbance within specific regions (5000 to 1000 cm??1;), which increase with plot age. These spectral variations correspond to functional groups such as hydroxyls and carbonyls, indicating an accumulation of lignin and other structural compounds in more mature plots (Sch?del et al., 2010). This finding confirms the impact of sample maturation on chemical composition, aligning with the expected biochemical development in plant tissues over time.
? ? ? ?
? ? ? ? ? ? 
? ? ? ? ? ??
Figure 6: Average MIR Spectra by Plot Age (P1 to P5)
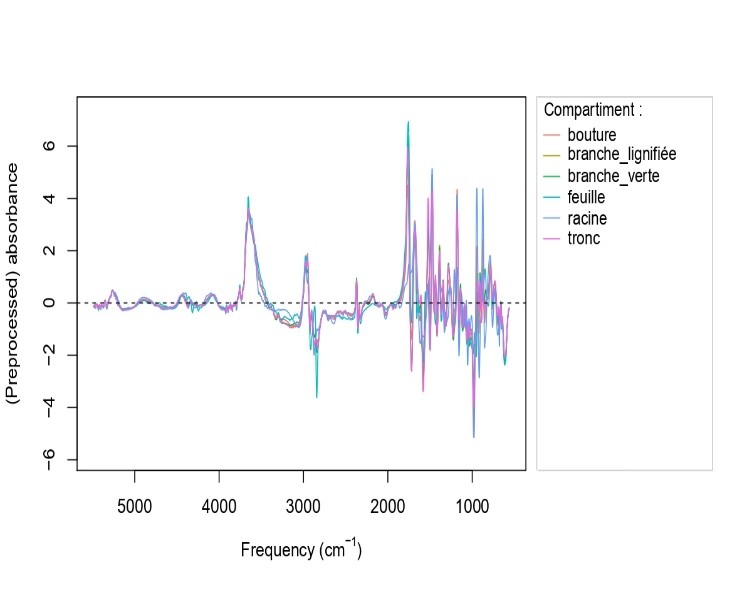
3.6 Average Spectra by Compartment
The average spectra (Figure 7) display distinct signatures for each plant compartment, highlighting clear differences based on tissue types (leaves, roots, trunks). Variations such as peaks associated with chlorophylls in the leaves or lignin in the trunks reflect the specific chemical compositions of each compartment, corresponding to their biological functions (Naumann et al., 2010; Schwanninger et al., 2004). This chemical heterogeneity underscores the specialization of plant tissues, with each compartment exhibiting a composition adapted to its functional role.
? ? ? ?
? ? ? ? ? ? 
? ? ? ?
Figure 7: Average MIR Spectra for Each Plant Compartment
3.7 Comparison of Spectra with Savitzky-Golay, Derivatives, and SNV Preprocessing
Savitzky-Golay and derivative preprocessing with SNV (Figures 8 and 9) enhance the clarity and precision of the spectra by reducing noise and emphasizing peak details. Savitzky-Golay smoothing effectively eliminates non-significant fluctuations while preserving key spectral features, and derivatization captures fine variations between samples, which is essential for analyzing subtle chemical differences (Savitzky & Golay, 1964; Barnes et al., 1989). These preprocessing methods are particularly valuable for improving spectral resolution and ensuring data normalization.
? ? ? ?
? ? ? ? ? ? 
? ? ? ? ? ??
Figure 8: Smoothed and Normalized MIR Spectra Using Savitzky-Golay and SNV
? ? ? ?
? ? ? ? ? ? 
? ? ? ? ? ??
Figure 9: MIR Spectra After Derivation and SNV Normalization to Enhance Peak Resolution
3.8 Contribution Map of Variables (Frequencies) to Principal Components
The spectral contribution map (Figure 10) highlights the frequencies most influential on the principal components, particularly those associated with C=O and O-H bonds. These functional groups play a key role in the chemical differentiation between samples, explaining the observed spectral variations based on plot age and plant compartments (Cozzolino & Mor?n, 2003). This result aids in interpreting the principal components by pinpointing the most significant chemical signatures, offering insights into spectral differences linked to the biochemical composition of the plant samples.
? ? ? ?
? ? ? ? ? ? 
? ? ? ? ? ??
Figure 10: Contribution of Spectral Frequencies to Principal Components in the Analysis of MIR Spectra
CONCLUSION
This study presents an in-depth analysis of the chemical variations observed in Manihot esculenta tissues at different growth stages on the Bat?k? Plateaux, leveraging the capabilities of mid-infrared spectroscopy (MIR). The results highlight the role of functional groups such as O?H, C=O, and C?O in explaining variability among samples, with significant contributions to the differentiation of chemical profiles across plant compartments. Furthermore, this study emphasizes the variability of soil chemistry under cassava plantations, shedding light on the interaction between soil properties and the biochemical composition of crops. These findings demonstrate the marked influence of plot age on the biochemical maturation of cassava, characterized by specific chemical signatures in plant tissues and soil profiles. By combining MIR spectroscopy with principal component analysis (PCA), this research highlights a reliable and non-destructive method for monitoring the health of plants and soils. Such an approach holds promising potential to guide sustainable agricultural practices, improve resource management, and support ecological restoration efforts tailored to specific environmental conditions.
REFERENCE
- Savitzky, A., & Golay, M. J. E. (1964). Smoothing and differentiation of data by simplified least squares procedures. Analytical Chemistry, 36(8), 1627?1639. https://doi.org/10.1021/ac60214a047
- Cozzolino, D., & Mor?n, A. (2003). The potential of near-infrared reflectance spectroscopy to analyse soil chemical and physical characteristics. Journal of Agricultural and Food Chemistry, 51(21), 7702?7708. https://doi.org/10.1021/jf0342125
- Hatfield, R., & Fukushima, R. S. (2005). Can lignin be accurately measured? Crop Science, 45(3), 832?839. https://doi.org/10.2135/cropsci2004.0238
- Jolliffe, I. T., & Cadima, J. (2016). Principal component analysis: A review and recent developments. Philosophical Transactions of the Royal Society A: Mathematical, Physical and Engineering Sciences, 374(2065), 20150202. https://doi.org/10.1098/rsta.2015.0202
- Naumann, A., Heine, G., & Rauber, R. (2010). Efficient discrimination of oat and pea roots by cluster analysis of Fourier transform infrared (FTIR) spectra. Field Crops Research, 119(1), 78?84. https://doi.org/10.1016/j.fcr.2010.06.019
- Schwanninger, M., Rodrigues, J. C., Pereira, H., & Hinterstoisser, B. (2004). Effects of short-time vibratory ball milling on the shape of FT-IR spectra of wood and cellulose. Vibrational Spectroscopy, 36(1), 23?40. https://doi.org/10.1016/j.vibspec.2004.02.003
- Barnes, R. J., Dhanoa, M. S., & Lister, S. J. (1989). Standard normal variate transformation and de-trending of near-infrared diffuse reflectance spectra. Applied Spectroscopy, 43(5), 772?777. https://doi.org/10.1366/0003702894202201
- Wold, S., Esbensen, K., & Geladi, P. (1987). Principal component analysis. Chemometrics and Intelligent Laboratory Systems, 2(1?3), 37?52. https://doi.org/10.1016/0169-7439(87)80084-9
- Elenga, H., & Ikoli, F. (1996). Contribution ? la connaissance des potentialit?s agro-?cologiques des Plateaux Bat?k?. Cited in: Nungi-Pambu, C. (2018).
- Descoings, B. (1975). Contribution ? l'?tude des for?ts galeries du Congo. Cited in: Situatala, B. (2017).
- Schwartz, D. (1988). Les sols des savanes du Congo. Cited in: Situatala, B. (2017).
- Pandey, K. K., & Pitman, A. J. (2003). FTIR studies of the changes in wood chemistry following decay by brown-rot and white-rot fungi. International Biodeterioration & Biodegradation, 52(3), 151?160. https://doi.org/10.1016/S0964-8305(03)00052-0
- Sch?del, C., Bl?chl, A., Richter, A., & Hoch, G. (2010). Short-term dynamics of non-structural carbohydrates and lipids in the leaves and roots of two temperate grassland species following defoliation. Plant Biology, 12(5), 831?841. https://doi.org/10.1111/j.1438-8677.2009.00291.x
- Parikh, S. J., Ghezzehei, T. A., & O?Geen, A. T. (2014). Chemical and physical processes controlling soil carbon sequestration. Soil Biology and Biochemistry. https://doi.org/10.1016/j.soilbio.2014.07.026
- Stenberg, B., Rossel, R. A. V., Mouazen, A. M., & Wetterlind, J. (2010). Visible and near-infrared spectroscopy in soil science. Advances in Agronomy, 107, 163?215. https://doi.org/10.1016/S0065-2113(10)07005-7
- Viscarra Rossel, R. A., & Behrens, T. (2010). Using soil spectroscopy for hyperspectral imaging in agricultural research. Geoderma, 158(1?2), 1?14. https://doi.org/10.1016/j.geoderma.2010.03.004
- Stenberg, B., Rossel, R. A. V., Mouazen, A. M., & Wetterlind, J. (2010). Visible and near-infrared spectroscopy in soil science. Advances in Agronomy, 107, 163?215. https://doi.org/10.1016/S0065-2113(10)07005-7
 10.5281/zenodo.14463956