
 Harshada Chavan*
Sustained-release drug delivery systems improve therapeutic efficacy and enhance patient compliance by maintaining steady plasma drug levels. Ivabradine Hydrochloride, a cardiac selective If channel inhibitor, requires precise plasma concentration for effective management of angina and heart failure. However, its short half-life necessitates frequent dosing, making it an ideal candidate for sustained-release formulation [1]. Natural gums, including xanthan, guar, and karaya, are biocompatible, biodegradable, and cost-effective excipients that provide controlled drug release. Research demonstrates their efficacy in matrix systems by modifying swelling and erosion profiles to sustain drug release. Despite extensive studies on synthetic polymers, there remains an untapped potential for using these natural gums in commercial formulations. This study explores the formulation and evaluation of matrix tablets using natural gums to develop a robust, sustained-release system for Ivabradine Hydrochloride [2,3].
MATERIALS AND METHODS
Ivabradine HCl was procured from Hetero Drug Limited, Mumbai, India. ?Xanthan gum, Karaya gum, Microcrystalline cellulose, Polyvinyl pyrrolidine K30, Magnesium stearate and Talc were procured from SD Fine Chemicals, Mumbai, India.
Melting Point Determination
Thiele's Tube method was used to establish Ivabradine Hydrochloride's melting point. The glass capillary was sealed from one end and drug was filled into it from another end. Then the capillary tube was tied to the thermometer and placed in the Thiele's tube containing liquid paraffin. The tube was heated, and melting point of the drug was determined by observing the temperature on the thermometer when the particles have just started to melt and when all the drug particles were melted [4].
Determination of ?-Max of Ivabradine Hydrochloride
10 mg of precisely weighed Ivabradine Hydrochloride was added to 100 ml of a volumetric flask, and the volume was adjusted with 0.1 N HCl. The stock solution was labeled 1 mg/ml, or 100 parts per million (ppm). In a different volumetric flask, 1 ml of the stock solution was extracted, diluted to 10 ml to create a stock solution of 10 ppm, and then analyzed at 200?400 nm. The measured ?-max was 286 nm. Likewise, ?-max was also measured in a pH 6.8 phosphate buffer [5].
?
Drug-Excipient Compatibility Study
Using a Shimadzu IR Affinity-IS, the FTIR spectra of Ivabradine Hydrochloride was captured. The drug sample was scanned between 400 and 4000 cm-1, while in an FTIR sample holder. The spectrum was confirmed by comparing with the IR spectra of Ivabradine Hydrochloride [6,7].
Pre-Compression Evaluation of Powder [8-10]
Bulk density
The precisely weighed powder was poured into a graduated cylinder to measure bulk density. The powder's weight (M) and bulk volume (Vb) were calculated. The following formula was used to get the bulk density:
Bulk density (BD) =? Weight of powderMBulk volume (Vb)
Tapped density
The 100 ml measuring cylinder was filled with the sample powder. A after that a fixed number of taps (100) where applied to the cylinder. Record the final volume and by the following equation the tapped density was calculated.
Tapped Density (TD) = Weight of powderMTapped volume (Vt)
Carr?s index
One of the most crucial metrics for describing the characteristics of powders and granules is Carr's index. From the following equation it can be calculated and category of Carr?s Index is shown in the table 1.
Carr?s Index (I) = Tapped densityTD - Bulk density (BD)Tapped density (TD)??  * 100
* 100
Table 1: Carr?s Index
|
% Compressibility Index |
Properties |
|
5-12 |
Free Flowing |
|
12-19 |
Good |
|
19-21 |
Fair |
|
23-31 |
Poor |
|
33-38 |
Very poor |
|
> 40 |
Extremely poor |
?
?
?
?
?
?
?
?
?
?
?
Hausner's ratio
The Hausner's ratio is an index of ease of flow of powder. The ???Hausner's ratio less than 1.25 indicates good flow. It is calculated by the formula
Hausner?s ratio = Tapped DensityBulk Density 
Table 2: Hausner's ratio
|
???? Hausner's ratio |
Property |
|
0.1 - 1.25 |
Free flowing |
|
1.25 - 1.6 |
Cohesive powder |
?
?
?
?
?
?
Angle of repose
The fixed funnel method was used to calculate the angle of repose. A vertically adjustable funnel was used to pour the mixture until the desired maximum cone height (h) was reached. The following formula was used to determine the angle of repose and measure the heap's radius (r):
Angle of repose ?=tan-1hr
The radius of the base pile is denoted by r, the height of the pile by h, and the angle of repose by ?.
Table 3: Angle of repose
|
Angle of repose (?) |
Type of flow |
|
< 25> |
Excellent |
|
25 - 30 |
Good |
|
30 ? 40 |
Passable |
|
> 40 |
Very poor |
?
Formulation of Ivabradine Hydrochloride Sustained-Release Tablets
The tablets were prepared using a rotary tablet compression machine and the direct compression method. Xanthan gum and Karaya gum were used as polymers in varying percentages to formulate the matrix. Microcrystalline cellulose was incorporated as a diluent to facilitate slow erosion of the tablet matrix, while polyvinyl pyrrolidone K30 served as a binding agent. All components were initially sieved through an 80# screen to ensure uniform particle size as shown in table 4. The sieved ingredients were thoroughly mixed, and a measured quantity of talc and magnesium stearate was added as lubricants. The mixture was blended again to ensure homogeneity. The final powder blend was then compacted into tablets using a rotary tablet compression machine, applying appropriate compression force to achieve uniformity in tablet size and hardness [10,11].
Table 4: Formulation Batch (F1 - F9)
|
Ingredients (mg) |
F1 |
F2 |
F3 |
F4 |
F5 |
F6 |
F7 |
F8 |
F9 |
|
Ivabradine HCl |
12 |
12 |
12 |
12 |
12 |
12 |
12 |
12 |
12 |
|
Xanthan gum |
12 |
24 |
36 |
- |
- |
- |
6 |
12 |
18 |
|
Karaya gum |
- |
- |
- |
12 |
24 |
36 |
6 |
12 |
18 |
|
Microcrystalline cellulose |
84 |
72 |
60 |
84 |
72 |
60 |
84 |
72 |
60 |
|
PVP K30 |
8 |
8 |
8 |
8 |
8 |
8 |
8 |
8 |
8 |
|
Magnesium stearate |
2 |
2 |
2 |
2 |
2 |
2 |
2 |
2 |
2 |
|
Talc |
2 |
2 |
2 |
2 |
2 |
2 |
2 |
2 |
2 |
|
Total wt. (mg) |
120 |
120 |
120 |
120 |
120 |
120 |
120 |
120 |
120 |
Evaluation of Sustained Release Matrix Tablet [8, 10-12]
Weight variation
Twenty pills of each formulation were weighed in total, and the average was computed. Accurate weight measurements of each tablet were also made, and the weight variation was computed.
Hardness
It gauges the amount of force needed to shatter the tablet during testing. For uncoated tablets, a hardness of roughly 0.1-3 kg/cm2 is adequate, and the force is expressed in kilograms. A Monsanto hardness tester was used to measure the hardness of ten tablets from each formulation.
Thickness
A digital vernier scale was used to measure the tablet's thickness. mm was used to express thickness.
Friability test
Variability in Digital Programmable Friability A device was used to determine how friable the tablets were. Twenty pills of each formulation were weighed and put in a machine that revolved for four minutes at 25 rpm. The tablets were weighed once more after being dedusted. Weight loss as a percentage was determined.
F = (W int -W fin) /W int ?100
Where, W int = Initial Weight of tablets before friability;
W fin = Final Weight of tablets after friability.
Disintegration time
A one-liter beaker of 0.1 N HCl and PBS pH 6.8 was filled with the six-glass tube disintegration apparatus, each holding one tablet. The tablets were positioned so that they remained below the liquid's surface during their upward movement and did not descend more than 2.5 cm from the beaker's bottom, and the time it took for the tablet to begin dissolving was recorded.
Swelling behavior of matrix tablet
The tablet calculated the % weight gain to determine the degree of edema. Every formulation's swelling behavior was examined. Each formulation's single tablet was stored in a Petri dish filled with phosphate buffer at a pH of 6.8. The tablet was taken out, soaked in tissue paper, and weighed after an hour. The pill weights were then recorded every two hours, and this process was carried out until the end of eight hours. A formula was used to determine the tablet's % weight gain;
S.I. = {(Mt-Mo) / Mo} X 100,
Where, S.I. = swelling index, Mt = weight of tablet at time (in sec) and Mo = weight of tablet at time t =0.
Drug Content
20 pills were weighed and pulverized. Transfer the tablet powder to a 100 ml volumetric flask after calculating how much it is equal to 10 mg of medication. PBS 6.8 is used to make up volume. The drug content was ascertained using a UV-visible spectrophotometer following an appropriate dilution with pH 6.8 phosphate buffer and a one-hour sonicator shaking of the volumetric flask. Measure the absorbance and calculate the drug content.
In Vitro Dissolution
The USP II dissolving testing device was used for the dissolution test. At 50 rpm and 37.7 ?C ? 0.5 ?C, 900 cc of phosphate buffer pH 6.8 was used as the dissolving media. Every so often, five milliliters of aliquots were taken out, and the sample volume was swapped out for an equivalent volume of brand-new dissolving medium. The percentage of drug release was determined by spectrophotometrically analyzing the samples at 286 nm.
Drug Release Kinetics Modelling
To understand the release mechanism of the formulated sustained release matrix tablets, the drug release data obtained from the diffusion studies were fitted to various kinetic models [10].
Zero order model
C0 ? Ct = K0t ; Ct = C0 + K0t
Where, Ct is the amount of drug released at time t,
C0 is the initial concentration of drug at time t = 0,
K0 is the Zero order rate constant.
First order model
log C = log C0 ? K1 t/2.303 Where,
C is the percent of drug remaining at time t,
C0 is the initial concentration of the drug at time t = 0,
K1 is the First order rate constant.
Higuchi model
Q = KH t 1/2 Where,
Q is the cumulative amount of drug released in time t,
KH is the Higuchi dissolution constant
Korsmeyer-peppas model
log (Mt/M?) = log KKP + n log t Where,
Mt is the amount of drug released at time t,
M? is the amount of drug released after the time ?,
n is the diffusional exponent or drug release exponent,
KKP is the Korsmeyer-peppas release rate constant.
Hixson-crowell model
???????? ????/???? ? ???????? ????/???? = KHC t Where,
W0 is the initial amount of drug at time t = 0,
Wt is the remaining amount of drug at time t,
?KHC is the Hixson-crowell constant.
The best-fit model for our formulation was determined based on the regression coefficient (R2R^2R2) values, providing insights into the predominant release mechanism and guiding further optimization of the tablet design.
Stability study
The sustained-release tablets of ivabradine hydrochloride were formulated and subjected to accelerated stability testing to assess their robustness under stressed conditions. The manufactured tablets were wrapped in aluminum strips to protect them from environmental factors and placed in a humidity chamber set at 40 ? 2?C and 75?5% relative humidity. The stability tests were conducted over 30 and 60 days. At each time point, the samples were removed and examined for changes in physical appearance, drug release behavior, and other quality attributes. Noticeable changes were observed in the tablets' appearance and drug release profile over time. Key parameters, including disintegration time, wetting time, and batch optimization, were recorded and analyzed as part of the comparative profile release (CPR) evaluation during the stability studies. These findings provided valuable insights into the impact of storage conditions on the performance and stability of the formulation [13-14].
RESULTS AND DISCUSSION
Preformulation Studies
Organoleptic Analysis: Ivabradine Hydrochloride was evaluated for its organoleptic properties like appearance, colour, odour, and nature by visual inspection.
Table 5: Organoleptic Analysis
|
Sr. No. |
Properties |
Description |
|
1 |
Appearance / Nature |
Amorphous |
|
2 |
Colour |
Yellowish White Powder |
|
3 |
Odour |
Odourless |
Melting Point
Melting range or temperature gives an idea regarding identity and purity of provided sample. The melting range or temperature of Ivabradine Hydrochloride was found to be 195?C indicating that it is pure without any impurities as it lies within the standard range.
Ultraviolet Visible (UV-Vis) Spectrophotometry
Spectrometric Scanning and Determination of ? Max of Ivabradine Hydrochloride in 0.1 N HCl
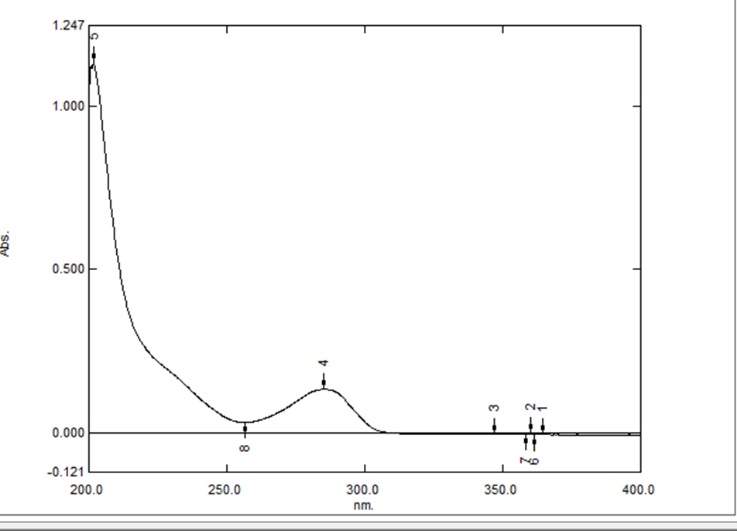
- Spectrometric scanning and the measurement of Ivabradine Hydrochloride's ? max in 0.1 N HCl revealed the greatest peak at 286 nm, which is regarded as the hydrochloride's maximum absorbance (?-max). The Ivabradine Hydrochloride calibration curve was therefore chosen to use this wavelength. 0.1 N HCl was the solvent that was employed.
UV Absorption Spectrum of Ivabradine Hydrochloride in 0.1 N HCl
? ? ? ?
? ? ? ? ? ? 
? ? ? ?
Figure 1: UV-Vis spectra of of Ivabradine Hydrochloride in 0.1 N HCl
- Calibration Curve of Ivabradine Hydrochloride in 0.1 N HCl
Ivabradine hydrochloride concentrations ranging from 2 ppm to 10 ppm in 0.1 N HCl were chosen for the calibration curve. R2 was found to be 0.999, suggesting that, within the chosen range, the relationship between drug concentration and absorbance was linear. Figure 2 shows the standard calibration curve, while the table 6 shows the absorbance of various drug doses in 0.1 N HCl. In the formula y = 0.0991x - 0.0048, x stands for concentration and y for absorbance.
? ? ? ?
? ? ? ? ? ? 
? ? ? ?
Figure 2: Calibration Curve of Ivabradine Hydrochloride in 0.1 N HCl
Table 6: Calibration Curve of Ivabradine Hydrochloride in 0.1 N HCl
|
Sr. No. |
Concentration (ppm) |
Absorbance |
|
1 |
2 |
0.187 |
|
2 |
4 |
0.398 |
|
3 |
6 |
0.596 |
|
4 |
8 |
0.782 |
|
5 |
10 |
0.986 |
Spectrometric Scanning and Determination of ? Max of Ivabradine Hydrochloride in PBS pH 6.8
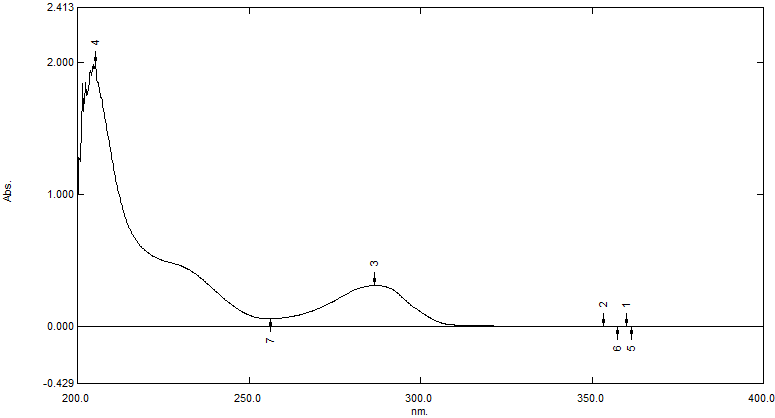
The highest peak at 286 nm, which is regarded as the maximum absorbance (? max) for Ivabradine Hydrochloride, was found by spectrophotometric scanning and measurement of its ? max in PBS pH 6.8. This wavelength was therefore chosen for the Ivabradine Hydrochloride calibration curve. PBS pH 6.8 was utilized as the solvent.
? ? ? ?
? ? ? ? ? ? 
? ? ? ?
Figure 3: UV-Vis Spectra of Ivabradine Hydrochloride in PBS pH 6.8
Calibration Curve of Ivabradine Hydrochloride in PBS pH 6.8
For the calibration curve, Ivabradine Hydrochloride concentrations in PBS pH 6.8 ranging from 2 ppm to 10 ppm were chosen. With an R2 value of 0.999, it was determined that the relationship between medication concentration and absorbance was linear within the chosen range. Figure 4 shows the standard calibration curve, and the table 7 shows the absorbance of various drug doses in PBS pH 6.8. the formula y = 0.0977x - 0.0339, in which x represents concentration and y represents absorbance.
Figure 4: Calibration Curve of Ivabradine Hydrochloride in PBS pH 6.8
Table 7: Calibration Curve of Ivabradine Hydrochloride in PBS pH 6.8
|
Sr. No. |
Concentration (ppm) |
Absorbance |
|
1 |
2 |
0.154 |
|
2 |
4 |
0.363 |
|
3 |
6 |
0.594 |
|
4 |
8 |
0.732 |
|
5 |
10 |
0.946 |
FTIR Spectroscopy of Drug
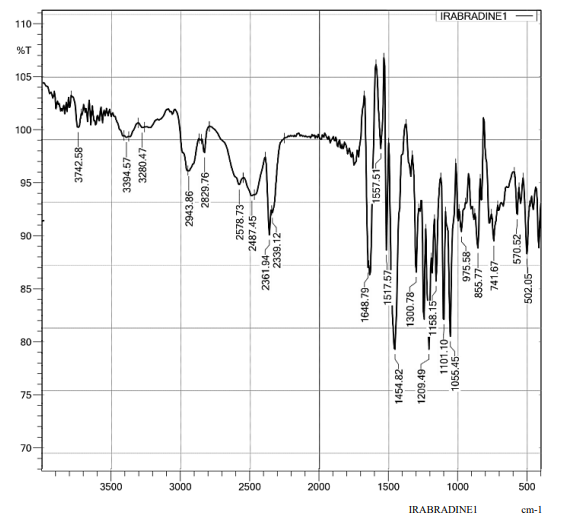
The drug identity was confirmed by studying the IR spectra of Ivabradine Hydrochloride. The observed peaks of Ivabradine Hydrochloride were found to be in the range which confirmed that the drug obtained was not degraded and were suitable for the use of experiment and developing formulations. The characteristic bands of drug are reported in the following table 8.
? ? ? ?
? ? ? ? ? ? 
? ? ? ?
Figure 5: FTIR Spectroscopy of Drug
Table 8: FTIR Spectrum Peaks of Ivabradine Hydrochloride
|
Sr. No. |
Functional group |
Observed peaks (cm-1) |
|
1 |
O-CH3 |
1209.49 |
|
2 |
C=O |
1648.79 |
|
3 |
C-H stretching |
2943.86 |
|
4 |
C-N Stretching |
1055.45 |
|
5 |
N-H Stretching |
3394.57 |
|
6 |
C=C stretching |
1517.51 |
Drug ? Excipient Compatibility Study by FTIR Spectroscopy
 10.5281/zenodo.14361372