

We use cookies to ensure our website works properly and to personalise your experience. Cookies policy
Department of Practice of Medicine,A M Shaikh Homoeopathic Medical College, Hospital And PG Research Centre, Belagavi.
Purpose: This study was Conducted to assess the prevalence of Obesity Class I and Class II using Body mass index (BMI) among vegetarian and non vegetarians aged of 30-50 years in kadoli population. Background: Obesity in the university population is a complex phenomenon influenced by multiple factors. The most common causes of obesity include unhealthy eating habits, lack of physical activity, academic stress, irregular schedules, lack of time, consumption of harmful substances (tobacco and alcohol), and genetic factors . Body mass index (BMI) is defined as a measure that compares an individual’s weight in relation to height; it is calculated by dividing weight in kilograms by the square of height in meters (kg/m2). Methods: A survey study of 62 participants aged 30–50 years of Obesity class I and Class II of both vegetarian and Non-vegetarian were included in the study. Samples collected from the adoptive village (Kadoli) of A. M. Shaikh Homoeopathic Medical College, Belagavi. Results: A total of 62 participants aged 30–50 years were included in the study. The findings showed that Obesity Class I was present in 33 participants, whereas Obesity Class II was observed in 29 participants. The study concludes that dietary pattern (vegetarian or non-vegetarian) does not have a significant association with the prevalence of BMI-based Obesity Class I and II among individuals aged 30–50 years in the Kadoli population. Conclusion: The study found no statistically significant difference in the prevalence of class I and Class II obesity between vegetarian and non-vegetarian Participants. The acceptance of the null hypothesis suggest that dietary pattern alone was not associated with obesity in the sample.
Body mass index (BMI) is defined as a measure that compares an individual’s weight in relation to height; it is calculated by dividing weight in kilograms by the square of height in meters (kg/m2). BMI is widely used to classify individuals into different weight categories, which helps identify potential health risks associated with underweight and excess body weight (overweight/obesity). Excess body weight in young people, particularly among university students, represents one of the most important public health problems worldwide (1,).
A healthy lifestyle is defined as a set of daily behaviours and choices that contribute to an individual’s well-being and optimal health. These behaviours include a variety of practices and habits such as healthy eating and nutrition, regular physical activity, adequate water consumption, exposure to sunlight, adequate sleep, among others.
Obesity in the university population is a complex phenomenon influenced by multiple factors. The most common causes of obesity include unhealthy eating habits, lack of physical activity, academic stress, irregular schedules, lack of time, consumption of harmful substances (tobacco and alcohol), and genetic factors . Some studies suggest differences in the prevalence of obesity by field of obesity.
There is a critical need to control the obesity epidemic in light of the increasing prevalence of overweight and obesity around the world. Two extensive reviews of observational studies that used eating pattern methods suggest that a plant-based diet high in fibre rich foods, such as vegetables ,fruits, cereals, whole grains, and legumes, is inversely related to body mass index (BMI),overweight, and Protective eating patterns may also include lean protein foods such as chicken, fish, soy products, and reduced-fat dairy products.(2)
Obesity has emerged as a major public health concern worldwide, contributing significantly to the burden of non communicable diseases such as Diabetes, Hypertension, Cardio-vascular disorders and certain cancers. Body mass index (BMI) is widely used as simple and cost effective tool to assess obesity and related health risks in populations. Dietary habits play a critical role in determining an individual’s nutritional status and overall health outcomes, with vegetarian and non –vegetarian often differing in caloric density, fat content, fibre intake and nutrient composition. This study is an attempt to understand the Prevalence rate for research and academic purpose and to raise public awareness about Obesity among vegetarian and non-vegetarian population.
MATERIALS AND METHODS:
The subjects for this study will be collected from the adopted Village (kadoli) of A. M. Shaikh Homoeopathic Medical College, Belagavi.Purposive sampling procedure for selection of subjects.On the basis of inclusion and exclusion criteria like Inclusion criteria: Subjects From kadoli who are willing to participate and subjects of both sex and between the age group of 30-50 years. Exclusion Criteria: Subjects with Life style disorders are excluded from the studyand subjects complicated with other Organic diseases , 62 Subjects were included This study was conducted over a period of 1 year.
Results: RESULTS:
A total of 62 participants aged 30–50 years were included in the study. The findings showed that Obesity Class I was present in 33 (53.2%) participants, whereas Obesity Class II was observed in 29 (46.8%) participants. Obesity was more prevalent among individuals aged 41–50 years (79.0%) compared to those aged 30–40 years (21.0%). Males constituted the majority of the study population (62.9%).
The association between dietary pattern and obesity class was assessed using the Pearson’s Chi-square test, which showed no statistically significant association between vegetarian/mixed dietary pattern and obesity class (χ² = 0.699, df = 1, p = 0.403). Further, comparison of BMI between vegetarian and mixed diet groups using the Mann–Whitney U test revealed no significant difference in BMI distribution between the two groups (U = 451.500, Z = -0.298, p = 0.765).
Although Obesity Class II was slightly more prevalent among vegetarians (51.4%) compared to the mixed diet group (40.7%), this difference was not statistically significant.
Therefore, based on the statistical analysis, there was no significant difference in the prevalence of BMI-based Obesity Class I and Class II between vegetarian and non-vegetarian populations of Kadoli village. Since the obtained p-value was greater than 0.05, the difference was not statistically significant. Hence, the Null Hypothesis (Hâ‚€) is accepted, and the Alternative Hypothesis (Hâ‚) is rejected. Thus, the study concludes that dietary pattern (vegetarian or non-vegetarian) does not have a significant association with the prevalence of BMI-based Obesity Class I and II among individuals aged 30–50 years in the Kadoli population.
AGE IN YEARS:
| DIET | Total | ||||||
|---|---|---|---|---|---|---|---|
| Mixed | Veg | ||||||
| N | % | N | % | N | % | ||
| AGE | 30- 40 YEARS | 6 | 22.2% | 7 | 20.0% | 13 | 21.0% |
| 41- 50 YEARS | 21 | 77.8% | 28 | 80.0% | 49 | 79.0% | |
| Total | 27 | 100.0% | 35 | 100.0% | 62 | 100.0% | |
[Figure - see the formatted PDF]
Inference: Among the 62 study participants, obesity was predominantly observed in the 41–50 years age group, comprising 49 (79.0%) individuals, whereas only 13 (21.0%) participants belonged to the 30–40 years age group. Within the mixed diet group, 21 (77.8%) participants were aged 41–50 years and 6 (22.2%) were aged 30–40 years. Similarly, in the vegetarian group, 28 (80.0%) participants were aged 41–50 years and 7 (20.0%) were aged 30–40 years.
The Pearson's Chi-square test showed no statistically significant association between age group and dietary pattern among obese participants (χ² = 0.045, df = 1, p = 0.831; p > 0.05). Thus, although obesity was highly prevalent in the 41–50 years age group, the distribution of age groups did not differ significantly between the vegetarian and mixed diet groups.
GENDER:
| DIET | Total | ||||||
|---|---|---|---|---|---|---|---|
| Mixed | Veg | ||||||
| N | % | N | % | N | % | ||
| GENDER | F | 9 | 33.3% | 14 | 40.0% | 23 | 37.1% |
| M | 18 | 66.7% | 21 | 60.0% | 39 | 62.9% | |
| Total | 27 | 100.0% | 35 | 100.0% | 62 | 100.0% | |
[Figure - see the formatted PDF]
Inference: Among the 62 study participants, 39 (62.9%) were males and 23 (37.1%) were females, indicating that obesity was more prevalent among males in the study population. In the mixed diet group, 18 (66.7%) participants were males and 9 (33.3%) were females. Similarly, in the vegetarian group, 21 (60.0%) participants were males and 14 (40.0%) were females.
The Pearson's Chi-square test revealed no statistically significant association between gender and dietary pattern (χ² = 0.290, df = 1, p = 0.590; p > 0.05). Thus, although a greater proportion of obese participants were males, the distribution of gender did not differ significantly between the vegetarian and mixed diet groups.
OCCUPATION:
| DIET | Total | ||||||
|---|---|---|---|---|---|---|---|
| Mixed | Veg | ||||||
| N | % | N | % | N | % | ||
| OCCUPATION | Anganwadi worker | 1 | 3.7% | 0 | 0.0% | 1 | 1.6% |
| Driver | 1 | 3.7% | 0 | 0.0% | 1 | 1.6% | |
| Engineer | 0 | 0.0% | 1 | 2.9% | 1 | 1.6% | |
| Factory worker | 1 | 3.7% | 0 | 0.0% | 1 | 1.6% | |
| Farmer | 14 | 51.9% | 17 | 48.6% | 31 | 50.0% | |
| Housewife | 4 | 14.8% | 8 | 22.9% | 12 | 19.4% | |
| Milkman | 0 | 0.0% | 1 | 2.9% | 1 | 1.6% | |
| Shopkeeper | 2 | 7.4% | 3 | 8.6% | 5 | 8.1% | |
| Teacher | 2 | 7.4% | 1 | 2.9% | 3 | 4.8% | |
| Worker | 2 | 7.4% | 4 | 11.4% | 6 | 9.7% | |
| Total | 27 | 100.0% | 35 | 100.0% | 62 | 100.0% | |
[Figure - see the formatted PDF]
Inference: Among the 62 study participants, farming was the most common occupation, accounting for 31 (50.0%) participants, followed by housewives (12; 19.4%), workers (6; 9.7%), shopkeepers (5; 8.1%), and teachers (3; 4.8%). Other occupations, including Anganwadi worker, driver, engineer, factory worker, and milkman, were represented by one participant (1.6%) each. In both the mixed diet and vegetarian groups, farmers constituted the largest occupational category (51.9% and 48.6%, respectively).
The Pearson's Chi-square test showed no statistically significant association between occupation and dietary pattern (χ² = 6.906, df = 9, p = 0.647; p > 0.05). Therefore, the occupational distribution was comparable between the vegetarian and mixed diet groups.
DESCRIPTIVE STATISTICS:
| Variable | N | Minimum | Maximum | Mean | Std. Deviation | Median | IQR | 95% CI for Mean |
|---|---|---|---|---|---|---|---|---|
| Systolic BP (mmHg) | 62 | 110 | 160 | 128.06 | 10.217 | 130.00 | 20 | 125.47–130.66 |
| Diastolic BP (mmHg) | 62 | 60 | 100 | 77.58 | 8.235 | 80.00 | 10 | 75.49–79.67 |
| Diastolic BP (mmHg) | 62 | 60 | 100 | 77.58 | 8.235 | 80.00 | 10 | 75.49–79.67 |
| GRBS (mg/dL) | 62 | 93 | 220 | 144.58 | 30.679 | 140.50 | 47 | 136.79–152.37 |
| Height (cm) | 62 | 142 | 168 | 156.82 | 6.331 | 156.00 | 10 | 155.21–158.43 |
| Weight (kg) | 62 | 63 | 98 | 85.76 | 7.783 | 86.00 | 12 | 83.78–87.73 |
| BMI (kg/m²) | 62 | 30.1 | 39.8 | 34.903 | 2.9258 | 34.750 | 5.3 | 34.160–35.646 |
Inference: The descriptive statistics of the 62 study participants showed a mean systolic blood pressure of 128.06 ± 10.22 mmHg (median: 130.00 mmHg; IQR: 20 mmHg; 95% CI: 125.47–130.66 mmHg) and a mean diastolic blood pressure of 77.58 ± 8.24 mmHg (median: 80.00 mmHg; IQR: 10 mmHg; 95% CI: 75.49–79.67 mmHg). The mean GRBS level was 144.58 ± 30.68 mg/dL (median: 140.50 mg/dL; IQR: 47 mg/dL; 95% CI: 136.79–152.37 mg/dL). The participants had a mean height of 156.82 ± 6.33 cm (median: 156.00 cm; IQR: 10 cm; 95% CI: 155.21–158.43 cm) and a mean weight of 85.76 ± 7.78 kg (median: 86.00 kg; IQR: 12 kg; 95% CI: 83.78–87.73 kg). The mean BMI was 34.90 ± 2.93 kg/m² (median: 34.75 kg/m²; IQR: 5.3 kg/m²; 95% CI: 34.16–35.65 kg/m²), indicating that, on average, the study participants fell within the WHO Obesity Class I category, with BMI values ranging from 30.1 to 39.8 kg/m², encompassing both Obesity Class I and Class II individuals included in the study.
NORMALITY TEST:
| Tests of Normality | ||||||
|---|---|---|---|---|---|---|
| Kolmogorov-Smirnov | Shapiro-Wilk | |||||
| Statistic | df | Sig. | Statistic | df | Sig. | |
| BMI | .131 | 62 | .010 | .931 | 62 | .002 |
Inference (Normality Test): The normality of BMI was assessed using the Shapiro–Wilk test, which showed that BMI was not normally distributed (W = 0.931, p = 0.002). Therefore, non-parametric tests were used for further analysis. The Mann–Whitney U test was applied to compare BMI values between vegetarian and mixed diet groups, while the Chi-square test of independence was used to assess the association between dietary pattern and BMI-based obesity classes.
CHI SQUARE TEST TO ASSESS THE ASSOCIATION BETWEEN OBESITY CLASS AND DIET:
| OBESITY CLASS * DIET Crosstabulation | |||||
|---|---|---|---|---|---|
| DIET | Total | ||||
| Mixed | Veg | ||||
| OBESITY CLASS | Class I | Count | 16 | 17 | 33 |
| Expected Count | 14.4 | 18.6 | 33.0 | ||
| Class II | Count | 11 | 18 | 29 | |
| Expected Count | 12.6 | 16.4 | 29.0 | ||
| Total | Count | 27 | 35 | 62 | |
| Expected Count | 27.0 | 35.0 | 62.0 | ||
| Chi-Square Tests | ||||||
|---|---|---|---|---|---|---|
| Value | df | Asymptotic Significance (2-sided) | Exact Sig. (2-sided) | Exact Sig. (1-sided) | ||
| Pearson Chi-Square | .699 | 1 | .403 | |||
[Figure - see the formatted PDF]
Inference: Among the 62 study participants, 33 (53.2%) were classified as Obesity Class I and 29 (46.8%) as Obesity Class II. In the mixed diet group, 16 (59.3%) participants had Obesity Class I, while 11 (40.7%) had Obesity Class II. In the vegetarian group, 17 (48.6%) participants had Obesity Class I and 18 (51.4%) had Obesity Class II. Thus, Obesity Class I was slightly more common among participants consuming a mixed diet, whereas Obesity Class II was slightly more common among vegetarians.
The Pearson's Chi-square test demonstrated no statistically significant association between dietary pattern and obesity class (χ² = 0.699, df = 1, p = 0.403; p > 0.05). Therefore, the distribution of Obesity Class I and Obesity Class II was similar between the vegetarian and mixed diet groups, indicating that dietary pattern was not significantly associated with obesity class in the study population.
MANN WHITNEY U TEST:
| Ranks | ||||
|---|---|---|---|---|
| DIET | N | Mean Rank | Sum of Ranks | |
| BMI | VEG | 35 | 32.10 | 1123.50 |
| MIXED | 27 | 30.72 | 829.50 | |
| Total | 62 | |||
| BMI | |
|---|---|
| Mann-Whitney U | 451.500 |
| Wilcoxon W | 829.500 |
| Z | -.298 |
|---|---|
| Asymp. Sig. (2-tailed) | .765 |
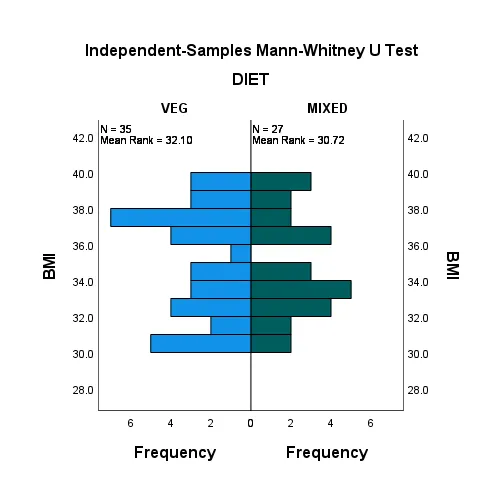
Inference: The difference in BMI distribution between the vegetarian and mixed diet groups was assessed using the Mann–Whitney U test, as BMI was found to be non-normally distributed based on the Shapiro–Wilk test.
The vegetarian group (n = 35) showed a slightly higher mean rank of BMI (32.10) compared to the mixed diet group (n = 27) with a mean rank of 30.72. However, the difference in BMI distribution between the two dietary groups was not statistically significant (Mann–Whitney U = 451.500, Z = -0.298, p = 0.765).
Since the p-value was greater than 0.05, there was no significant difference in BMI values between vegetarian and mixed diet groups among the study participants. Therefore, dietary pattern was not significantly associated with BMI-based obesity status in the Kadoli population aged 30–50 years.
The present cross-sectional study titled “A Cross-Sectional Assessment of Obesity Class I and II Using BMI Among Vegetarian and Non-Vegetarian Aged 30–50 Years of Kadoli Population” was conducted to assess the prevalence of BMI-based Obesity Class I and Class II and to determine the association between dietary pattern and obesity status among the study population.
FINAL CONCLUSION: A total of 62 participants aged 30–50 years were included in the study. The findings showed that Obesity Class I was present in 33 (53.2%) participants, whereas Obesity Class II was observed in 29 (46.8%) participants. Obesity was more prevalent among individuals aged 41–50 years (79.0%) compared to those aged 30–40 years (21.0%). Males constituted the majority of the study population (62.9%).
The association between dietary pattern and obesity class was assessed using the Pearson’s Chi-square test, which showed no statistically significant association between vegetarian/mixed dietary pattern and obesity class (χ² = 0.699, df = 1, p = 0.403). Further, comparison of BMI between vegetarian and mixed diet groups using the Mann–Whitney U test revealed no significant difference in BMI distribution between the two groups (U = 451.500, Z = -0.298, p = 0.765).
Although Obesity Class II was slightly more prevalent among vegetarians (51.4%) compared to the mixed diet group (40.7%), this difference was not statistically significant.
Therefore, based on the statistical analysis, there was no significant difference in the prevalence of BMI-based Obesity Class I and Class II between vegetarian and non-vegetarian populations of Kadoli village. Since the obtained p-value was greater than 0.05, the difference was not statistically significant. Hence, the Null Hypothesis (Hâ‚€) is accepted, and the Alternative Hypothesis (Hâ‚) is rejected.
Thus, the study concludes that dietary pattern (vegetarian or non-vegetarian) does not have a significant association with the prevalence of BMI-based Obesity Class I and II among individuals aged 30–50 years in the Kadoli population.
DISCUSSION:
The Present Cross sectional study assessed the prevalence of Class I and Class II obesity using BMI among Vegetarian and Non-vegetarian. The statistical analysis shows no significant difference in the distribution of obesity classes between the two dietary groups. therefore, the null hypothesis was accepted, indicating that dietary pattern (vegetarian and non-vegetarian) was not significantly associated with class I and Class II obesity in the study population. Although diet plays an important role in body weight regulation, obesity is multifactorial condition influenced by several factors, including total energy intake, physical activity, genetic predisposition, socio-economic status, sleep patterns, stress and life style behaviours. The absence of statistically significant difference suggests that simply following a vegetarian or non-vegetarian diet may not independently determine the obesity status. The Quantity and Quality of food consume, portion sizes, and overall dietary habits are likely to have greater influence than the type of diet alone. The findings are consistent with studies that have reported no significant association between dietary preference and obesity after accounting for other lifestyle and demographic factors. Both vegetarian and Non-vegetarian diets can be either healthy or unhealthy depending on food choices, nutrient composition , calorie intake. Therefore, maintaining a balance diet and adopting a healthy lifestyle remain essential for obesity prevention regardless of dietary preference. As this was a cross sectional study, casual relationships cannot be established. The study reflects obesity status at a single point in time and does not evaluate long term dietary patterns or changes in body weight furthermore, BMI, while widely used for obesity classification, does not distinguish between body fat and lean muscle mass, which may affect the accuracy of obesity assessment.
CONCLUSION:
The study found no statistically significant difference in the prevalence of class I and Class II obesity between vegetarian and non-vegetarian Participants. The acceptance of the null hypothesis suggest that dietary pattern alone was not associated with obesity in the sample. Limitation of this study is the subjects for the study were taken only from the adoptive village (Kadoli) of A. M. Shaikh homoeopathic medical college and Hospital, Belgaum. Based on the inclusion and exclusion criteria.
RECOMMENDATION FOR FURTHER STUDY: Future Research with larger sample sizes, longitudinal study designs, and detailed dietary assessments is recommended to better understand the relationship between Dietary habits and obesity.
Financial support and sponsorship
Nil
Conflict of interest
Nil
REFERENCES

Dr. Laxmi Rachanagouda Patil, Dr. Susmeet S. V., Dr. Sushmita Mudenur, A Cross Sectional Assessment of Obesity Class I and II Using BMI Among Vegetarian and NON Vegatarian Aged 30-50 Years of Kadoli Population, Int. J. Sci. R. Tech., 2026, 3 (10), 1333-1341. https://doi.org/10.5281/zenodo.23684108
 10.5281/zenodo.23684108