

We use cookies to ensure our website works properly and to personalise your experience. Cookies policy
Brainware University, West Bengal, India
Outcome-Based Education (OBE) becomes meaningful only when stated learning outcomes are connected to a transparent method of assessment, attainment calculation, and follow-up action. In practice, institutions often define Course Outcomes (COs), Program Outcomes (POs), and Program-Specific Outcomes (PSOs) correctly but face difficulty in converting marks, survey responses, and mapping values into an attainment process that faculty can apply consistently. This paper presents a practical framework for that task. It brings together CO-PO-PSO mapping, direct and indirect assessment, threshold-based attainment levels, programme-level aggregation, and gap analysis within one operational workflow. Direct evidence is drawn from Continuous Internal Assessment (CIA) and Term End Examination (TEE), while indirect evidence is obtained through course exit, programme exit, and alumni surveys. The framework also explains how attainment may be handled for project and internship courses, where rubric-based reviews and viva-voce assessment form a substantial part of the evidence. Worked calculations and illustrative charts are used to show how course-level results can be carried forward to PO/PSO attainment and then compared with predefined targets. The purpose is not to report the effect of a particular intervention, but to document a repeatable process that supports academic review, curriculum refinement, and continuous improvement under an OBE system.
Higher education has gradually moved from describing what is taught to demonstrating what students are able to achieve by the end of a course or programme. Outcome-Based Education (OBE) places this demonstrable learning at the centre of curriculum planning and assessment [1], [2]. The shift sounds straightforward, but it changes the role of assessment: marks are no longer used only to decide whether a student passes. They also become evidence for judging whether specific learning outcomes have been attained. OBE therefore depends on clearly stated outcomes, appropriate assessment tasks, and a documented process for interpreting the evidence [3].
The practical difficulty lies in maintaining that connection from the syllabus to the final programme review. A course may have well-written COs, yet the attainment process becomes weak if examination questions are not tagged to those COs, mapping values are applied inconsistently, or survey results are treated independently of direct assessment. The same problem appears at programme level when course results are averaged without a clear rule for relating them to POs and PSOs. A workable OBE system therefore needs a method that faculty members can follow in the same way across theory, practical, project, and internship courses.
This paper documents such a method. The framework begins with course articulation and CO-PO-PSO mapping, then moves through target setting, question-wise assessment, direct and indirect attainment, and programme-level aggregation. Bloom's taxonomy is used to support progression from lower-order to higher-order learning expectations [5], [6]. The mapping stage connects course-level learning to broader programme expectations, while the assessment stage links those expectations to evidence collected during the semester.
Both direct and indirect evidence are retained because they answer different questions. Examinations, assignments, practical work, projects, and other assessed tasks show what students actually demonstrated; course exit and programme-level surveys capture how learners and alumni perceive the extent to which those outcomes were achieved [7]. The framework closes the loop through gap analysis: attainment is compared with the target, the reason for a shortfall is examined, and the next cycle is adjusted through changes in teaching, assessment, or the target itself. This continuous-review logic is consistent with the broader purpose of OBE and accreditation-oriented quality assurance [8].
2. FRAMEWORK AND ATTAINMENT METHODOLOGY
2.1 Course Articulation Matrix in the Syllabus
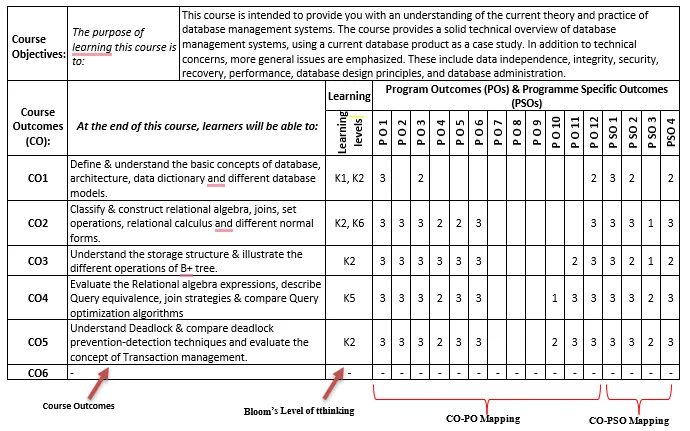
Figure 1. Illustrative CO-PO-PSO articulation matrix
Figure 1 shows how each Course Outcome is related to the relevant Program Outcomes and Program-Specific Outcomes. The same principle can be used for theory, practical, project, review, and final viva-voce components. The matrix is not merely a reporting table; it establishes the route by which evidence generated in a course contributes to programme-level attainment.
Example: Course Assessment Plan in the Syllabus
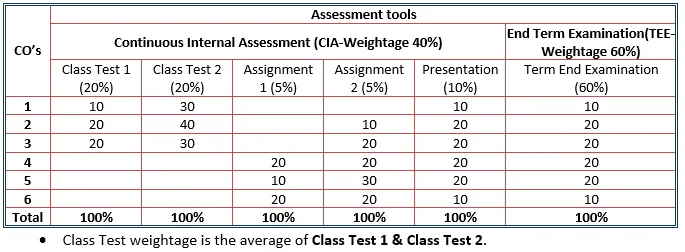
2.2 LEVEL OF CORRELATION AND ATTAINMENT
Level of Correlation / Mapping Factor
The mapping factor expresses the strength of the relationship between two outcome components. In a CO-PO matrix, it indicates how strongly a particular CO contributes to a particular PO. Using a common scale across courses reduces subjective variation in mapping.
3 - Substantial/High mapping: the CO makes a strong contribution to the PO.
2 - Moderate mapping: the CO makes a clear but intermediate contribution to the PO.
1 - Low mapping: the CO contributes to the PO to a limited extent.
2.3 CO Attainment Targets
Attainment targets should be fixed before course delivery begins. A three-level scale is convenient because it distinguishes high, moderate, and minimum attainment while remaining simple enough for routine academic use. The course coordinator records the threshold and the expected proportion of students for each level before the semester assessment data are available.
An illustrative target structure is given below:
Level 3: x% of students score at least p% of the marks allocated to the CO.
Level 2: y% of students score at least p% of the marks allocated to the CO.
Level 1: z% Students scoring >= p% of max marks allocated to CO
p% represents the proficiency threshold for a CO; for example, the threshold may be set at 50%.
x% represents the expected proportion of students for high attainment; an illustrative value is 65%.
y% represents the expected proportion of students for moderate attainment; an illustrative value is 55%.
z% represents the expected proportion of students for minimum attainment; an illustrative value is 45%.
2.4 ATTAINMENT OF COURSE OUTCOMES
CO attainment is established from two complementary sources. Direct attainment is calculated from student performance in assessment instruments linked to the relevant COs. Indirect attainment is obtained from structured feedback, most commonly a course exit survey. Keeping these two sources separate until the final combination makes the process easier to audit.
Direct CO Attainment

Indirect CO Attainment
2.5 Gap Analysis
3. CALCULATION OF CO ATTAINMENT
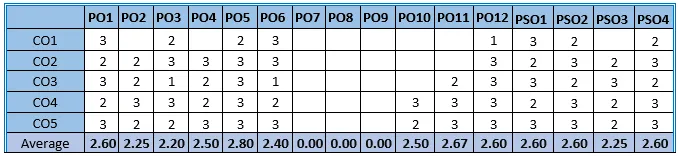
Step 1: Define three to six COs for the course and map them to the relevant POs/PSOs using the adopted 0-3 scale. The course coordinator also records the CO attainment targets before teaching begins. The average mapping values shown in the matrix provide the programme linkage used later in the calculation.
Step 2: For each CIA component, record the maximum marks assigned to every question and tag each question to its corresponding CO.
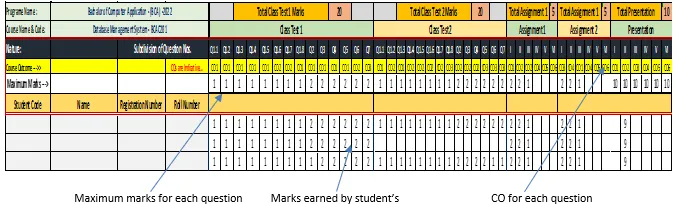
Step 3: Enter each student's marks question by question. For a mandatory question that is not attempted, record zero so that the dataset reflects the actual assessment response.
Step 4: Determine the number of students who attempted each question.
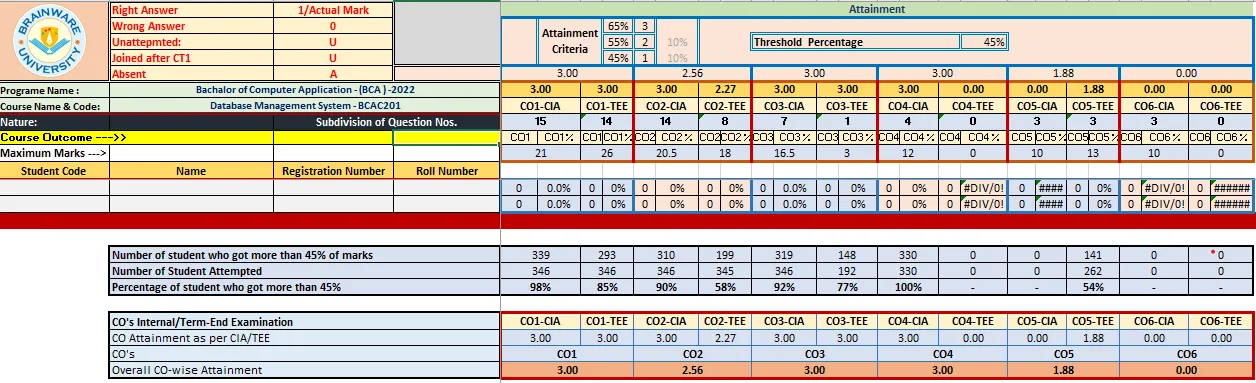
Note: Where a change of scale is required, apply it consistently before comparing performance with the stated proficiency threshold.
Step 5: For every question, count the students who obtained at least p% of the available marks.
Step 6: Convert that count into the percentage of students meeting or exceeding p% for the question.
Percentage of students meeting the proficiency threshold =
Step 7: For each CO, calculate the average percentage of students who met or exceeded p% across all questions mapped to that CO.
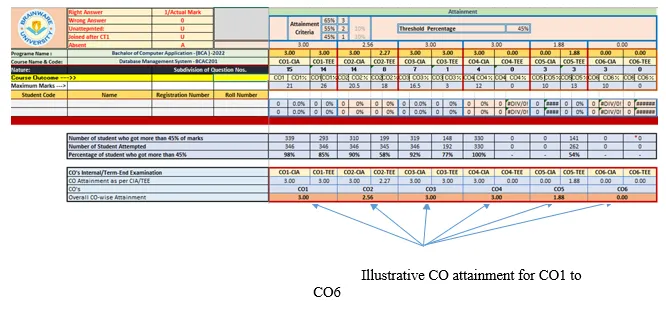
Step 8: Convert the percentage obtained for each CO into the adopted attainment level using the predefined x, y, and z cut-offs
CO Attainment Level= 3, if (the avg. % of students who got >=p% for each CO) >=x
= 2, if (the avg. % of students who got >=p% for each CO) >=y
= 1, if (the avg. % of students who got >=p% for each CO) >=z
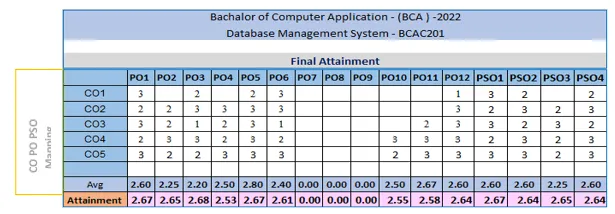
The CO-PO contribution is then calculated using the CO attainment level and the corresponding CO-PO mapping value:

= [9+5.12+9+6+5.64/13]
= [34.76/13]
= 2.67
Step 9: Repeat Steps 2-8 for all CIA and TEE components included in the course assessment plan.
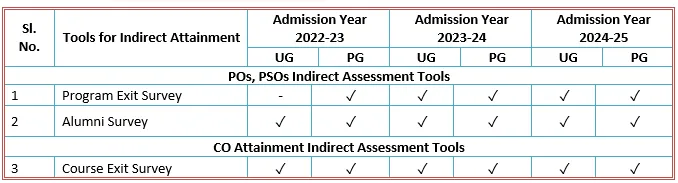
Step 10: Calculate the indirect attainment component using the survey tools defined for the course and programme.
Indirect attainment is supported by three main feedback tools: the Course Exit Survey, Program Exit Survey, and Alumni Survey. Each tool captures a different stage of the learner experience and is therefore used for a different level of outcome interpretation.
3.1 Course Exit Survey (Theory and Practical)
The course exit survey is administered at the end of the semester. Its purpose is to obtain student feedback on the course after teaching and assessment have been completed. The survey may cover the following areas:
3.2 Program Exit Survey (PES)
The Program Exit Survey is completed by graduating students and captures their overall experience of the programme. Responses are recorded on a five-point Likert scale and may address the following dimensions:
PO and PSO Attainment through the Program Exit Survey
For each survey question, first calculate the proportion of respondents who selected a rating of 3 or above:
Q[x] (%) = (Number of students who provided 3 or more marks for Question x / Total number of students) * 100
Here, x denotes the individual question in the Program Exit Survey.
The question-level attainment may then be assigned as follows:
3.3 Alumni Survey (AS)
The Alumni Survey extends programme feedback beyond graduation and is used to examine the continued relevance of POs and PSOs. The survey may include:
PO and PSO Attainment through the Alumni Survey
Question-level percentage is calculated in the same manner as for the Program Exit Survey:
Q[x] (%) = (Number of students who provided 3 or more marks for Question x / Total number of students) * 100
The same three-level interpretation is applied:
3.4 Programme-Level Indirect Attainment
3.5 Overall PO and PSO Attainment
3.6 Tools and Process for Indirect PO Attainment
|
PO Attainment Tool |
Process |
|
Program Exit Survey |
Feedback is collected from students upon program completion, covering their overall experience. |
|
Alumni Survey |
Feedback is collected from alumni during meetups and graduation days based on various parameters. |
Step 11: Convert the course exit survey responses to their numerical equivalents and calculate the CO-wise response percentage.
|
Survey Responses |
Strongly Agree |
Agree |
Neutral |
Disagree |
Strongly Disagree |
|
Numerical Equivalent |
5 |
4 |
3 |
2 |
1 |
% of Survey responses (CO Wise)
Step 12: Convert the CIA percentage into an attainment level using the same x, y, and z cut-offs defined at the start of the course.
Attainment Level for Continuous Internal Assessment (CIA) = 3 if CIA >= x%
= 2 if y% <= CIA < x%
= 1 if z% <= CIA < y%
Step 13: For the TEE component, use the percentage of students who obtained more than 60% of the marks as the TEE performance indicator for the COs.
Apply the same attainment-level rules to the TEE value.
Step 14: Calculate the Direct CO Attainment Score by combining CIA and TEE according to the approved weightage.
Direct Attainment Score = 40% of CIA + 60% of TEE
Translate the Direct Attainment Score into Level 1, 2, or 3 using the predefined cut-offs:
Direct attainment level = 3, if direct Attainment Score >= x%
= 2 if y% <= direct Attainment Score < x%
= 1 if z% <= direct Attainment Score < y%
Step 15: Use the percentage obtained from the exit survey as the Indirect Attainment Score.
Convert the indirect score to an attainment level using the same threshold logic.
Step 16: Combine the direct and indirect components to obtain the Final Attainment Score.
Final Attainment Score = 80% of Direct Attainment Score+ 20% of Indirect Attainment Score
The Final Attainment Score is then expressed as an attainment level using the same x, y, and z boundaries:
Final attainment level = 3, if final Attainment Score >= x%
= 2 if y% <= final Attainment Score < x%
= 1 if z% <= final Attainment Score < y%
4. CALCULATION OF PO/PSO ATTAINMENT
Step 1: PO/PSO attainment is calculated from three inputs:
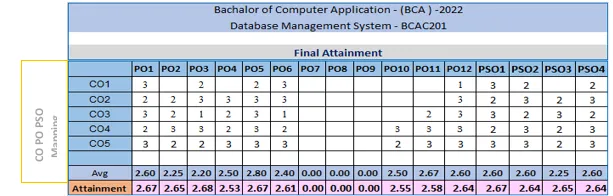
Step 2: Use these inputs to calculate the weighted contribution of each CO to the mapped PO/PSO:


ii. Using the same illustration, the attainment for PO1 is obtained from the weighted CO contributions shown below:
= [9+5.12+9+6+5.64/13]
= [34.76/13]
= 2.67
Step 3: Repeat the calculation for every PO and PSO mapped to the course.
Step 4: Calculate the average attainment value for each PO/PSO so that it can be compared with the stated programme target.
5. COMPARISON CHARTS
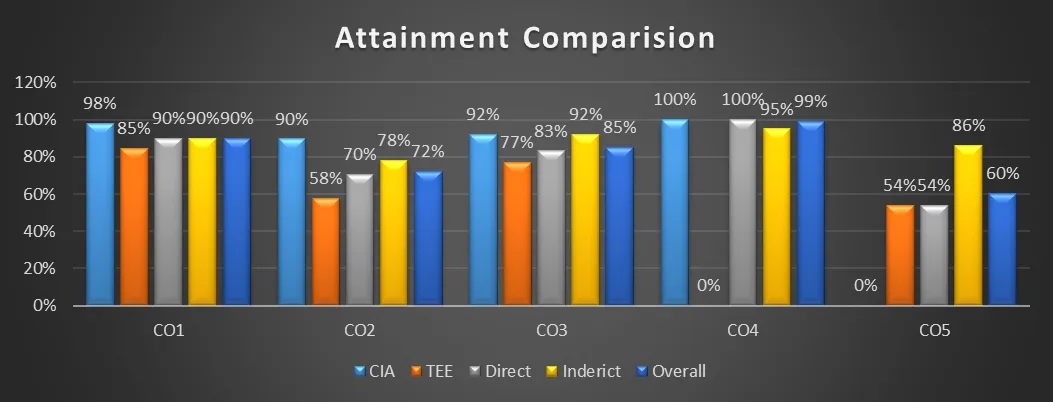
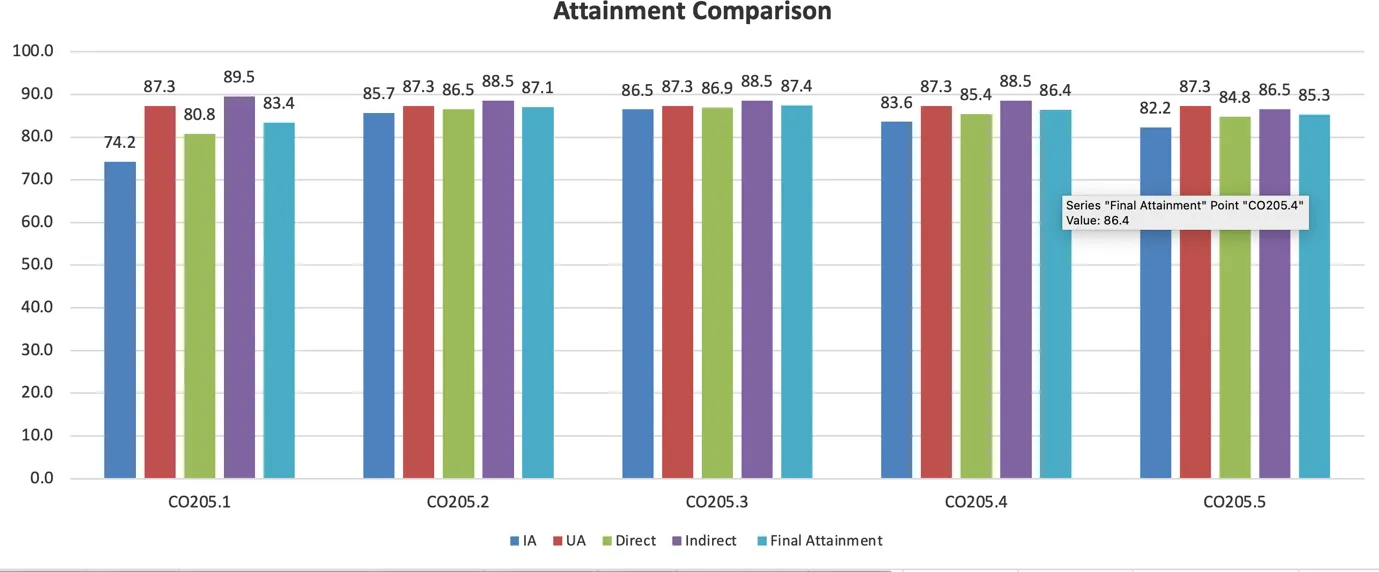
5.1 CO Attainment Score Comparison
The comparison chart brings together CIA, TEE, Direct Attainment, Indirect Attainment, and Final Attainment for each CO. Viewing these values side by side helps identify whether a gap originates mainly in assessed performance or in student perception.
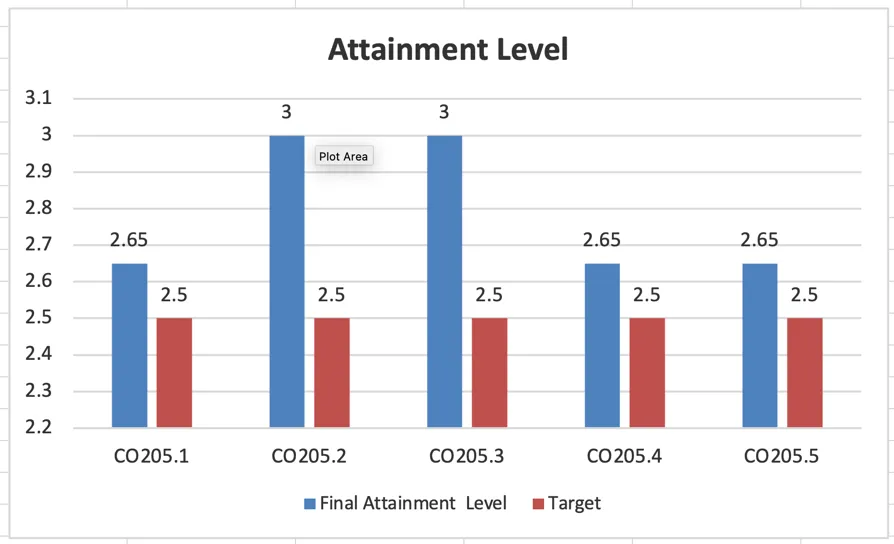
5.2 CO Attainment Level Comparison
The final attainment level is compared with the target level for each outcome. The comparison indicates which outcomes have met the planned standard and which require further review.
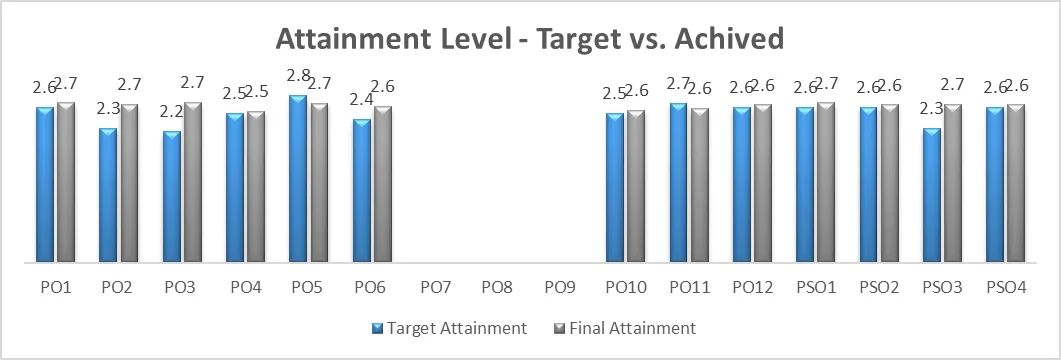
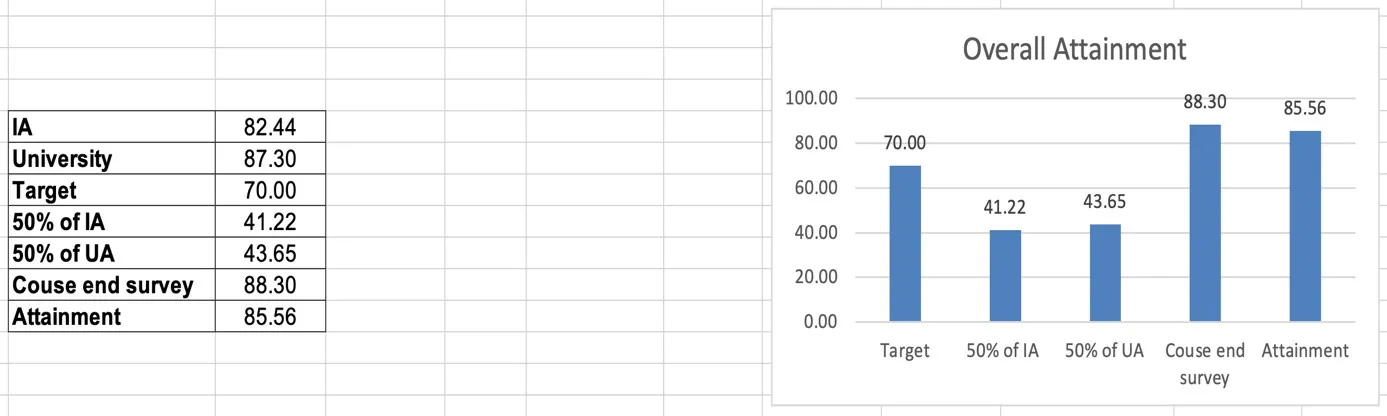
5.3 Overall Attainment Comparison
The overall chart compares the target with the weighted CIA and TEE components, the course exit survey contribution, and the final attainment value.
6. CO ATTAINMENT FOR PROJECTS AND INTERNSHIPS
Step 1: Define the COs specifically for the project or internship course.
Step 2: Map those COs to the relevant POs and PSOs using the adopted correlation scale.
Step 3: Assess student progress through scheduled reviews by the project panel. The first, second, and third reviews are completed before the final viva-voce and use rubrics approved by the Board of Studies (BoS).
|
Assessments |
Reviews |
Agenda |
Rubrics for assessment |
Weightage of marks in the review |
Overall weightage of the marks |
|
Internal |
Review 1 |
Project Synopsis/ Proposal Evaluation |
Rubric R1 |
9 |
40 |
|
Review 2 |
Mid-Term Project Evaluation |
Rubric R2 |
16 |
||
|
Review 3 |
End Semester Project Report Evaluation |
Rubric R3 |
15 |
||
|
External |
Evaluation by a panel of experts consisting internal & external faculty*. |
Project Report Evaluation, Presentation and Viva Voce |
Rubric R4 |
60 |
60 |
|
*Faculty from another university |
Total |
100 |
100 |
||
Table 1. Weightage of marks used for evaluation of project courses
Step 4: Record review marks against the approved rubric. Each rubric component should be mapped to the CO that it is intended to assess.
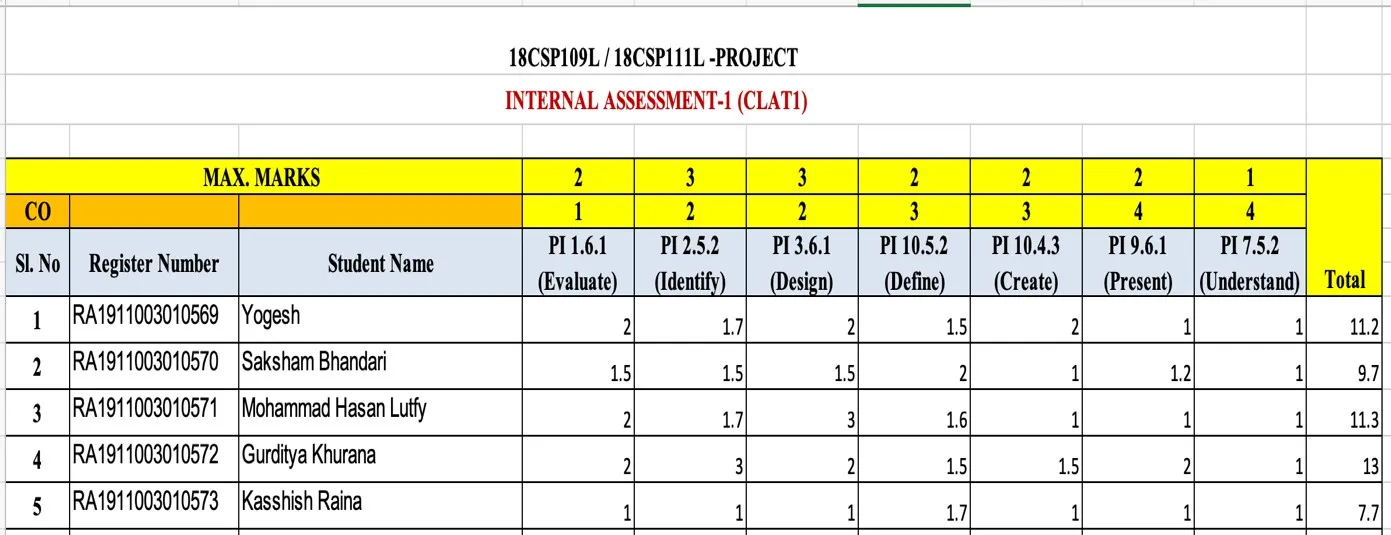
Step 5: Calculate the attainment value for each CO from the recorded review evidence.
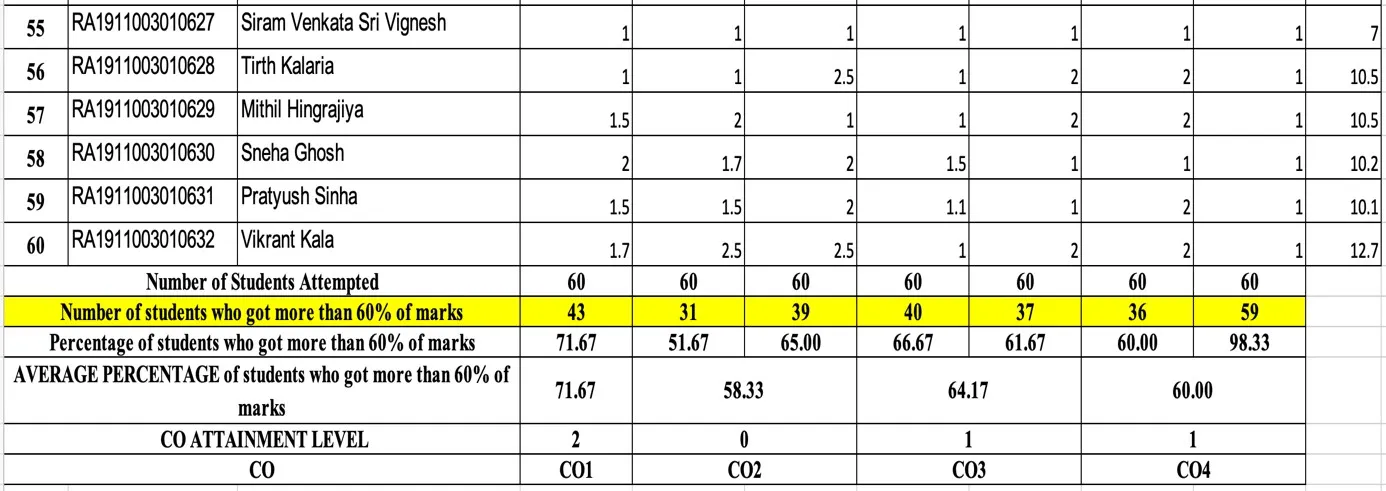
Step 6: Repeat the CO calculation for each scheduled review.
Step 7: Enter the end-semester result, including the final viva-voce marks, in the corresponding attainment sheet.
Step 8: Conduct the Programme Exit Survey for graduating students and collect alumni responses. Convert the responses to numerical values and calculate the average value associated with each CO as specified in the institutional process.
Step 9: Calculate the CIA attainment score by combining the internal review scores, and record the Term End Examination (TEE) marks separately.
Step 10: Calculate the Direct Attainment Score using 40% of CIA and 60% of TEE.
Step 11: Convert both the Direct and Indirect Attainment Scores into attainment levels using the predefined x, y, and z thresholds:
Attainment level = 3, if Attainment Score >= x%
= 2 if y% <= Attainment Score < x%
= 1 if z% <= Attainment Score < y%
Step 12: Final Attainment score is calculated as follows:
Final Attainment Score = 80% of Direct Attainment Score+ 20% of Indirect Attainment
Assign the corresponding Final Attainment Level using the same threshold scale.
7. PROGRAMME-LEVEL PO/PSO ATTAINMENT
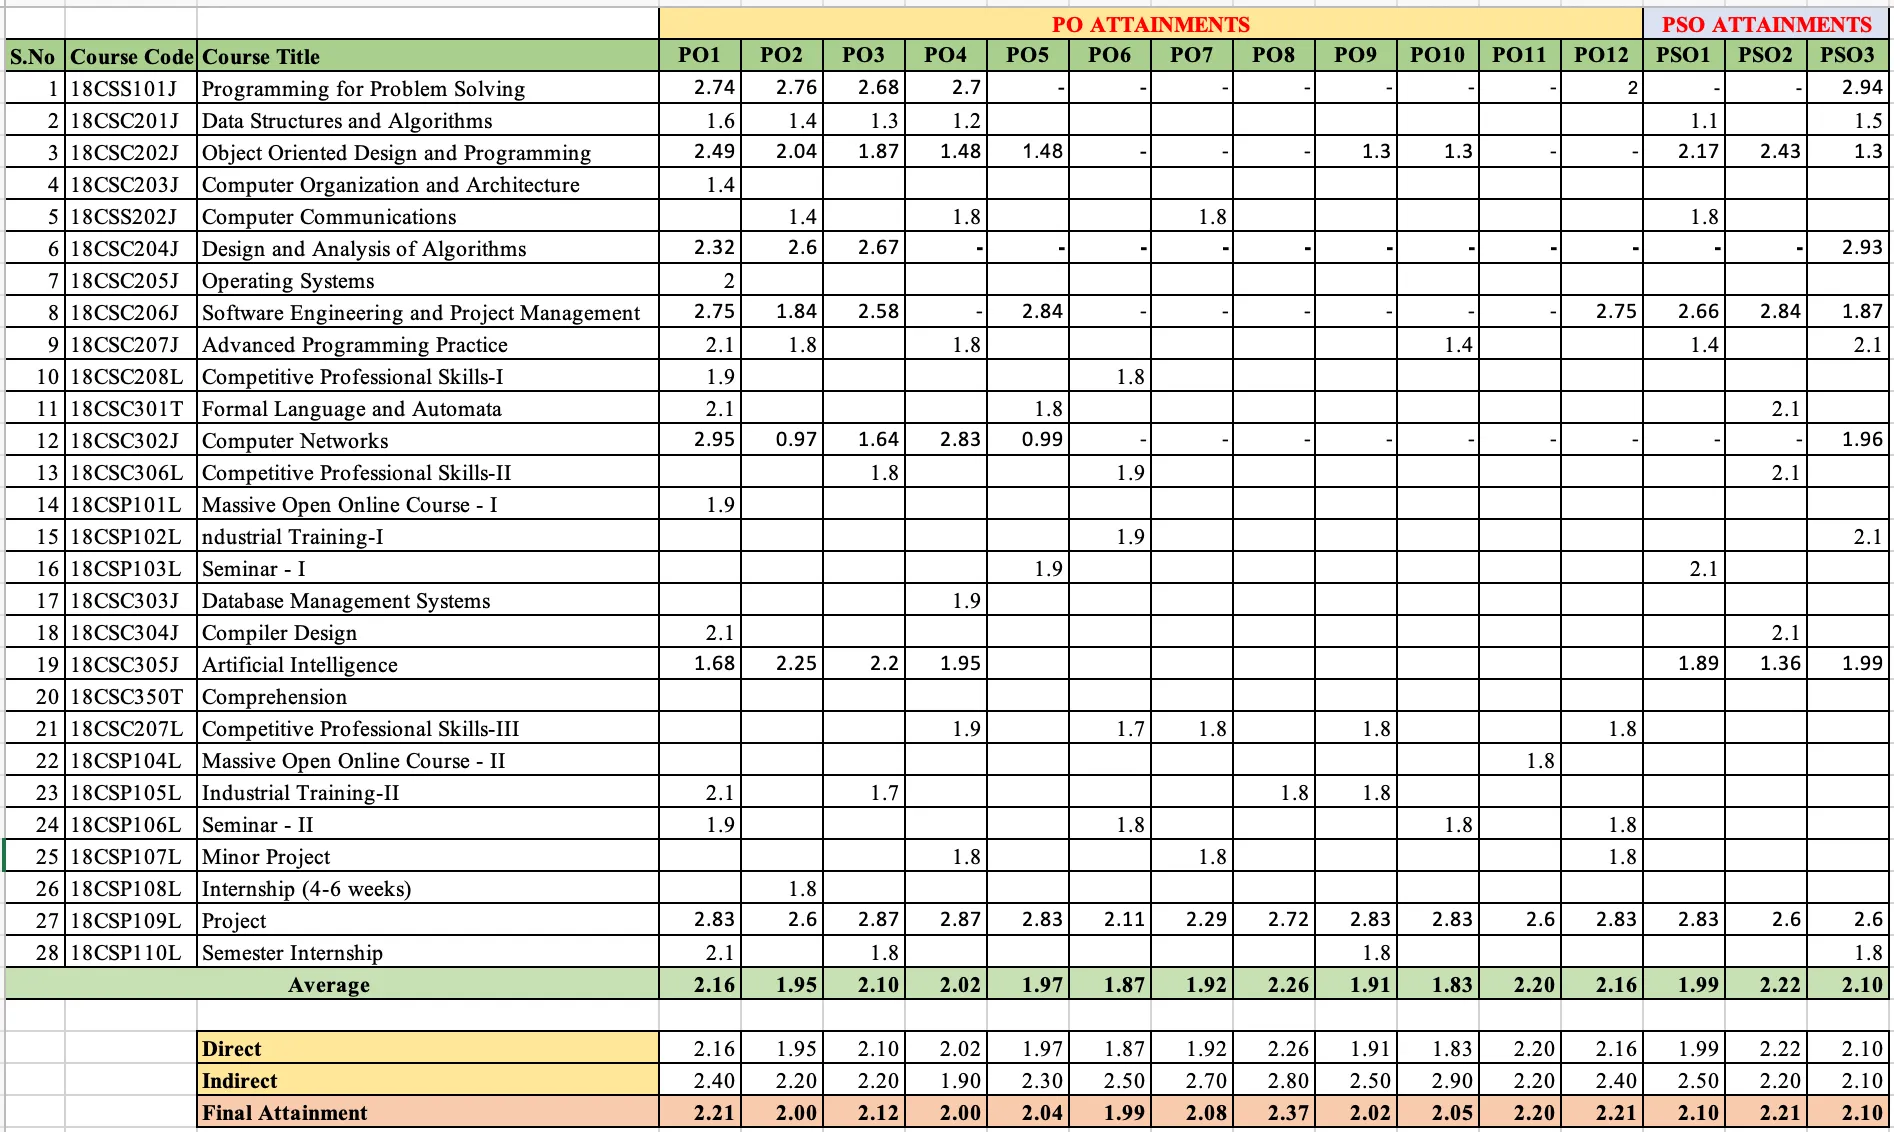
At programme level, the PO/PSO attainment values contributed by the core courses are compiled and averaged. The resulting values are then compared with the programme targets. This step moves the analysis from individual courses to the collective performance of the programme.
7.1 Direct Attainment
Direct programme attainment is obtained by compiling the PO attainment values contributed by the courses and calculating the programme-level average for each PO/PSO.
7.2 Indirect Attainment
Indirect programme attainment is derived from the Program Exit Survey and Alumni Survey. These instruments provide feedback on the extent to which graduates perceive the programme outcomes to have been achieved.
7.3 Final Attainment
The final programme attainment value is obtained by combining 80% of the direct attainment with 20% of the indirect attainment.
8. CO ATTAINMENT AND GAP ANALYSIS
9. CONTINUOUS IMPROVEMENT IN PO/PSO ATTAINMENT
Attainment data have value only when they lead to academic decisions. When a PO or PSO falls below its target, the course team should examine the courses and COs that contribute most strongly to that outcome and identify an appropriate response. Depending on the nature of the gap, the action may involve teaching strategy, assessment design, additional learning support, curricular sequencing, or a review of the target for the next cycle.

At course level, faculty members should retain two key values for review and follow-up:
A course audit or academic review process can then examine section-wise and course-wise attainment, verify the evidence, and recommend follow-up actions for the next academic cycle.
10. INTERPRETATION AND PRACTICAL IMPLICATIONS
The main contribution of the framework is procedural clarity. It makes the route from an assessment item to a course outcome, and from a course outcome to a programme outcome, visible and auditable. This is particularly useful where several faculty members teach different sections of the same course or where programme review requires evidence from a large number of courses. The emphasis on explicit outcomes and aligned assessment is consistent with established approaches to constructive alignment and student learning [10].
The framework also supports accreditation-oriented documentation because the mapping, attainment evidence, and follow-up action are retained as connected records rather than as separate exercises. The value of that documentation, however, depends on the quality of the underlying assessment. A detailed spreadsheet cannot compensate for poorly designed questions, weak rubrics, or a CO that is not measurable. Assessment design therefore remains as important as the attainment formula itself [11], [12].
A second practical advantage is that the process does not treat all learners or all outcomes as identical. Course-level analysis can reveal which COs need reinforcement and can inform additional support, alternative learning activities, or more demanding tasks for students who are ready to progress further. Such responses are more defensible when they are based on evidence from specific outcomes rather than on the overall course average alone [12], [13].
The comparison charts in this paper should be read as illustrations of how the results can be reviewed, not as evidence that the framework by itself produces higher attainment. Its educational value lies in creating a disciplined cycle of target setting, evidence collection, interpretation, and improvement. Whether attainment improves over time must be established from longitudinal programme data.
11. DISCUSSION
OBE introduces greater transparency into teaching and assessment because the expected learning is stated in advance and the evidence used to judge it is documented. At the same time, the process can become overly mechanical if faculty focus on spreadsheets rather than on the educational meaning of the outcomes. The calculations should therefore support academic judgement, not replace it.
Clarity of educational objectives is the starting point. Faculty and students need to understand what a CO actually requires and how achievement will be demonstrated. When outcomes, learning activities, and assessment tasks are aligned, students receive a clearer picture of what successful learning looks like [14].
The framework is compatible with different teaching approaches. Flipped classrooms, problem-based learning, activity-based learning, collaborative work, and project-based tasks may all be used where they suit the intended outcome [15]. The attainment system does not prescribe one pedagogy; instead, it provides a way to examine whether the chosen pedagogy and assessment together produced the expected learning evidence.
The same principle applies to industry relevance. Programme outcomes become more useful when assessment includes authentic tasks, projects, practical work, and other opportunities to apply knowledge in realistic settings. Industry interaction can strengthen that process, but the mapping should remain traceable so that employability claims are connected to specific programme outcomes rather than stated in general terms [16].
Implementation still requires sustained faculty engagement. Common difficulties include uneven interpretation of mapping levels, inconsistent tagging of assessment items, reluctance to change established examination practices, and limited use of attainment data after the report is prepared. Regular faculty development and programme-level moderation are therefore essential if OBE is to function as a continuous improvement system rather than as a compliance exercise [17].
CONCLUSION
This paper presents OBE attainment as a connected academic process rather than a sequence of isolated calculations. COs are mapped to POs and PSOs, assessment items are linked to COs, direct and indirect evidence are calculated separately, and the resulting attainment values are compared with targets at course and programme level. The final step is the most important: a gap must lead to an identifiable academic action. In this form, attainment data can support curriculum review, assessment improvement, and evidence-based discussion of programme performance.
Further work should examine the framework using longitudinal data from multiple programmes and should test how sensitive the final attainment values are to different threshold choices and direct-indirect weightings. Faculty calibration, digital support for question-wise mapping, and closer industry participation in authentic assessment are also useful areas for development. Such work would help distinguish between an attainment process that is administratively complete and one that genuinely improves the quality of learning.
REFERENCES

Jyotirishwar Kumar*, A Practical Framework For CO-PO-PSO Attainment In Outcome-Based Education, Int. J. Sci. R. Tech., 2026, 3 (9), 671-686. https://doi.org/10.5281/zenodo.23080872
 10.5281/zenodo.23080872