

We use cookies to ensure our website works properly and to personalise your experience. Cookies policy
Institute of Social Transformationt, Tangaza University, Nairobi, Kenya
This study looked at how financial and non-financial support from development finance institutions (DFIs) relates to the perceived growth of social enterprises in Nairobi County, Kenya. DFI support is seen as a way to help enterprises grow. However, there is little direct evidence about which types of support are linked to growth, especially for social enterprises. Kenyan research has examined sector development, social capital, and financing barriers, but few studies have compared lending, capacity building, market access, industrial infrastructure, and policy advocacy in a single local context. The study employed a mixed-methods, cross-sectional design grounded in Market Failure Theory and the Resource-Based View. Eighty-three social enterprise leaders, selected through purposive and snowball sampling, completed questionnaires with both closed- and open-ended questions, representing 92.2% of the target sample. Quantitative data were analyzed using descriptive statistics, correlation analysis, and multiple regression, with HC3 robust standard errors and a bootstrap check. Thematic analysis was used for qualitative data. Study results revealed that capacity building had the highest average score (M = 4.046), followed by lending (M = 3.916) and policy advocacy (M = 3.851). All five types of support were positively linked to perceived growth (r = .308 to .575). When all five were included in the analysis, only lending was a significant predictor (B = 0.512, p = .015), explaining 45.5% of the variation in perceived growth. Capacity building (B = 0.289, p = .062) and policy advocacy (B = 0.288, p = .145) remained positive but not statistically significant, while market access and industrial infrastructure showed no adjusted association. Qualitative data most often mentioned the need for affordable financing, mentoring, buyer connections, and shared facilities. It is recommended that DFIs focus on lending arrangements that are based on verified enterprise cash flows. Capacity-building programs should be expanded only after being evaluated with clear, measurable results. Efforts in market access, infrastructure, and policy advocacy should be designed to meet the specific needs of enterprises.
A social enterprise must remain operational while pursuing social or environmental objectives[1]. This dual mandate makes growth more complex to define than in profit-driven businesses. Growth may be reflected in job creation, customers served, beneficiaries reached, or social value generated[2]. Development finance institutions are public, bilateral, regional, or multilateral organizations that aim to achieve development outcomes through financial and non-financial assistance, such as loans, training, buyer introductions, shared facilities, and regulatory engagement. However, the specific contribution of each support type to enterprise growth remains unclear. Evidence from Africa is mixed: De Jongh et al. reported improvements in turnover and employment among 365 small business owners in South Africa following technical DFI support, though the study lacked a control group[3]. In Uganda, a randomized trial of loans, grants, and training found outcomes varied by gender and support type[4]. While these findings cannot be directly applied to Nairobi, they highlight the need to examine each form of support separately.
Kenya has a substantial social enterprise sector; the British Council[5] estimated that there were about 44,000 such enterprises, though this figure is based on an unrepresentative sample and should be viewed as a historical estimate. Wairimu’s Nairobi-based research examined structural social capital[6] and financing challenges faced by solar social enterprises, including bank risk aversion and strict due diligence[7]. However, existing literature does not compare the different forms of DFI support within a unified framework for this local context.
This study presents survey results from social enterprise leaders in Nairobi County, assessing which of the five types of DFI support are associated with perceived growth after controlling for the other four. Due to the cross-sectional design and non-probability sampling, findings are considered exploratory.
Statement of the Problem
Social enterprises in Nairobi seek financial and business support while maintaining financial viability and their social objectives. Support organizations must allocate limited resources effectively. Without enterprise-level evidence, decisions may rely too heavily on aggregate investment data or assumed benefits.
Although relevant research exists, little is known about how DFI lending, capacity building, market access, industrial infrastructure, and policy advocacy jointly relate to perceived growth. It is also unclear which associations persist when all five support types are considered together. This study addresses this question in Nairobi County through exploratory correlational analysis. It does not seek to establish causality or assess the fairness of the distribution of finance across counties.
Research Objectives
The primary aim was to examine the relationship between DFI support and the perceived growth of social enterprises in Nairobi County. The specific objectives were as follows:
1. To examine the relationship between DFI lending mechanisms and the perceived growth of social enterprises in Nairobi County.
2. To evaluate the association between DFI capacity-building interventions and perceived growth of social enterprises in Nairobi County
3. To evaluate the relationship between DFI market-access initiatives and perceived growth of social enterprises in Nairobi County.
4. To evaluate the relationship between DFI industrial infrastructure support and perceived growth of social enterprises in Nairobi County.
5. To evaluate the relationship between DFI policy advocacy and perceived growth of social enterprises in Nairobi County.
Research Hypotheses
Each objective was tested against a null hypothesis, and all five were evaluated together in a single adjusted model so that each association could be judged with the other four held constant.
Hâ‚€â‚: DFI lending mechanisms have no statistically significant adjusted association with perceived growth of social enterprises in Nairobi County.
H₀₂: DFI capacity-building interventions have no statistically significant adjusted association with perceived growth of social enterprises in Nairobi County.
H₀₃: DFI market-access initiatives have no statistically significant adjusted association with perceived growth of social enterprises in Nairobi County.
H₀₄: DFI industrial infrastructure support has no statistically significant adjusted association with perceived growth of social enterprises in Nairobi County.
H₀₅: DFI policy advocacy has no statistically significant adjusted association with perceived growth of social enterprises in Nairobi County.
LITERATURE REVIEW
Theoretical Framework
The study is based on two theories that address closely related but distinct questions: Market Failure Theory explains why external support may be necessary, whereas the Resource-Based View (RBV) explains why firms can respond differently to identical support.
Private credit markets fail to provide financing to viable businesses when lenders cannot confidently evaluate risk or when borrowers lack suitable collateral[8]. This is the typical reason given for the existence of development finance. DFIs can respond by offering loans, extending repayment periods, providing shared facilities and giving policy support, all of which private providers are unwilling to offer. The extent of their contribution relies on additionality, that is, whether the DFI has provided support which would not have been available otherwise. Carter et al. [9] explain why establishing additionality is difficult. Since DFIs choose the projects that they support, this selection process can bias a straightforward comparison between firms that have received support and those that have not. In this study, Market Failure Theory shapes the expectations regarding lending, infrastructure, and policy advocacy. However, the theory has a limitation: it explains the need for intervention without fully accounting for why enterprises receiving similar support might achieve different results.
The RBV approach accounts for differences in performance by examining the resources firms control and how effectively they use them. Wernerfelt [10] examined firms in relation to their resource positions, whereas Barney [11] argued that resources can lead to a sustainable competitive advantage if they are valuable, rare, inimitable, and not easily substitutable. Managerial knowledge and market relationships are examples of resources that may be strengthened by DFI support, making the theory particularly applicable to capacity building and market access. However, the RBV has come under criticism. Priem and Butler [12] point out that the argument becomes circular when a resource is regarded as valuable merely because the firm performs well. This study therefore examines support and growth separately and does not regard reported growth as evidence that the support was valuable. Furthermore, the theory was originally developed in the context of competitive advantage as opposed to organisations that combine commercial activity with a social mission.
Together, the two theories suggest positive associations between support for DFI and enterprise growth. However, they do not establish causation. It is therefore that the null hypotheses examine whether each adjusted association is zero, while the theories form the basis for the expected alternative hypotheses.
Empirical Review
Growth in Social Enterprises
A social enterprise’s growth has both commercial and social aspects. Doherty et al. discuss the conflicts arising from this dual aim[1], and Bagnoli and Megali suggest a multidimensional method for assessing performance[2]. In this study, growth was measured using five items rated by the respondents: revenue, employment, customers or beneficiaries, financial sustainability, and social impact. The average of the five items yielded a perceived-growth score, which reflects respondents’ evaluations and not any independently audited changes in financial or social outcomes.
DFI Support and Enterprise Outcomes
Quartey et al. [13], using World Bank Enterprise Survey data from West African countries, found that access to finance varied according to firm characteristics and institutional conditions. In Nairobi, Kahinga et al. [7] interviewed founders and managers of solar social enterprises and identified barriers such as perceived bias, bank risk aversion, and rigorous due diligence. Both studies address access to finance, but neither measures growth attributable to DFI lending. Selection also remains a concern because stronger enterprises may be more likely to obtain finance and to report growth [8].
De Jongh and colleagues looked at the technical support for small businesses among 365 business owners who were selected using convenience sampling in Gauteng [3]. Their pre- and post-comparison revealed improvements in turnover, fixed assets, client count, and employment. That said, since there was no control group, it cannot be excluded that other changes over time occurred. Fiala [4] provides a useful point of contrast, since randomisation enabled a clearer comparison and demonstrated that training did not yield the same results as loans and grants.
Bhattarai et al. [14] examined 164 social enterprises in the United Kingdom and found that market orientation was positively associated with both economic and social performance. Market orientation refers to an internal capability and should not be confused with a buyer linkage arranged by a development finance institution. Wairimu [6] investigated how structural social capital affected the performance of social enterprises in Nairobi City County. While networks are important, being a member of a network is different from having buyer access enabled by an external institution.
Charles [15] examined five social enterprises in Tanzania that were engaged in the collection and recycling of waste. These enterprises faced resource constraints and unsupportive policies. It was the ones that managed to keep going that depended on effective management practices, their networks, their skills, and suitable technology. The cases illustrate how productive resources interact with organisational practice, but they do not allow for the isolation of the effect of DFIs–financed facilities. There is even less evidence regarding DFIs’ policy advocacy. An enterprise can find itself in an improved operating environment without knowing whether this change was due to DFI involvement, government action, or a broader economic shift. Hence the perceptions of advocacy can offer only limited evidence of regulatory change.
The literature also fails to provide either a contextual or an analytical basis. Although there are existing studies examining different kinds of enterprises, settings, and forms of support, one that examines the main forms of DFI support together is still lacking.
Conceptual Framework
Figure 1 shows the five forms of DFI support as the explanatory variables and perceived growth as the result. The arrow indicates an association to be tested, not a causal relationship that has been proven. Policy advocacy is treated as a predictor rather but not as a mediator, and organisational capability is not measured as a mediating factor. An adjusted association means that the other four DFI constructs are kept constant. It does not mean that all relevant enterprise characteristics have been taken into account.
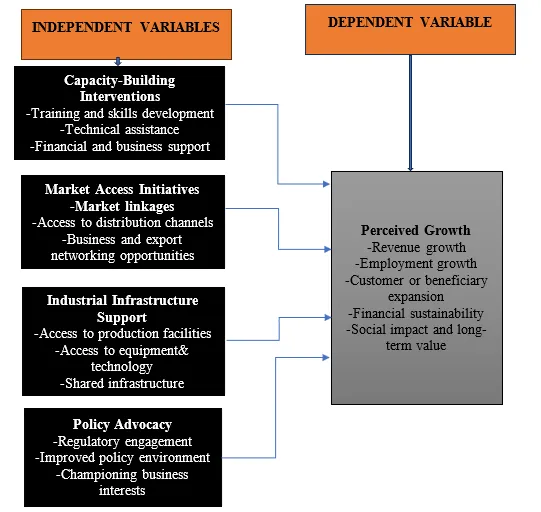
Figure 1: The Conceptual Framework Showing the Association Between DFI Support and Perceived Social Enterprise Growth, with the Arrow Indicating the Association to Be Tested. Source: adopted from .
RESEARCH METHODOLOGY
Research Design
The study adopted a convergent mixed-methods, cross-sectional approach. Quantitative data were obtained from the closed questionnaire items, while the open-ended questions were used to identify the respondents’ support needs. The two types of evidence were gathered in the same phase, analysed independently, and then combined during interpretation [16]. Even though the growth questions asked respondents to consider the three years prior, the survey was conducted at a single point in time. Menard [17] argues that, in such a situation, it was therefore possible to detect associations but not to determine the sequence of events or to follow a pattern of growth. Conducting a longitudinal study was not feasible given the available time and resources.
Target Population, Sampling and Sample Size
The research focused on 400 active social enterprises in Nairobi County and included owners, managers, and other employees familiar with their operations as respondents. The respondents were recruited through enterprise associations, social entrepreneurship networks, directories, and references. A combination of purposive and snowball sampling was used to identify and recruit suitable respondents, along with predetermined quotas for sectors such as the environment, energy, water services, and education, to ensure representation across these areas. Although this led to the creation of a list of potential participants, it did not result in a verified register. Since the selection probabilities are unknown, the results cannot be applied to all social enterprises in the county.
Yamane’s [18] formula served as a benchmark for planning, resulting in a target sample size of 90 respondents. Of these, 83 questionnaires were administered, yielding a response rate of 92.2 per cent. The study did not conduct a priori power analysis and, since there were five predictors, it cannot assert that it had adequate power to detect either small or moderate independent associations. A non-significant result might therefore be due to limited precision as well as to a weak association.
Research Instrument, Validity and Reliability
The data were obtained using a structured questionnaire which included 30 items on a five-point Likert scale, the points ranging from 1 (strongly disagree) to 5 (strongly agree). These items were grouped into six scales, each consisting of five items: lending, capacity building, market access, industrial infrastructure, policy advocacy, and growth. The score for each construct was determined by averaging its five items. Open-ended questions were included to identify needs and obstacles related to support. The questionnaire was piloted with 10 social enterprise owners and social innovators, who were therefore excluded from the main dataset. A version in Kiswahili was developed through forward and back translation and made available to anyone who requested it.
Cronbach’s alpha ranged from .854 to .971 (see Table 1). In the case of the growth scale, an alpha value of .971, together with inter-item correlations ranging from .804 to .911, suggests potential redundancy, as respondents might have provided a single, general positive judgment across the closely related items. It must be stressed that alpha alone does not establish validity. The empirical distinctiveness of the six constructs was not examined because no exploratory or confirmatory factor analysis was conducted.
Data Collection Procedures
The questionnaires were sent out via the recruitment channels mentioned above, and, where needed, reminders and assistance in completing them were provided. The completed questionnaires were reviewed for range and consistency, and a randomly selected 10% were verified by double-entry against the original documents.
Data Analysis
The quantitative data were analysed using SPSS version 26, and the results were recalculated in Python to verify the means, correlations, and alpha coefficients. The five DFI constructs were included in an ordinary least squares model:
Gi = β0 + β1Li + β2Ci + β3Mi + β4Ii + β5Pi + εi
In the model, G stands for perceived growth, L for lending, C for capacity building, M for market access, I for industrial infrastructure, and P for policy advocacy. The diagnostic tests failed to show that the residuals were normally distributed or that the error variance was constant. For this reason, inference was based on HC3 heteroscedasticity-consistent standard errors [19] together with t-based 95% confidence intervals. Supplementary intervals were obtained using a percentile bootstrap with 5,000 resamples at the respondent level. In the sensitivity model, the 20 respondents with minimal prior engagement with DFI were excluded. The hypotheses were evaluated at the 5% level using the HC3 results. The open-ended responses were coded and thematically organised according to the six phases described by Braun and Clarke [20].
Ethical Considerations
Approval was obtained from the ethics committee of Tangaza University, and a research permit was issued by the National Commission for Science, Technology and Innovation (NACOSTI). Participation in the study was entirely voluntary, and each individual provided informed consent after being informed of the study’s purpose and their right to withdraw at any time without repercussions. In line with Creswell and Creswell’s [16] recommendation, the responses were anonymised using pseudonyms and stored in a password-protected database accessible only to the researcher and the supervisors.
RESULTS
Respondent Profile
All 83 questionnaires were completed and retained for analysis. Owners accounted for 79.5% of respondents (66), managers for 9.6%, and other employees for 10.8%. About three-quarters of the respondents (75.9%) had previously engaged with a DFI, while 91.6% had been involved in social entrepreneurship for at least one year. The sample included 63 women (75.9%) and 20 men. Since all respondents completed the support scales, the full-sample results include the perceptions of 20 people with minimal prior DFI engagement, contrary to those based on combined services in DFI experience. A sensitivity check is presented later.
Perceptions of DFI Support and Growth
Table 1: Descriptive Statistics and Reliability of the Study Constructs
| Construct | Items | Mean | SD | Alpha |
|---|---|---|---|---|
| Lending mechanisms | 5 | 3.916 | 0.773 | .919 |
| Capacity building | 5 | 4.046 | 0.869 | .927 |
| Market access | 5 | 3.819 | 0.809 | .944 |
| Industrial infrastructure | 5 | 3.827 | 0.691 | .854 |
| Policy advocacy | 5 | 3.851 | 0.718 | .883 |
| Perceived growth | 5 | 3.851 | 0.925 | .971 |
Note that n equals 83; the scores are the average of five items measured on a scale ranging from 1 (strongly disagree) to 5 (strongly agree)—source: survey data from 2026.
All of the six constructs mentioned above received ratings above the midpoint of the scale (see Table 1). The one with the highest average score was capacity building (M = 4.046), this being due to better financial management (M = 4.145) and good governance and compliance (M = 4.108). Lending came next (M = 3.916), with flexible repayment terms obtaining the highest rating (M = 4.072). Concerning market access (M = 3.819), the highest rating was given to an increase in customers or sales (M = 3.940), whereas access to new markets received the lowest rating (M = 3.639); 57.8% of respondents agreed. Infrastructure had an average rating of 3.827; affordability was rated the highest (M = 3.964) and improvements in production or service delivery the lowest (M = 3.723). Policy advocacy averaged 3.851, with the highest rating for improvements in the operating environment (M = 4.000) and the lowest for contributions to policy discussions (M = 3.711). Perceived growth also averaged 3.851. The highest rating was given to customer or beneficiary expansion (M = 3.976), while social impact and long-term value received the lowest (M = 3.771).
In four of the five support scales, the item rated lowest was the one most closely linked to an outcome, for example, entering new markets, improving production, or achieving sustainability. People seemed more positive about the terms, skills, and information they had received than about the actual results they obtained, since these figures reflect respondents’ perceptions; they should not be regarded as a direct indication of the intervention’s effectiveness.
Correlations and Adjusted Associations
Table 2: Pearson Correlations Among the Study Constructs
| Construct | 1 | 2 | 3 | 4 | 5 | 6 |
|---|---|---|---|---|---|---|
| 1. Lending | 1 | |||||
| 2. Capacity building | .280* | 1 | ||||
| 3. Market access | .261* | .458** | 1 | |||
| 4. Infrastructure | .453** | .235* | .365** | 1 | ||
| 5. Policy advocacy | .355** | .254* | .383** | .470** | 1 | |
| 6. Perceived growth | .575** | .440** | .308** | .346** | .434** | 1 |
Note. n = 83. * p < .05; ** p < .01 (two-tailed). Source: Survey data, 2026.
There was a positive correlation between each type of support and the feeling of growth (see Table 2). Lending showed the highest correlation (r = .575), then came capacity building (r = .440), followed by policy advocacy (r = .434), infrastructure (r = .346) and market access (r = .308). The various support factors were also correlated with one another (r = .235 to .470). It was therefore necessary to use an adjusted model to examine the association of each type of support while accounting for the others.
Table 3: Multiple Regression of Perceived Growth on the Five DFI Constructs (HC3 Robust Inference)
| Predictor | B | HC3 SE | β | t | p | 95% CI |
|---|---|---|---|---|---|---|
| Constant | −0.322 | 1.343 | −0.240 | .811 | [−2.996, 2.352] | |
| Lending | 0.512 | 0.205 | .428 | 2.495 | .015 | [0.103, 0.921] |
| Capacity building | 0.289 | 0.152 | .271 | 1.897 | .062 | [−0.014, 0.592] |
| Market access | −0.010 | 0.105 | −.009 | −0.095 | .924 | [−0.218, 0.198] |
| Infrastructure | −0.018 | 0.192 | −.014 | −0.096 | .924 | [−0.401, 0.364] |
| Policy advocacy | 0.288 | 0.195 | .223 | 1.473 | .145 | [−0.101, 0.676] |
Note. n = 83; R² = .455; adjusted R² = .420; HC3 Wald F (5, 77) = 6.627, p < .001. Source: Survey data, 2026.
The five-predictor model was jointly significant (Wald F (5, 77) = 6.627, p < .001), with R² = .455 and adjusted R² = .420. The diagnostic results informed the choice of inference method. Residuals departed from normality (Shapiro-Wilk W = .877, p < .001), and the error variance was not constant (Breusch-Pagan LM = 17.587, p = .004; White LM = 54.913, p < .001). The Ramsey RESET test did not indicate a specification problem (F = 1.130, p = .291), while variance inflation factors ranged from 1.314 to 1.514. Three cases had studentised residuals above 3, one had a Cook’s distance above 1 and eight had high leverage. The cases were retained, and HC3 robust standard errors were used throughout.
The lending score was the only one to reach the 5% significance level (as shown in Table 3). When the other four scores were held constant, an increase of 1 unit in the lending score was associated with an increase of 0.512 units in the perceived growth score (95% CI: [0.103, 0.921]). H₀₠was therefore rejected, whereas H₀₂ through H₀₅ were not rejected. However, failing to reject these hypotheses does not mean that the associations they refer to are zero. The confidence intervals for market access and infrastructure are still wide enough to cover both small negative and positive values.
Table 4: Sensitivity of the Adjusted Estimates to Sample and Inference Method
| Predictor | B (n = 83) | p | B (n = 63) | p | Bootstrap 95% CI (n = 83) |
|---|---|---|---|---|---|
| Lending | 0.512 | .015 | 0.527 | .040 | [.112, .800] |
| Capacity building | 0.289 | .062 | 0.291 | .101 | [.010, .534] |
| Market access | −0.010 | .924 | 0.004 | .974 | [−.257, .197] |
| Infrastructure | −0.018 | .924 | −0.014 | .954 | [−.336, .398] |
| Policy advocacy | 0.288 | .145 | 0.311 | .186 | [.038, .652] |
Source: Survey data, 2026.
The stability of the pattern was evaluated using two checks (see Table 4). Of the 63 respondents who had previously participated in DFI activities, lending remained positive and statistically significant (B = 0.527, p = .040), whereas the other four predictors were not significant. Moreover, the bootstrap interval for lending did not include zero. Although the bootstrap intervals for capacity building and policy advocacy also excluded zero, their HC3 intervals did not. Because the interpretation of these two variables depends on the method of inference, they should be treated with caution.
DISCUSSION
The lending outcome is consistent with the Market Failure argument that credit constraints can prevent viable businesses from securing finance on reasonable terms [8]. Also, it corresponds with the evidence from the Nairobi interview regarding financing obstacles [7]. However, the direction of the relationship is not clear. More robust firms have less difficulty in obtaining finance and are more likely to report experiencing growth. Unmeasured factors, such as leadership quality, affect both aspects. The study also cannot prove additionality, as Carter et al. [9] point out, because the method by which DFIs select their projects makes it difficult to determine additionality, even with better data.
Capacity building merits a more detailed examination. Although it obtained the highest average rating and showed a clear bivariate association with growth, its adjusted estimate was only just not significant (p = .062). It is possible that the respondents saw training and lending as part of the same package, or that the effects of training take longer to show up. The current data do not allow us to tell which of these explanations is correct. De Jongh et al. found gains following technical DFI support, but because their study lacked a comparison group, their results are not in conflict with those of this study [3]. The concern about circularity mentioned by Priem and Butler[12] is also relevant here. It would be wrong to consider training valuable simply because those who gave it a high rating also gave their own performance a high rating.
The estimated values for market access and infrastructure were nearly zero (B = −0.010 and −0.018). These slight negative estimates do not indicate that either type of support has a harmful effect. When lending and other forms of support were taken into account, the two variables provided only a small amount of additional information about perceived growth. Since Bhattarai et al. [13] and Charles [15] examined internal capabilities and enterprise-level resources and not merely buyer linkages or the facilities provided by a DFI, their results neither support nor contradict this finding. Policy advocacy remained positive but varied by inference method; one advocacy item asks directly about the relationship between support and growth, which could overlap with the outcome measure. Moreover, respondents might have difficulty in distinguishing the effects of DFI dialogue from those of government action or wider economic change.
Caution is also needed when looking at the growth measure. The alpha value of .971 indicates that the respondents’ ratings were generally similar across all five dimensions. The scale is not very effective at distinguishing revenue growth from employment, social impact, or other dimensions. Therefore, perceived growth should not be taken to mean verified growth.
What Respondents Asked For
Table 5: Leading Themes in Open-Ended Responses
| Area | Leading theme | Mentions | Percent |
|---|---|---|---|
| Funding | Affordable and flexible finance | 16 | 19.5 |
| Funding | Reduced collateral and easier access | 12 | 14.6 |
| Capacity building | Practical and tailored training | 21 | 27.3 |
| Capacity building | Continuous mentoring and follow-up | 21 | 27.3 |
| Market access | Buyer and market linkages | 23 | 35.4 |
| Market access | Trade fairs and exhibitions | 13 | 20.0 |
| Infrastructure | Affordable shared facilities | 18 | 24.0 |
| Policy advocacy | Coordination with government and stakeholders | 7 | 9.9 |
Note: The percentages represent the proportion of responses given to each question—source: Survey data, 2026.
The practical context provided by the open-ended responses complements the quantitative findings (Table 5). The main themes concerning financing were affordable, flexible financing and reduced collateral requirements, reflecting a focus on lending. Both practical training and continuous mentoring received 27.3% of responses on capacity building, indicating that respondents wanted more than just one-off workshops. Buyer and market linkages were the leading themes in the market-access category, while affordable shared facilities were the most frequently mentioned under infrastructure. Although these responses highlight the needs identified, they do not explain why market access and infrastructure were not linked to growth. The percentages are calculated from the number of people who responded to each question and are not estimates of the total population.
Gender Comparison
Men had higher mean scores than women on all six constructs, but each of the 95% confidence intervals for the difference between men and women included zero. For perceived growth, the difference was 0.329 units (95% CI [−0.025, 0.683], p = .068); the mean score for women was M = 3.77, and for men M = 4.10. Because the group comparison comprised 20 men and 63 women, the estimates are imprecise and therefore do not indicate equality or disadvantage. Moreover, respondent gender cannot be used as an indicator of enterprise ownership or leadership.
Limitations
The study refers only to the participating respondents, and not to all social enterprises in Nairobi, because probability sampling was not employed in the recruitment process. The same respondents who reported receiving support also stated that their enterprises had grown, suggesting a potential for common method bias. Because of the cross-sectional nature of the design, it is not possible to determine causation or the sequence of events. The model did not take into account the enterprise’s age, the sector it operates in, the leadership team, prior funding, or the state of the market. The residual diagnostics were not met, and the use of robust standard errors addresses only unequal variance, not confounding or selection bias. Twenty of the respondents had minimal prior experience engaging with a DFI. Neither a factor analysis nor an a priori power analysis was conducted. For these reasons, the results must be regarded as exploratory.
CONCLUSION
Of the five types of DFI support examined in Nairobi County, lending showed the strongest link to perceived growth. It was the only factor that stayed significant when the other four were held constant (B = 0.512, p = .015), and the result remained positive in both the engagement-only and bootstrap analyses. Capacity building had the highest mean score (M = 4.046) and was positively correlated with growth, but its adjusted association was not significant under HC3 robust inference (p = .062). Policy advocacy was positive, though its interpretation varied depending on the inference method. Neither market access nor industrial infrastructure showed an adjusted association with perceived growth.
The results indicate that it is advisable to give priority to lending, after which capacity development should be carried out after careful evaluation. The other types of assistance could still be useful when dealing with a clearly identified constraint. This sequence is based on a practical judgement and takes into account non-probability and self-reported data, as the study did not conduct a formal comparison of the coefficients.
RECOMMENDATIONS
From the foregoing, it implies that DFIs ought to focus on lending, and their repayment schedules and grace periods should be based on verified enterprise cash flows, with the appraisal process placing less reliance on traditional collateral and more on cash flows. Similarly, DFIs should test programmes for capacity building that include practical training and ongoing mentoring; their value must be evaluated by measurable operational results, such as improved financial records, better governance, and more effective business planning. Another suggestion coming from the study is that market access, infrastructure, and policy advocacy should support lending and respond to the actual needs of enterprises. These buyer and procurement links are most appropriate when weak demand is the primary limitation. Shared facilities should be offered only when it can be shown that they will be used. Advocacy should be evaluated based on real regulatory changes as opposed to on the number of consultations conducted. It then follows that DFIs should conduct a more comprehensive study to examine participation, financing terms, and outcomes by gender and other demographic nuances for more targeted tailoring of service offerings. Additionally, government should treat social enterprises as a separate category in its small business policy and use public procurement to create sustainable market opportunities for eligible enterprises. From an entrepreneurship perspective, social enterprise managers ought to improve their financial record-keeping, budgeting, and impact measurement, and then apply the knowledge they acquire from training and mentoring provided by the DFI.
Sample size should be established in advance in future studies, preferably using probability sampling whenever possible, making sure sufficient represented for subgroup analysis. Studies with a longitudinal design or those that include a comparison group would clarify the timing and allow for more robust conclusions regarding additionality. The measures should be tested using factor analysis, and the reported growth should be supplemented by verified records of revenue and employment. Future models should take into account enterprise age, sector, leadership, and market conditions, and examine influential cases and instances of clustering. Mediation or interaction between different forms of support should be tested only after the individual mechanisms in question have been measured separately.
REFERENCES



Michael Njane, Zipporah Muiruri, Jeketule Soko, Contribution of Development Finance Institutions to the Growth of Social Enterprises in Nairobi County, Kenya, Int. J. Sci. R. Tech., 2026, 3 (10), 1370-1380. https://doi.org/10.5281/zenodo.23690453
 10.5281/zenodo.23690453