
We use cookies to ensure our website works properly and to personalise your experience. Cookies policy
Ratnam Institute Of Pharmacy, Pidathapolur(V&P), Muthukur(M), SPSR Nellore District – 524346
The creation and assessment of Aloe vera gel for topical application using cottonseed oil is the main objective of this work. Different amounts of cottonseed oil were combined with appropriate excipients uch gelling agents, humectants, preservatives, and neutralizing agents to create a variety of formulations (F1–F8). The F6 is often regarded as the best formulation in many studies. The pH value of all developed formulations of gels F1 - F8 were in the range of 6.2 to 6.9. Viscosity of various formulated gels was found in range of 4210 to 5210. Spreadability of gels was in the range 5.4 – 6.8 g.cm/sec. The Percentage Yield of gels was in the range 82.45% to 91.28%. The percentage drug content of all prepared gel formulations were found to be in the range of 74.12 to 91.36 %. The F1, F2, F3, F4, F5, F6, F7 & F8 formulations were followed Korsemeyer-Peppas with correlation coefficient r2=0.8969, 0.6042, 0.8592, 0.8095, 0.9721, 0.9706, 0.3191& 0.2692 respectively. The F6 formulation follows both Zero order and Korsmeyer-Peppas models, It indicates diffusion release mechanism followed by non-fickian transport.
Aloe vera belongs to the Asphodelaceae (Liliaceae) family of succulent plants. Given that it thrives for more than two years, it is an evergreen perennial. It comes from the Arabian Peninsula, which is located northeast of Africa [1]. sometimes called Barbados or Curaçao Aloe, to treat and cure a wide range of illnesses. The species is aesthetically appealing and grows well indoors in pots. Aloe vera spreads by offsets and reaches a height of 60–100 cm (24–39 inches). It is a plant with either extremely short or no stems.
It is grown for commercial usage, mostly for topical applications [2]. Aloevera finds application in the food, pharmaceutical, and cosmetic sectors. It serves as a basic material for a variety of goods in the lavatory and cosmetic industries, including masks, skin moisturizers, soaps, shampoos, sun lotions, make-up creams, scents, shaving creams, and bath aids [3].
Advantages of gel formulations [4]:
Compared to traditional semisolid dosage formulations, the gel formulation offers a number of significant advantages.
Gels are easier to make than other formulations.
Gel is a complex, non-greasy substance.
Gels provide excellent adherence to the area of application.
Gels are biocompatible and environmentally benign.
Be extremely robust to difficult situations
The gel formulation has drawbacks despite its many advantages. Gel compositions may have significant
Disadvantages [5]:
The effects of gels are more gradual and enduring.
People may become irritated by the gelators or additives.
The presence of water raises the possibility of microbial or fungal attack on gel.
The solvent loss in the formulation dries to gel.
Flocculation can cause an unstable gel in some gels.
Ideal properties of topical gel [6]:
The gel ought to be uniform and transparent.
When shear or force is applied during the container's shaking, the gel should break easily.
The gel should have an inert composition.
The gel must not be sticky.
The gel shouldn't ever contact with another component in the formulation.
The gel must be reliable.
The skin or any area where the gel is placed shouldn't be irritated
Materials and Equipment:
Aloe vera sample obtained form the ratnam college, sodium alginate - S.D.Fine Chem. Ltd. Mumbai. Triethylamine - Aurobindo Pharma Ltd , Hyderabad. Carbomer/carbopol Finar Chemicals Ltd. Ahmedabad. Glycerin - Himedia Laboratories Pvt. Ltd. Mumbai. Propyl Paraben - Anant Pharmaceuticals Pvt. Ltd. Mumbai. Cotton Seed Oil - Patanjali Foods Pvt. Ltd. Hyderabad
METHODOLOGY
FTIR Study:
The compatibility of the drug in the formulation was confirmed by FTIR spectral analysis. FTIR spectra of Aloe vera and formulation containing all polymers were determined by using the Shimadzu FT-IR 8300 spectrophotometer by potassium bromide pellet method in the wavelength region of 4000 to 400 cm⻹. The procedure consisted of dispersing a sample in potassium bromide and compressing into discs by applying a pressure of five tons for five minutes in a hydraulic press. The pellet was placed in the light path, and the spectrum was obtained [7]
Formulation of Aloe Vera Gel:
The Aloe vera gel formulation was prepared using Aloe vera gel as the active ingredient along with cottonseed oil and suitable excipients such as Carbopol, glycerin, propyl paraben, triethanolamine, and distilled water. Initially, the required quantity of Carbopol was accurately weighed and slowly dispersed in a measured amount of distilled water with continuous stirring [Figure 1]. The dispersion was allowed to hydrate and swell completely for about 30–60 minutes to form a clear gel base. Continuous stirring was maintained to avoid the formation of lumps and to ensure uniform distribution of the polymer in water [8].
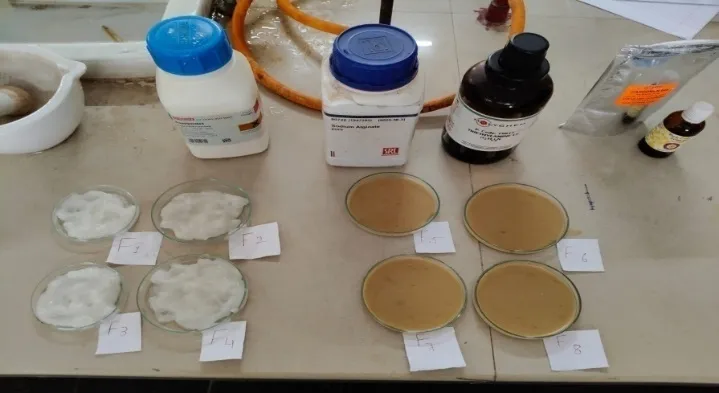
Figure 1: Formulations F1-F8 ofAloe veratopical preparations using cotton seed oil
In a separate beaker, freshly prepared Aloe vera gel was taken and mixed with glycerin to enhance the moisturizing property and improve the smoothness of the formulation. Propyl paraben, which acts as a preservative, was dissolved in a small quantity of distilled water and added to the Aloe vera–glycerin mixture to prevent microbial growth and increase the shelf life of the formulation [Table 2]. The mixture was stirred thoroughly until a clear and uniform solution was obtained. After that, cottonseed oil was gradually added to the mixture with continuous stirring to ensure proper dispersion of the oil and to improve the emollient property of the gel [9].
The prepared Aloe vera mixture was then slowly incorporated into the hydrated Carbopol gel base with continuous stirring to obtain a homogeneous formulation. Finally, triethanolamine was added dropwise to the mixture as a neutralizing agent in order to adjust the pH and convert the Carbopol dispersion into a clear gel with suitable consistency. The entire formulation was mixed thoroughly until a smooth, uniform, and stable Aloe vera gel was obtained [10]. The prepared gel was then transferred into clean, airtight containers and stored at room temperature for further evaluation tests such as pH determination, viscosity, spreadability, homogeneity, and stability studies.

Table 1: Formulation Design For Aloe vera Gel
Evaluation Tests:
After formulation, the prepared Aloe vera gel was subjected to various evaluation parameters to assess its quality, stability, safety, and effectiveness. These tests help determine whether the gel is suitable for topical application.
Physical Appearance:
The prepared gel was visually inspected for its color, odor, clarity, texture, and presence of any lumps or phase separation. A small quantity of gel was taken in a clean glass container and observed under normal light. The formulation was checked for homogeneity and smoothness [11]. The appearance of the gel should be clear or slightly translucent with a smooth texture and free from any visible particles or air bubbles. Any change in color, odor, or phase separation indicates instability in the formulation
pH Determination:
The pH of the gel was determined using a digital pH meter. About 1 gram of the gel was dissolved in 100 ml of distilled water and stirred properly to obtain a uniform solution. The pH meter was calibrated using standard buffer solutions before measurement. The electrode was then immersed into the gel solution and the pH was recorded [12]. The ideal pH for topical preparations should be between 5.5 and 7.0 to match the skin pH and avoid irritation. Maintaining proper pH ensures skin compatibility and stability of the formulation
Viscosity Measurement:
Viscosity determines the thickness and flow behavior of the gel. It was measured using a Brookfield viscometer at room temperature. A suitable spindle was selected and immersed in the gel sample. The viscosity reading was recorded at a specific rotational speed (rpm). Proper viscosity ensures that the gel is neither too thick nor too thin [13]. A suitable viscosity is important for easy application, good spreadability, and stability of the gel
Spreadability Test:
Spreadability determines how easily the gel spreads on the skin. It was measured by placing a small quantity of gel between two glass slides. A definite weight was placed on the upper slide for a fixed time to remove air and form a uniform film [14]. Then, additional weight was applied and the time required for the upper slide to move a certain distance was noted. Spreadability was calculated using the formula:

S = Spreadability
M = Weight tied to the upper slide
L = Length moved by the glass slide
T = Time taken
Good spreadability indicates that the gel can be easily applied on the skin with minimal effort [15].
Drug Content (If Required):
If required, the drug content of Aloe vera in the gel can be estimated to ensure uniform distribution of the active ingredient. A specific quantity of gel was dissolved in a suitable solvent and analyzed using spectrophotometric methods. This test confirms that the active ingredient is evenly distributed throughout the formulation [16].
In vitro diffusion studies:
The in vitro diffusion study of prepared gel was carried out in Franz diffusion cell using through an egg membrane. 20 ml of phosphate buffer was taken in as receptor compartment, then 5 gm gels was spreaded uniformly on the membrane. The donor compartment was kept in contact with a receptor compartment and the temperature was maintained at 37±0.50C. The solution on the receptor pipette out 5 ml of solution from the receptor compartment at specified time intervals like 1, 2, 3, 4, 5, 6 & 7 hrs and immediately replaced with the fresh 2 ml phosphate buffer. The results of in-vitro release profile obtained for all formulations were plotted in Release order kinetics [17].
Kinetic study the Release Order kinetics Mechanism: The results of in-vitro release
profile obtained for all formulations were plotted in modes of data treatment as follows:
Zero order kinetics: Drug dissolution from pharmaceutical dosage forms that do not disaggregate and release the drug slowly, assuming that the area does not change and no equilibrium conditions are obtained can be represented by the following equation [18].
Qt = Qo + Ko t
Where,
Qt = Cumulative amount of drug release at time t,
Qo = Initial amount of drug in the solution
Ko = zero order release constant
t = Time in hours
First order kinetics: To study the first order release kinetics the release rate data were fitted to following equation [19].
Log Qt = log Qo + K t / 2.303
Where,
Qt= Cumulative amount of drug released at time t,
Qo = Initial amount of drug in the solution and
K= First order release constant.
Higuchi model: Higuchi developed several theoretical models to study the release of water-soluble and low soluble drugs incorporated in semisolids and or solid matrices [20]. Mathematical expressions were obtained for drug particles dispersed in a uniform matrix behaving as the diffusion media, the equation is
Q t = KH. t1/2
Where,
Q t = Cumulative amount of drug release at time t
KH = Higuchi dissolution constant
t = Time in hours
Korsemeyer and Peppas Release model: To study this model the release rate data are fitted to the following equation [21].
F = Mt / M = K.tn
Where,
F = Fraction of drug released at time‘t’
Mt = Amount of drug released at time‘t’
M = Total amount of drug in dosage form
K = Kinetic release constant
t = Time in hours and
n = Diffusion exponent for the drug release that is dependent on the shape of the matrix dosage form.
A plot of log drug release verses log time will be linear with slope of n and intercept gives the value of log K.
n = 0.5 indicating pure fickian diffusion.
n = 0.5-1 or 0.45-0.89 indicating non fickian diffusion ie, the rate of solvent penetration and drug release are in the same range.
n = 0.89 or 1 indicate zero order release which can be achieved when drug diffusion is rapid compared to the constant rate of solvent induced relaxation [22].
RESULTS AND DISCUSSION
Compatability Studies
The prepared Herbal gels were evaluated for interaction studies to ensure that no interaction occurred between the drug and the polymers. FTIR spectra were recorded and compared with those of the pure drug [Figure 3 & 4]. The result of these studies reveals that there were no definite changes obtained in the bands of the drug with respect to the pure drug [Table 5].
Figure 2: IR spectrum of Aloe vera
Figure 3: IR spectrum of optimized formulation
|
Drug & Mixture |
IR Absorbance |
Bonds |
Functional Group |
|
|
Observed Peak (cm-1) |
Characteristic Peak (cm-1) |
|||
|
Aloe vera |
754, 833
|
1000–650 |
(s) C–H bend |
Alkenes |
|
910–665 |
(s,b) N–H wag |
1°, 2° amines |
||
|
900–675 |
(s) C–H “oop” |
Aromatics |
||
|
850–550 |
(m) C–Cl stretch |
Alkyl halides |
||
|
1192 |
1250–1020 |
(m) C–N stretch |
Aliphatic amines |
|
|
1222 |
1335–1250 |
(s) C–N stretch |
Aromatic amines |
|
|
1362 |
1370–1350 |
(m) C–H rock |
Alkanes |
|
|
1430 |
1500–1400 |
(m) C–C stretch (in-ring) |
Aromatic |
|
|
2996
|
3300–2500 |
(m) O–H stretch |
Carboxylic acid |
|
|
3000–2850 |
(m) C–H stretch |
Alkanes |
||
|
3057
|
3100–3000 |
(s) C–H stretch |
Aromatics |
|
|
3100–3000 |
(m) =C–H stretch |
Alkenes |
||
|
Mixture of compounds |
3300–3200 |
3500–3200 |
(s) O–H stretch |
Alcohols, phenols |
|
2920 |
3000–2850 |
(m) C–H stretch |
Alkanes |
|
|
1730 |
1760–1710 |
(s) C=O stretch |
Carbonyl (esters, aldehydes) |
|
|
1630 |
1680–1600 |
(m) C=C stretch |
Alkenes |
|
|
1450 |
1470–1450 |
(m) C–H bend |
Alkanes |
|
|
1380 |
1390–1370 |
(m) C–H bending |
Alkanes |
|
|
1240 |
1300–1200 |
(m) C–O stretch |
Alcohols, esters |
|
Table 2: FTIR Interpretation Data of Mixture of Compounds
Evaluation Parameters
Physical Appearance: The prepared gel was visually inspected for its color, odor, clarity, texture, and presence of any lumps or phase separation. A small quantity of gel was taken in a clean glass container and observed under normal light. The formulation was checked for homogeneity and smoothness.
pH: The pH value of all developed formulations of gels F1 - F8 were in the range of 6.2 to 6.9.
Viscosity
The viscosity of various formulated Aloe vera gels was measured using a Brookfield viscometer. The rheological behavior of all formulated gels systems was studied. In gel system, consistency depends on the ratio of solid fraction, which produces the structure to liquid fraction [Table 6]. Viscosity of various formulated gels was found in range of 4210 to 5210 centipoises.
Spreadability
The value of spreadability indicates that the gel is easily spreadable by small amount of shear [Table 6]. Spreadability of gels was in the range 5.4 – 6.8 g.cm/sec.
Percentage Yield
The value of Percentage yield indicates that the gel is easily spreadable by small amount of shear [Table 6]. The Percentage Yield of gels was in the range 82.45% to 91.28%.
Drug Content
The percentage drug content of all prepared gel formulations were found to be in the range of 74.12 to 91.36 % [Table 6]. The percentage drug content of formulations was found satisfactory. Hence methods adopted for gels formulations were found suitable.
|
Formulation code |
Viscosity(cp) |
pH |
Percentage yield (%) |
Drug Content (%) |
Spreadability (g·cm/sec) |
|
F1 |
4210 |
6.2 |
82.45 |
74.12 |
6.8 |
|
F2 |
4350 |
6.3 |
84.31 |
76.53 |
6.5 |
|
F3 |
4520 |
6.1 |
86.24 |
79.64 |
6.3 |
|
F4 |
4680 |
6.0 |
87.11 |
81.72 |
6.1 |
|
F5 |
4820 |
6.4 |
88.36 |
84.53 |
5.9 |
|
F6 |
4950 |
6.5 |
89.42 |
86.21 |
5.8 |
|
F7 |
5080 |
6.7 |
90.35 |
88.74 |
5.6 |
|
F8 |
5210 |
6.9 |
91.28 |
91.36 |
5.4 |
Table 3: Evaluation Parameters of Aloe vera Gel
In vitro drug diffusion studies: In vitro drug release studies were carried out on diffusion test apparatus Franz diffusion cell [Figure 7,8, 9]. These release studies revealed that, the order of release [Table 8].
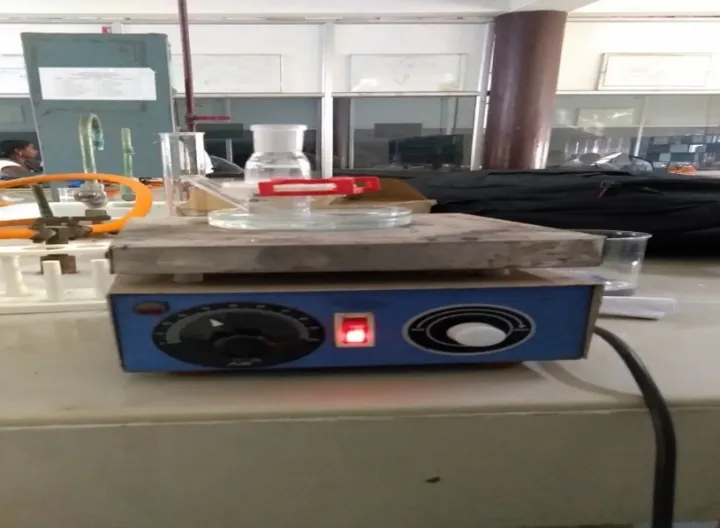
Figure 5: In vitro Franz’s diffusion cell
|
Time (Hrs.) |
Percentage amount of drug release |
|||||||
|
F1 (%) |
F2 (%) |
F3 (%) |
F4 (%) |
F5 (%) |
F6 (%) |
F7 (%) |
F8 (%) |
|
|
1 |
42 ± 0.1 |
48 ± 0.3 |
40 ± 0.6 |
32 ±0.4 |
20 ±0.2 |
21 ±0.4 |
22±0.2 |
19 ±0.1 |
|
2 |
43 ± 0.4 |
44 ± 0.6 |
44 ±0.4 |
48 ±0.7 |
34 ± 0.5 |
37 ±0.6 |
36 ±0.4 |
28 ±0.4 |
|
3 |
47 ± 0.6 |
52 ± 0.4 |
58 ±0.2 |
62 ±0.1 |
46 ± 0.7 |
54 ±0.7 |
48 ±0.5 |
38 ±0.6 |
|
4 |
56 ± 0.3 |
62 ± 0.1 |
69 ±0.6 |
64 ±0.2 |
56 ± 0.6 |
64 ±0.8 |
54 ±0.7 |
46 ±0.5 |
|
5 |
78 ± 0.2 |
72 ± 0.6 |
78 ±0.2 |
75 ±0.6 |
72 ±0.1 |
76 ±0.9 |
62 ±0.3 |
58±0.3 |
|
6 |
79 ± 0.6 |
83 ± 0.7 |
87 ±0.7 |
83 ± 0.3 |
76 ± 0.2 |
82±0.3 |
65 ±0.6 |
71 ±0.7 |
|
7 |
95 ± 0.7 |
93 ± 0.8 |
94 ±0.3 |
94 ± 0.1 |
82 ±0.4 |
89±0.1 |
77 ±0.4 |
84± 0.8 |
Table 4: In-vitro diffusion drug release of Herbal Aloe vera gels
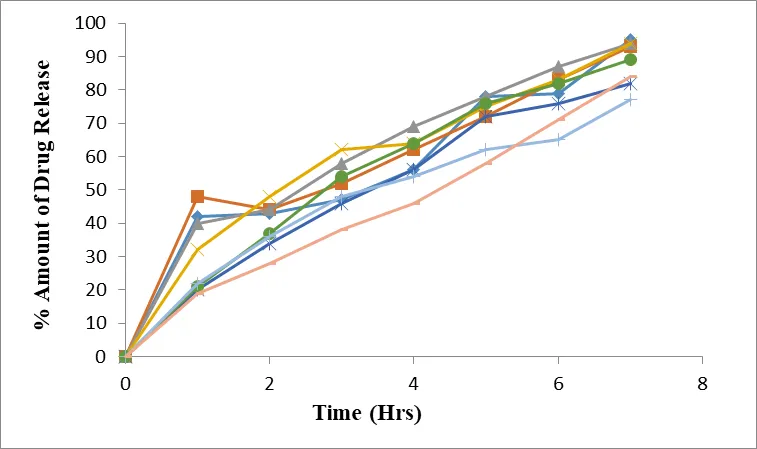
Figure 6: In-vitro drug release Profiles of Formulations F1 - F8
Kinetic Models Data Analysis: The results of diffusion data fitted to various drug release kinetic equations like Zero order, First order, Higuchi model and Korsemeyer-Peppas [Table 10, 11]. The kinetic values obtained for all formulations F1, F2, F3, F4, F5, F6, F7 & F8 were tabulated respectively, Graphs are Plotted for Zero order, First order, Higuchi model and Korsemeyer-Peppas against cumulative % drug release Vs Time (Hrs), Log cumulative % drug remaining Vs Time (Hrs), cumulative % drug release Vs Square root of Time, Log cumulative % drug release Vs Log Time.
|
Zero order |
First order |
Higuchi’s data |
Korsmeyer-Peppas data |
||||
|
Time (h) |
% CDR |
Time (h) |
Log % CD Remaining |
SQR Time |
% CDR |
Log Time |
Log % CDR |
|
0 |
0 |
0 |
2 |
1 |
0 |
0 |
0 |
|
1 |
0.1 |
1 |
1.95 |
1.73 |
10 |
0.47 |
1 |
|
2 |
0.34 |
2 |
1.81 |
2 |
34 |
0.60 |
1.53 |
|
3 |
0.54 |
3 |
1.66 |
2.23 |
54 |
0.69 |
1.73 |
|
4 |
0.64 |
4 |
1.55 |
2.44 |
64 |
0.77 |
1.80 |
|
5 |
0.76 |
5 |
1.38 |
2.64 |
76 |
0.77 |
1.88 |
|
6 |
0.82 |
6 |
1.38 |
2.82 |
82 |
0.85 |
1.88 |
|
7 |
1.22 |
7 |
1.25 |
2.82 |
12 |
0.90 |
1.91 |
Table 5: In-vitro drug release kinetics data for Formulation F6
|
Order Of Process |
Zero order |
First Order |
Higuchi |
Korse Meyer Peppass |
Mechanism |
|
||||
|
R2 |
slope |
R2 |
slope |
R2 |
slope |
R2 |
N |
|||
|
F1 |
0.9056 |
11.476 |
0.8278 |
0.151 |
0.875 |
29.806 |
0.8969 |
0.823 |
Non-Fickian |
|
|
F2 |
0.9025 |
1.1449 |
0.4821 |
0.0664 |
0.7269 |
39.64 |
0.6042 |
0.943 |
Zeroorder |
|
|
F3 |
0.9262 |
1.272 |
0.893 |
0.0838 |
0.9215 |
41.404 |
0.8592 |
0.852 |
Non-Fickian |
|
|
F4 |
0.939 |
1.386 |
0.6231 |
0.0779 |
0.7635 |
41.716 |
0.8095 |
0.756 |
Non-Fickian |
|
|
F5 |
0.9648 |
0.1224 |
0.971 |
0.0963 |
0.9409 |
47.483 |
0.9721 |
0.865 |
Non-Fickian |
|
|
F6 |
0.9659 |
0.1607 |
0.9804 |
0.1131 |
0.454 |
34.502 |
0.9706 |
0.831 |
Non-Fickian |
|
|
F7 |
0.9319 |
0.201 |
0.0158 |
0.0173 |
0.0103 |
5.7846 |
0.3191 |
0.975 |
Zeroorder |
|
|
F8 |
0.9029 |
0.2005 |
0.1054 |
0.0235 |
0.0129 |
4.2484 |
0.2692 |
0.853 |
Non-Fickian |
|
Table 6: Drug Release Kinetics of Herbal Aloe vera gels
F1, F2, F3, F4, F5, F6, F7 & F8 formulations were followed Korsemeyer-Peppas with correlation coefficient R2=0.8969, 0.6042, 0.8592, 0.8095, 0.9721, 0.9706, 0.3191& 0.2692 respectively. F6 formulation follows both Zero order and Korsmeyer-Peppas models, It indicates diffusion release mechanism followed by non-fickian transport
CONCLUSION
Using cotton seed oil for topical application, the current study successfully created and assessed Aloe vera gel. The produced formulations demonstrated excellent spreadability, good viscosity, and a suitable pH, all of which are necessary for successful skin application. The prepared gel was visually inspected for its color, odor, clarity, texture. The pH value of all developed formulations of gels F1 - F8 were in the range of 6.2 to 6.9. Viscosity of various formulated gels was found in range of 4210 to 5210. Spreadability of gels was in the range 5.4 – 6.8 g.cm/sec. The Percentage Yield of gels was in the range 82.45% to 91.28%. The percentage drug content of all prepared gel formulations were found to be in the range of 74.12 to 91.36 %. The F1, F2, F3, F4, F5, F6, F7 & F8 formulations were followed Korsemeyer-Peppas with correlation coefficient r2=0.8969, 0.6042, 0.8592, 0.8095, 0.9721, 0.9706, 0.3191& 0.2692 respectively. The F6 formulation follows both Zero order and Korsmeyer-Peppas models, It indicates diffusion release mechanism followed by non-fickian transport. The F6 is often regarded as the best formulation in many studies because it demonstrates: A skin-friendly pH around 6 to 7. Optimal viscosity and gel consistency. Excellent spreadability. No phase separation or irritation.
REFERENCES


Yerikala Ramesh*, Abhilash Bandela, Basamgari Mahesh, Galanki Praveena, Katikala Hemanth, Pulaganti Sailaja, Yadala Prapurna Chandra, Formulation And Evaluation Of Aloe Vera Gel Using Cotton Seed Oil For Topical Application, Int. J. Sci. R. Tech., 2026, 3 (6), 312-322. https://doi.org/10.5281/zenodo.20541432
 10.5281/zenodo.20541432