

We use cookies to ensure our website works properly and to personalise your experience. Cookies policy
1Department of Physics, Northwest University, Kano, Nigeria
2Department of Physics, Mewar University Chittorgarh, India
3Department of Electronics and Communication Engineering, SRM University-AP, Amaravati, Andhra Pradesh 522502, India
Plant-mediated synthesis is an approach in nanomaterial synthesis where compounds from plants can affect nucleation, growth, and surface stabilization. The present study compares silver nanoparticles (AgNPs) and zinc oxide nanoparticles (ZnO NPs) synthesized from a common Ziziphus jujuba leaf-extract platform using X-ray diffraction (XRD), Fourier-transform infrared spectroscopy (FTIR), ultraviolet-visible (UV–Vis) spectroscopy, scanning electron microscopy (SEM), and energy-dispersive X-ray spectroscopy (EDX). The Ag sample presented reflections at 38.27°, 44.45°, 64.55°, and 77.57° consistent with face-centered-cubic silver. The ZnO sample exhibited reflections at 31.91°, 34.55°, 36.38°, 47.60°, 56.78° and 63.02°, which are consistent with hexagonal wurtzite ZnO. FTIR spectra of both products exhibited bands corresponding to surface-bound species of plant origin, but the low-wavenumber region was different depending on the inorganic phase. The Ag sample showed a wide optical response of metallic nanoparticles. ZnO showed an absorption edge at about 392.5 nm, corresponding to about 3.16 eV calculated from E = 1240/?. SEM showed that both samples had rough, heterogeneous, and strongly aggregated structures at matched observation scales. EDX confirmed Ag in the silver product, and Zn and O were the main elements detected in the ZnO product, but the measured elemental percentages were localized and semi-quantitative. The results indicate that a common botanical synthesis platform could lead to materials with very different crystal structures and optical behavior. The value of the work is in the treatment of the two products as separate materials and the interpretation of the five characterization techniques in concert rather than any single measurement as proof for all aspects of the identity of the nanoparticles.
The use of plant extracts as reaction media for the preparation of metallic and metal-oxide nanoparticles is now extensively reported. They have practical appeal because aqueous extracts can be obtained without complex equipment, and naturally occurring phenolics, flavonoids, terpenoids, and other metabolites may participate in metal-ion reduction, nucleation, and surface stabilization. Recent reviews (Sadia et al., 2024; Thomas et al., 2024; Zulfiqar et al., 2024) revealed that the properties of plant-mediated nanoparticles are more dependent on precursor concentration, extract composition, pH, temperature, and reaction time than on the plant identity itself. This is contrasted to plant-mediated nanoparticles' characteristics that are strongly dependent on the identity of the plant. Silver and zinc oxide are representatives of different classes of inorganic matter and are useful to compare in material science. Ag is a metal conductor. The optical response of Ag nanoparticles is determined by the electronic structure and surface environment. ZnO is a large bandgap semiconductor whose optical response is dominated by its near UV absorption edge. In the recent experimental studies, the plant-derived Ag and ZnO have been characterized by XRD, FTIR, UV–Vis, SEM, and EDX, but the level of interpretation was different among the studies (Takcı et al., 2023; Karan et al., 2023; Islam et al., 2024; Adhavan et al., 2024).
Ziziphus jujuba Mill. is of particular interest, as several classes of phytochemicals present in the leaves are able to interact with the metal ions and particle surfaces. The jujube literature already has established discrete green-synthesis routes for Ag and ZnO, such as for AgNP production and microwave- or ultrasound-assisted ZnO synthesis. The review of the field concluded that there has been no report in the literature reviewed (Umar et al., 2026) on the controlled same-batch synthesis of both AgNPs and ZnO NPs from Z. jujuba extract with direct comparative characterization.
The present work therefore focuses on the comparison itself. AgNPs and ZnO NPs prepared within the same jujube-derived experimental framework are examined using five complementary techniques. The objective is to establish how the two products differ in crystal structure, surface-associated chemistry, optical response, morphology and detected elemental composition, while keeping the interpretation within the limits of the available measurements.
1.1 Research gap and objective
Previous jujube nanoparticle studies have largely treated AgNPs and ZnO NPs as separate systems and have used different synthesis routes and analytical combinations. Recent plant-mediated studies outside the jujube system likewise tend to focus on one nanoparticle class at a time or on a specific application (Al-Askar et al., 2023; Aliannezhadi et al., 2024; Peta & Singh, 2025). This makes direct comparison difficult because differences between plant sources, precursor chemistry and measurement conditions can be as important as the differences between the nanoparticle materials themselves.
The aim of this study is to compare jujube-mediated AgNPs and ZnO NPs using XRD, FTIR, UV–Vis spectroscopy, SEM and EDX, and to relate the observed structural, surface, optical, morphological and elemental differences within one botanical framework. The work does not claim that plant-mediated Ag or ZnO synthesis is new; the contribution is the controlled comparative treatment of the two material classes.
MATERIALS AND METHODS
2.1 Experimental design and sample preparation
The study was designed as a comparative characterization of two nanoparticle products from a common aqueous Z. jujuba leaf-extract platform. Fresh jujube leaves were collected from Kano State, Nigeria. Botanical identification and authentication were done prior to use as per the experimental protocol. The leaves were washed, dried at room temperature, powdered, and extracted with double-distilled water. Both systems of nanoparticles were prepared with the common extract as the botanical medium.
The experimental protocol used was described as 10 g of dried leaf powder in 200 mL of double-distilled water and stirred at about 60 °C for 30 min. The extract was filtered, centrifuged to remove residual plant material after cooling, and stored at 4°C before use. In the AgNP route, the silver precursor was AgNO₃. The ZnO route used zinc nitrate hexahydrate as a precursor, which was subjected to alkaline precipitation of a zinc hydroxide precursor, followed by thermal conversion to ZnO. The synthesis protocol involved the optimization of the precursor concentration, extract ratio, pH, temperature, and reaction time; the present article reports characterization of the final AgNP and ZnO NP samples, not the optimization series.
2.2 Characterization
UV–Vis spectra were recorded over the wavelength region used for nanoparticle optical assessment. XRD measurements used Cu Kα radiation (λ = 1.5406 Å). FTIR spectra were examined over the mid-infrared region. SEM imaging was performed using an SU3500 system, with the supplied micrographs acquired at 10.0 kV and compared at 1.00 kX/50 µm, 5.00 kX/10 µm and 15.0 kX/3 µm. EDX spectra were obtained together with the SEM measurements. The supplied EDX output is treated as localized, normalized and semi-quantitative.
2.3 XRD analysis
The diffraction patterns were analyzed by correlating the observed reflections with typical phases of fcc Ag and hexagonal wurtzite ZnO. Apparent coherent-domain sizes were estimated using the Scherrer relation, D = Kλ/(β cos θ), with K = 0.9 and Cu Kα radiation. Because the dataset supplied no separate correction for instrumental broadening, the values obtained should be taken as apparent coherent-domain estimates rather than as direct particle diameters.
2.4 FTIR and UV–Vis analysis
The FTIR spectra were analyzed on the level of functional groups. The broad high-wavenumber features and fingerprint-region bands were interpreted as signatures of organic surface-associated species resulting from the plant-mediated synthesis. Inorganic vibrations were investigated in the low-wavenumber region. UV–Vis spectra were analyzed separately for metallic Ag and semiconducting ZnO systems. The optical edge of ZnO was estimated to be about 392.5 nm from the supplied spectrum using E = 1240/λ, which gives about 3.16 eV. The absorption coefficient necessary for a formal Tauc analysis is not provided in the supplied dataset, and therefore this value is reported as an optical-edge estimate rather than a formal band gap.
2.5 SEM and EDX analysis
SEM images at matched magnification were used to compare surface texture, aggregation, and arrangement of larger structures. The images were not used to extract a primary nanoparticle-size distribution, as individual primary particles are not consistently resolved. Elements detected in the regions analyzed were identified by EDX. Elemental percentages were interpreted with caution, as EDX is localized and semi-quantitative and cannot, by itself, establish oxidation state, lattice substitution, defect chemistry, or the identity of surface-bound molecules.
2.6 Data treatment
The analysis was descriptive and comparative; The numerical values were obtained from the provided XRD, UV–Vis, and EDX outputs, and the SEM and FTIR observations were obtained from the provided micrographs and spectra. No experimental measurements were replaced by a literature value. No inferential statistical testing was applied because replicate-level numerical data were not provided for the characterization measurements presented in this article.
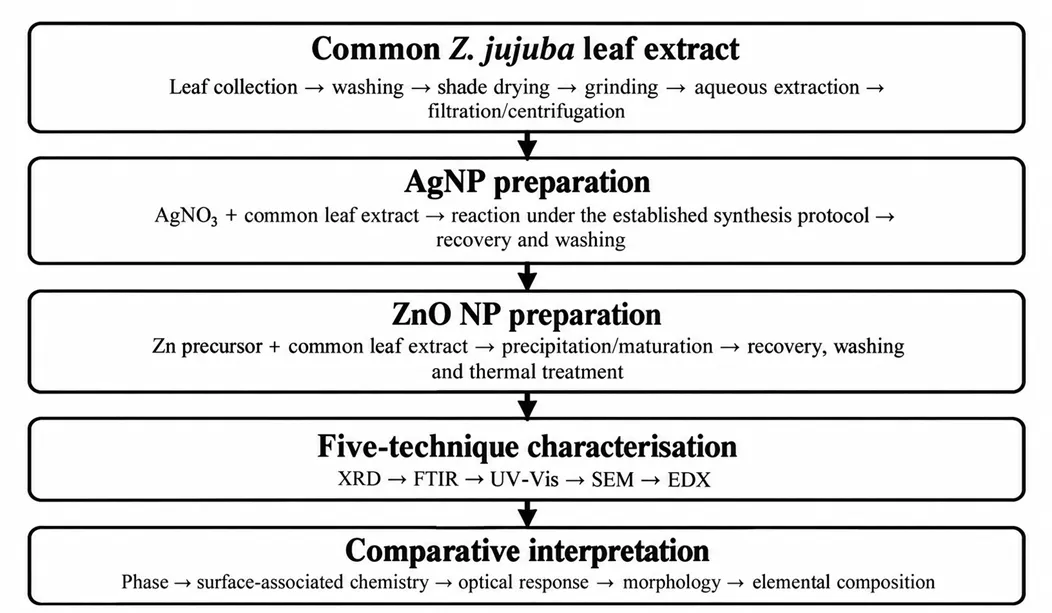
Figure 1: Experimental and Analytical Workflow Used for the Comparative Characterisation of Jujube-Mediated AgNPs and ZnO NPs.
RESULTS AND DISCUSSION
3.1 XRD identifies two distinct crystalline phases
The XRD patterns provide the clearest structural separation between the two products. As shown in Figure 2, the Ag sample contains principal reflections at approximately 38.27°, 44.45°, 64.55° and 77.57°. These positions correspond to the (111), (200), (220) and (311) reflections of face-centred-cubic Ag. The ZnO sample shows reflections at approximately 31.91°, 34.55°, 36.38°, 47.60°, 56.78° and 63.02°, which are consistent with the hexagonal wurtzite structure.
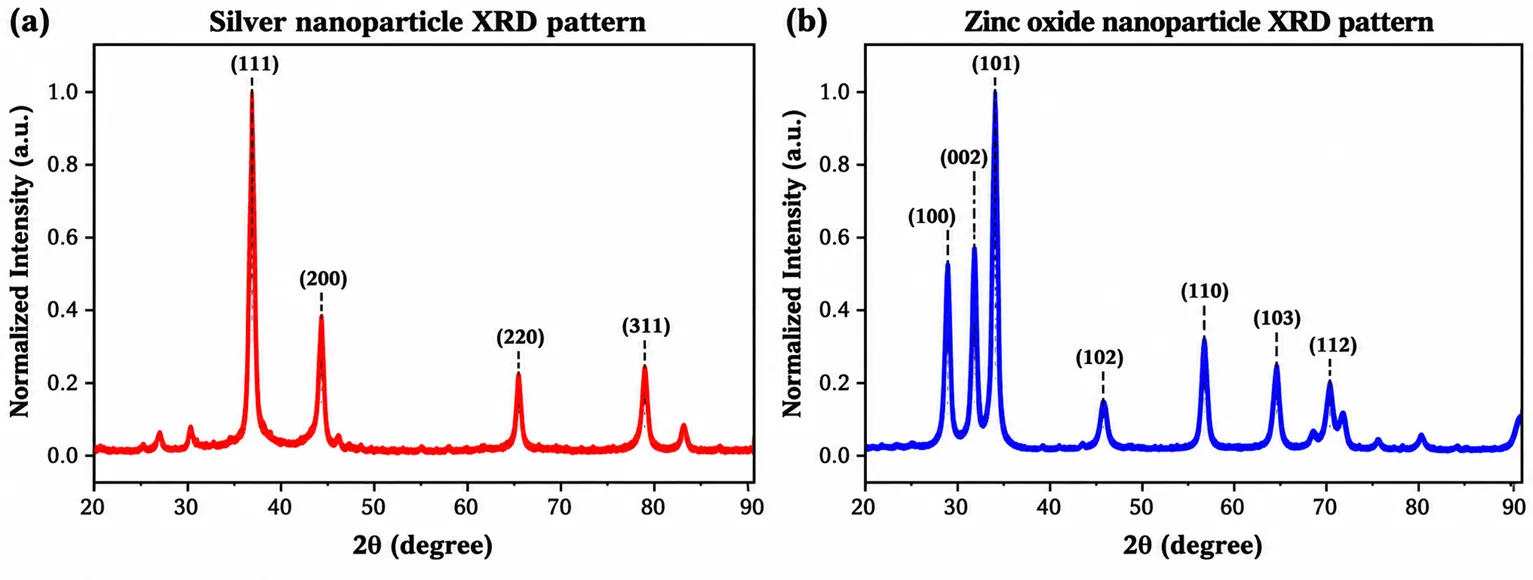
Figure 2: Comparative XRD Patterns of (a) Jujube-Mediated Ag Nanoparticles and (B) Jujube-Mediated ZnO Nanoparticles.
Therefore, the two patterns correspond to different inorganic phases and not to one mixed material. The Ag pattern does not display any identifiable ZnO sequence and the ZnO pattern does not display any Ag sequence which is consistent with the products being separate phases of Ag and ZnO. This distinction is important as the two materials have different bonding, electronic structure and anticipated optical behavior. The phase identification of fcc Ag and wurtzite ZnO is similar to present plant-mediated NPs investigations (Adhavan et al., 2024; Peta & Singh, 2025; Bimal et al., 2026).
The apparent coherent-domain values for the ZnO pattern are in the approximate range of 168–214 nm using the given peak widths. These values are not given as particle diameters. The difference is significant since the diffraction broadening corresponds to coherent crystallite domains while the SEM images in the present study show larger agglomerated structures. Without instrumental-broadening correction and direct particle-size imaging, the Scherrer result should be considered only as an apparent domain estimate.
3.2 FTIR indicates persistent plant-associated surface chemistry
The FTIR spectra in Figure 3 show that both products retain broad high-wavenumber and fingerprint-region features after synthesis. These features are consistent with organic species associated with the plant extract. The spectra should not, however, be used to assign individual peaks to specific jujube metabolites without a reference spectrum of the extract and additional chemical analysis.
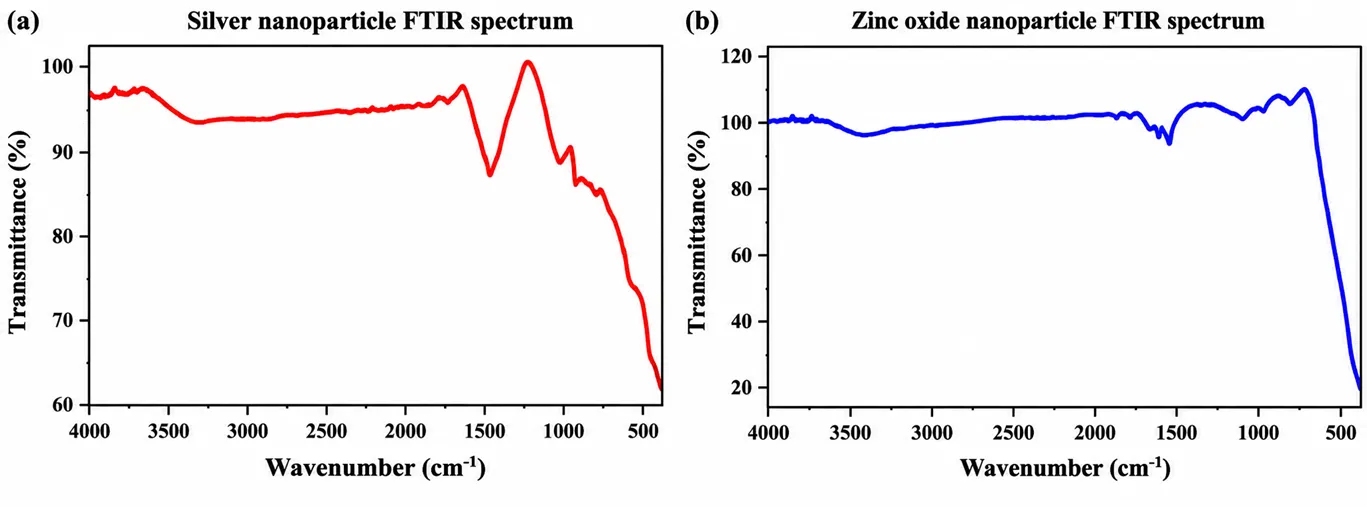
Figure 3: Comparative FTIR Spectra of (a) Jujube-Mediated Ag Nanoparticles and (B) Jujube-Mediated ZnO Nanoparticles.
The low wavenumber response is different for the two materials. The ZnO spectrum extends into the region expected for Zn–O lattice vibrations, but the Ag spectrum does not show any corresponding oxide-lattice feature. The comparison thus supports two conclusions: (i) (i) surface chemistry from the plant is detectable post-synthesis and (ii) the inorganic phase contributes a material-specific low-wavenumber response. Similar plant-associated FTIR bands and inorganic signatures have been reported for green-synthesized Ag and ZnO systems (Karan et al., 2023; Veera et al., 2023; Islam et al., 2024). FTIR alone cannot determine the oxidation state of Ag or the proof of a given surface-capping molecule.
3.3 UV–Vis distinguishes the optical responses of Ag and ZnO
The UV–Vis spectra in Figure 4 show a marked difference between the two materials. The Ag spectrum has a broad optical response rather than a semiconductor-like absorption edge. The ZnO spectrum rises sharply in the near-ultraviolet region, with an optical edge near 392.5 nm.
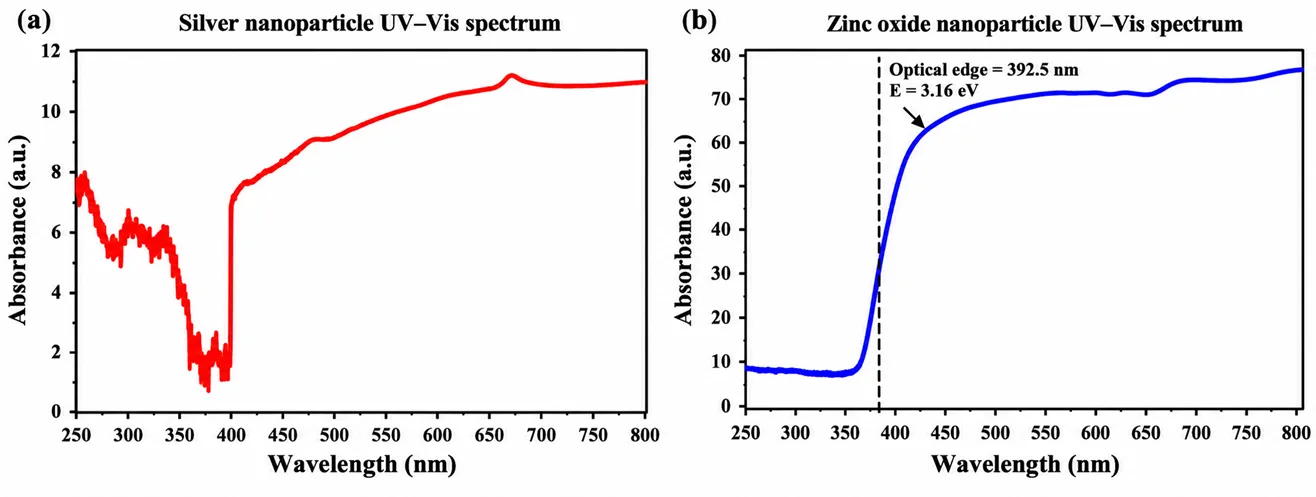
Figure 4: Comparative UV–Vis Responses of (a) Jujube-Mediated Ag Nanoparticles and (B) Jujube-Mediated ZnO Nanoparticles.
Using E = 1240/λ at the ZnO edge yields about 3.16 eV. This value is close to the expected order of magnitude for ZnO but is not presented as a formal Tauc band gap since the absorption coefficient required for that treatment is not included in the data provided. The Ag spectrum is also not forced into a band-gap calculation. Its overall response is interpreted as the optical response of the sample of metallic nanoparticles under the measured conditions.
The difference between the two spectra agrees well with the phase assignment from XRD. Optical responses in Ag systems mediated by plants are generally related to surface and collective electronic effects of nanoparticles. ZnO systems show near-UV absorption edges based on particle structure and synthesis conditions (Takcı et al., 2023; Sadia et al., 2024; Aliannezhadi et al., 2024). Thus, the present data rather reinforce the structural difference between the two products than indicate that the botanical route makes them equivalent in terms of optical properties.
3.4 SEM reveals strong aggregation in both products
The SEM images in Figure 5 provide a direct morphological comparison, as the Ag and ZnO samples were observed at the same three levels of magnification and scale bar. Both samples appear as large agglomerated masses at 1.00 kX. At 5.00 kX magnification, additional granular organization is seen within these aggregates, and at 15.0 kX magnification, more irregular surface features are noted
.
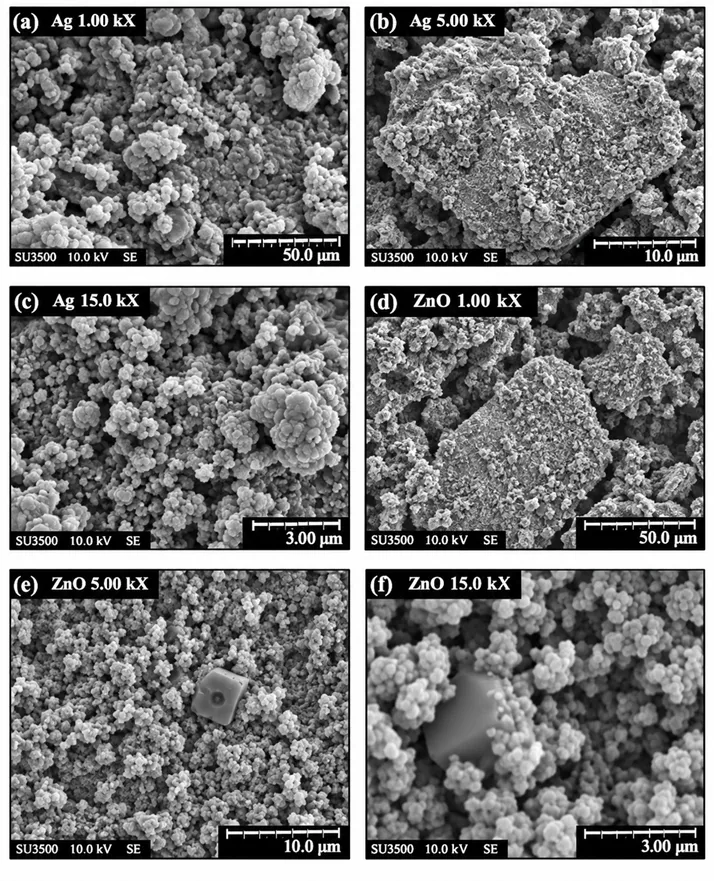
Figure 5: Matched-scale SEM Comparison of AgNPs and ZnO NPs: (A,D) 1.00 kX/50 Μm; (B,E) 5.00 kX/10 Μm; (C,F) 15.0 kX/3 Μm.
Ag shows a rough granular surface with a heterogeneous structure of irregular clusters. ZnO exhibits a rough and aggregated surface with larger irregular domains and smaller granular material distributed over the observed areas. The shared aggregation may be caused by the combined effects of plant-derived surface species, drying, and particle-particle interactions, but the present images do not allow the separation experimentally of the contribution of these effects. Importantly, no numerical primary-particle size is given for either material from SEM. Higher-resolution SEM combined with image analysis or complementary TEM/DLS measurements generally back quantitative particle-size claims (Takcı et al., 2023; Adhavan et al., 2024; Komalakshi et al., 2025).
3.5 EDX confirms the principal elemental signatures
EDX provides elemental information complementary to the structural evidence. The cleaned representative spectra in Figure 6 show Ag together with O, Ca, and a minor Al contribution in the silver sample, while the ZnO sample is dominated by Zn and O with a measurable carbon contribution. The representative quantitative output displayed with the supplied EDX spectra gives Ag 19.10 wt%, O 58.75 wt%, Ca 21.35 wt%, Al 0.80 wt%, and Zn 0.19 wt% for the Ag sample. For the ZnO sample, the corresponding values are C 16.22 wt%, O 24.47 wt%, and Zn 59.31 wt%.
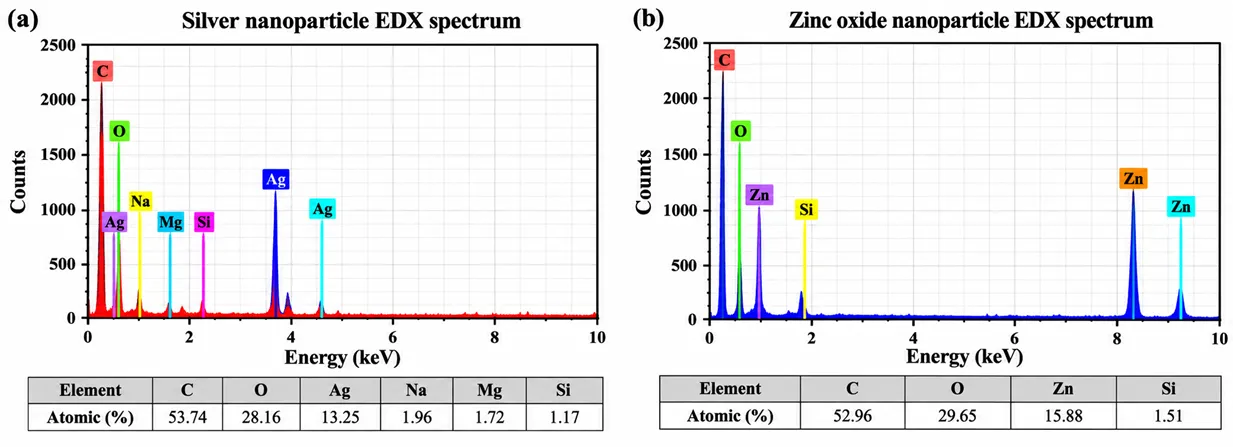
Figure 6: Representative EDX Spectra and Elemental Quantification for (a) Jujube-Mediated Ag Nanoparticles and (B) Jujube-Mediated ZnO Nanoparticles.
The Ag signal is direct elemental evidence for silver in the analyzed region. The Zn and O signals of the second spectrum are consistent with the ZnO phase independently identified by XRD. The extra signals of Ca, Al, and carbon should not be interpreted as the evidence of intentional doping or lattice substitution. They may be residual plant-derived material, analyzed region, sample preparation, or measurement contributions. The EDX data are therefore used here only to support elemental identity, not to establish chemical purity, oxidation state, or defect chemistry. This interpretation is supported by the established plant-mediated nanoparticle studies where EDX is used in combination with XRD and spectroscopy, not as a stand-alone chemical state method (Peta & Singh, 2025; Dagher et al., 2025; Bimal et al., 2026).
3.6 Direct comparison of the five characterization levels
Table 1: Direct Comparison of the Measured Structural, Optical, Morphological and Elemental Characteristics of the Jujube-Mediated Ag and ZnO Nanoparticles.
| Property | AgNPs | ZnO NPs | Interpretation |
|---|---|---|---|
| XRD phase | Face-centred-cubic Ag | Hexagonal wurtzite ZnO | Distinct crystal systems |
| Principal XRD peaks (°) | 38.27, 44.45, 64.55, 77.57 | 31.91, 34.55, 36.38, 47.60, 56.78, 63.02 | Phase-specific fingerprints |
| Optical response | Broad metallic nanoparticle response | Optical edge ≈392.5 nm; ≈3.16 eV | Metal versus semiconductor response |
| SEM scales | 1.00/5.00/15.0 kX; 50/10/3 µm | 1.00/5.00/15.0 kX; 50/10/3 µm | Matched morphology comparison |
| SEM morphology | Rough, granular, strongly aggregated | Rough, granular, strongly aggregated | Common aggregation tendency |
| Representative EDX | Ag 19.10 wt%; O 58.75 wt%; Ca 21.35 wt%; Al 0.80 wt% | Zn 59.31 wt%; O 24.47 wt%; C 16.22 wt% | Elemental signatures; semi-quantitative |
Table 1 shows where the two materials converge and where they separate. Both products are strongly aggregated in the SEM images, and both retain plant-associated FTIR features. Their crystal structures and optical responses, however, are clearly different. XRD identifies fcc Ag and wurtzite ZnO, while UV–Vis distinguishes a broad metallic response from a near-UV ZnO optical edge. EDX then provides independent elemental evidence for the two systems. The agreement among these measurements is stronger than any single technique considered in isolation.
3.7 Position of the present results within recent literature
Recent plant-mediated studies also provide a useful benchmark for the analytical framework applied here. XRD, FTIR, UV–Vis, and electron microscopy were coupled with AgNPs studies using Salvia officinalis, Sambucus ebulus, and Corallocarpus epigaeus, and in some studies EDX was also included (Takcı et al., 2023; Karan et al., 2023; Veera et al., 2023). Similar combinations of XRD, FTIR, UV–Vis, SEM, and EDX have also been used in recent studies of ZnO using onion peel, Eranthemum roseum, Allophylus concanicus, and Jatropha curcas (Islam et al., 2024; Adhavan et al., 2024; Komalakshi et al., 2025; Sharma et al., 2025).
The jujube-specific literature is especially relevant. AgNPs were green synthesized from Z. jujuba leaves in a previous study, and some other studies have reported the synthesis of ZnO from the same plant via different assisted routes. One of the gaps that still remains is the lack of a controlled same-batch AgNP/ZnO comparison, as identified in a 2026 review of these studies (Umar et al., 2026). The present dataset fills that gap, at the level of characterization, by using the same five analytical categories for both products and comparing them at matched SEM scales.
This comparison is not intended as a ranking exercise. The two materials have different functions in their own right. It is more useful to conclude that the structural and optical response can be tuned by varying the inorganic phase while keeping the botanical route constant. This distinction becomes important when comparing green-synthesis studies for different classes of nanoparticles.
4. Limitations
The interpretation is limited by the characterization dataset used in this study. SEM images do not provide sufficient resolution for a defensible primary particle size distribution. The Scherrer values correspond to apparent coherent domains and are not to be considered as particle diameters. The FTIR allows for interpretation at the level of functional groups but not of individual phytochemicals or the presence of a particular capping molecule. EDX is localized and semi-quantitative and cannot determine oxidation state, lattice substitution, or defect chemistry. Finally, the ZnO value of ~3.16 eV is an optical-edge estimate, not a formal Tauc band gap.
Future work should therefore combine the present five-technique framework with higher-resolution TEM, elemental mapping, and XPS to establish particle size, spatial composition, and chemical state quantitatively. Also, application testing such as photocatalysis or antimicrobial assays should be performed on the characterized samples before any claims about performance.
CONCLUSION
The AgNPs and ZnO NPs were prepared under the same botanical frame, but they had different structural and optical identities. XRD exhibited face-centered-cubic Ag at 38.27°, 44.45°, 64.55°, and 77.57°, and the ZnO sample revealed characteristic wurtzite reflections at 31.91°, 34.55°, 36.38°, 47.60°, 56.78°, and 63.02°. FTIR showed detectable plant-associated surface chemistry in both products. UV–Vis showed a broad metallic response for Ag and an optical edge around 392.5 nm, which corresponds to ∼3.16 eV for ZnO. Matched-scale SEM images showed strong aggregation for both materials, and EDX provided complementary elemental evidence for Ag and ZnO.
The main contribution is the direct comparison of the 5 techniques. The results demonstrate that a common plant-derived synthesis platform does not produce interchangeable nanomaterials: the inorganic phase is the dominant factor in the control of the crystal structure and optical behavior, while the plant-associated chemistry remains relevant to the surface. This provides a clear and defensible basis for future application studies of jujube-mediated Ag and ZnO nanoparticles.
Declarations
Ethical approval: Not applicable.
Consent to participate: Not applicable.
Permission to publish: Not applicable.
Competing interests: The authors declare no competing interests.
Data availability: The data supporting the findings of this study are available from the corresponding author on reasonable request.
Author contributions
Hamza Mustapha Umar: Conceptualization, methodology, literature search, data curation, formal analysis and original drafting.
Jamila Lamido Sumaila: Supervision, validation, review and editing, investigation and project administration.
Tarun Vasamsetti: Methodology, Review and editing
Akhilesh Dwivedi: Data analysis, investigation and review
Acknowledgement
The authors gratefully acknowledge the Centre for Advanced Materials & Devices, BML Munjal University, Gurgaon, India, for providing laboratory facilities, technical support and instrumentation used for the characterization measurements and for assistance with acquisition and analysis of the experimental data.
REFERENCES


Hamza Mustapha Umar, Tasiu Zangina, Jamila Lamido Sumaila, Tarun Vasamsetti, Akhilesh Dwivedi, From Ziziphus Jujuba Leaves to Nanoparticles: Green Synthesis and Characterization of Ag and ZnO Nanostructures, Int. J. Sci. R. Tech., 2026, 3 (10), 695-704. https://doi.org/10.5281/zenodo.23279649
 10.5281/zenodo.23279649