
We use cookies to ensure our website works properly and to personalise your experience. Cookies policy
Mahakal Institute of Technology, Ujjain (M.P.)
This research presents a comprehensive numerical investigation into the effects of internal surface roughness on pressure drop in turbulent pipe flow for five commonly used engineering materials: Cast Iron, Galvanized Iron, Asphalted Cast Iron, Concrete, and PVC. Utilizing Computational Fluid Dynamics (CFD) with ANSYS Fluent 2021 R1, the study implements standardized sand-grain roughness models within a validated simulation framework. A three-dimensional pipe geometry (20 mm diameter, 500 mm length) is analyzed under steady-state turbulent conditions across Reynolds numbers from 4,000 to 100,000 using the k-epsilon turbulence model with enhanced wall treatment. Results quantify the significant influence of material-specific roughness on hydraulic resistance, demonstrating that pressure drop increases non-linearly with roughness height. PVC exhibits the lowest pressure drop, while Concrete shows the highest, with variations up to 25% between materials at identical flow conditions. The study provides comparative performance rankings, establishes empirical correlations between roughness parameters and friction factors, and offers detailed flow visualizations including velocity profiles and turbulence intensity distributions. The findings deliver practical engineering guidelines for optimal material selection in piping system design, with direct implications for energy efficiency, pump sizing, and operational cost reduction in fluid transport applications..
Pressure drop in piping systems represents a fundamental challenge in fluid engineering with direct consequences for energy consumption, operational costs, and system efficiency. In applications ranging from municipal water networks to industrial process plants, pumping energy constitutes 20-30% of total operational energy, with pipe friction contributing significantly to this demand. The internal surface characteristics of pipes, quantified as roughness, critically influence this hydraulic resistance, especially within the turbulent flow regimes prevalent in engineering practice.
While classical approaches like the Darcy-Weisbach equation provide theoretical foundations, practical implementation relies on the Moody chart's generalized roughness values. These values, however, often fail to capture the nuanced differences between material types, manufacturing processes, and aging effects. Computational Fluid Dynamics (CFD) has emerged as a transformative tool, allowing detailed examination of flow physics that are difficult to capture experimentally. By simulating fluid behavior at a fundamental level, CFD enables parametric studies of roughness effects with controlled precision.
This investigation employs ANSYS Fluent to conduct a systematic comparative analysis of five widely used pipe materials: Cast Iron, Galvanized Iron, Asphalted Cast Iron, Concrete, and PVC. Using a standardized circular geometry (20mm diameter, 500mm length) and implementing the k-epsilon turbulence model with enhanced wall treatment, the study isolates roughness as the primary variable. Each material is modeled with equivalent sand-grain roughness heights derived from established engineering standards, ensuring consistency across simulations.
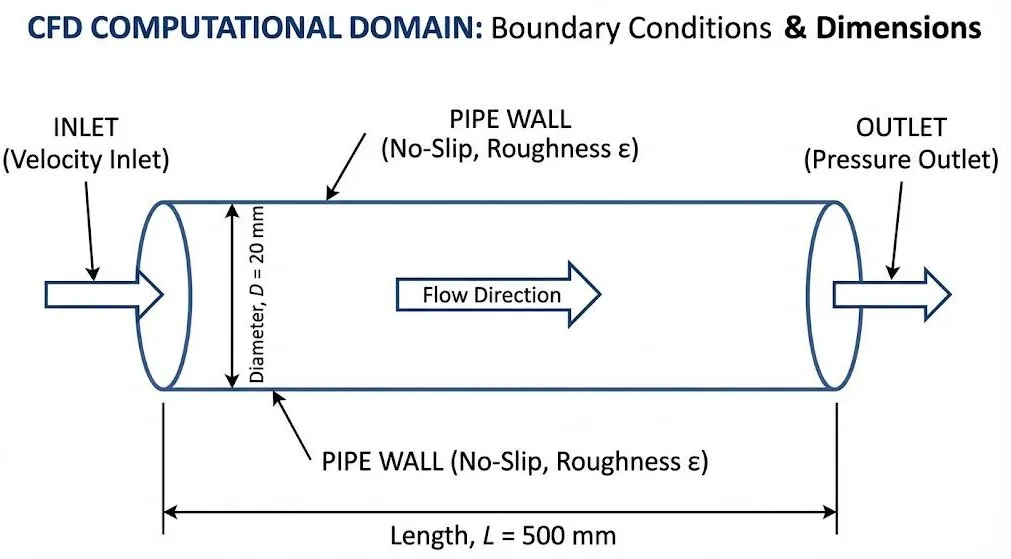
Fig 1.1 CFD Computational Domain
The research addresses a significant gap in available data by providing directly comparable performance metrics under identical flow conditions. Beyond quantifying pressure drop variations, it examines associated flow characteristics including velocity profile development, boundary layer behaviour, and turbulence intensity distributions. The findings aim to bridge the divide between theoretical fluid mechanics and practical engineering design, offering evidence-based insights for material selection and system optimization.
Ultimately, this study contributes to more sustainable engineering practices by providing data that can reduce energy waste in fluid transport systems. The validated CFD methodology also establishes a reference framework for future investigations of surface-fluid interactions in internal flows.
The selection of appropriate piping materials represents a critical economic and technical decision in infrastructure projects, where initial material costs must be balanced against long-term operational expenses related to energy consumption and maintenance. Different materials exhibit inherently distinct surface morphologies due to their manufacturing processes—cast metals display microscopic irregularities from moulding processes, while extruded polymers like PVC demonstrate relatively smoother surfaces with longitudinal striations. These surface characteristics evolve during service life through corrosion, scaling, or biological fouling, further modifying hydraulic performance.
2.1 Overall Computational Approach
This research employs a systematic computational methodology using ANSYS Fluent 2021 R1 to investigate roughness effects on pressure drop. The study follows a three-phase approach:
(1) Pre-processing and model development, (2) Simulation execution, and (3) post-processing and analysis. The workflow adheres to established CFD best practices for validation and accuracy assurance.
2.2 Geometry and Domain Specification
A three-dimensional straight circular pipe geometry will be modeled with the following specifications:
The geometry will be created using ANSYS Design Modeler, ensuring water-tight volumes and proper edge connectivity for high-quality meshing.
2.3 Mesh Generation Strategy
A structured hexahedral mesh will be implemented for numerical accuracy and computational efficiency:
2.4 Physics Setup and Boundary Conditions
2.4.1 Solver Settings:
2.4.2 Turbulence Modeling:
2.4.3 Material Properties:
2.4.4 Boundary Conditions:
|
Boundary |
Type |
Specification |
|
Inlet |
Velocity Inlet |
Varied velocities to achieve Re = 4,000 to 100,000 |
|
Outlet |
Pressure Outlet |
0-gauge pressure (atmospheric) |
|
Pipe Wall |
No-Slip with Roughness |
Sand-grain roughness heights as per Table 1 |
|
Symmetry |
Axisymmetric |
For 2D-axisymmetric validation cases |
Table. 2.1 Boundary Conditions
2.4.5 Roughness Implementation:
Roughness will be implemented using Fluent's sand-grain roughness model with the following equivalent roughness heights:
|
Material |
Roughness Height (ε) |
Roughness Constant (C_s) |
Source |
|
PVC |
0.0015 mm |
0.5 |
ASHRAE Handbook |
|
Galvanized Iron |
0.15 mm |
0.5 |
Moody Chart |
|
Asphalted Cast Iron |
0.12 mm |
0.5 |
Engineering Standards |
|
Cast Iron |
0.26 mm |
0.5 |
Moody Chart |
|
Concrete |
1.00 mm (average) |
0.5 |
Civil Engineering References |
Table 2.2: Material Roughness Parameters
2.5 Simulation Cases and Flow Conditions
2.6 Solution Strategy and Convergence Criteria
2.7 Validation and Verification Protocol
2.8 Data Extraction and Analysis Methods
2.9 Post-processing and Visualization
2.10 Surface Roughness Comparison:
|
Material |
Roughness (mm) |
Pressure Drop Impact |
|
PVC |
0.0015 |
Low |
|
Steel |
0.045 |
Moderate |
|
Copper |
0.0015 |
Low |
|
Cast Iron |
0.26 |
High |
|
Material |
Roughness (mm) |
Pressure Drop Impact |
|
PVC |
0.0015 |
Low |
|
Steel |
0.045 |
Moderate |
|
Copper |
0.0015 |
Low |
|
Cast Iron |
0.26 |
High |
Smoother pipes (copper , PVC) increase efficiency by lowering pressure drop . Cast iron and other rough materials raise energy expenses.
3.1 Primary Numerical Outcomes
b. Scientific and Technical Contributions
c. Visualization and Graphical Outcomes
d. Practical Engineering Outcomes
1. When material roughness becomes a dominant design factor
2. Cost-benefit analysis of smoother versus cheaper materials
3. Expected performance degradation with aging/corrosion
e. Validation and Benchmarking Outcomes
i. CFD Validation Report: Comprehensive comparison between simulation results and:
1.Theoretical predictions from Darcy-Weisbach/Colebrook equations
2.Available experimental data from literature
3.Moody chart predictions
ii. Error Analysis: Quantification of numerical errors, modeling uncertainties, and validation discrepancies with root-cause analysis.
f. Research Dissemination Outcomes
i. Thesis Document: Comprehensive documentation of methodology, results, and conclusions.
ii. Potential Journal Publication: Condensed version suitable for journals like Journal of Fluids Engineering, International Journal of Heat and Fluid Flow, or Engineering Applications of Computational Fluid Mechanics.
iii. Conference Presentation: Key findings presented in graphical format suitable for technical conferences.
g. Expected Numerical Findings (Hypotheses)
Based on preliminary analysis, the study expects to find:
h. Implications for Future Research
Multiphase Flows: In rough pipes, multiphase flows (gas-liquid, liquid-solid) require more intricate modeling, particularly with regard to phase interaction and instability. Advanced Characterization: Research must examine roughness texture (geometry, frequency, anisotropy) and its effects on boundary layers in addition to basic height. Application-Specific Optimization: Examine how particular roughness types (such as triangular or riblets) can improve heat transfer or mixing in systems like microreactors or cooling loops, rather than merely reducing pressure drop. For precise industrial design, create reliable computational fluid dynamics (CFD) models that incorporate surface geometry, material characteristics, and operating conditions (Re, flow type). Real-World Data: To close the gap between idealized models and real-world performance, concentrate on experimental validation for aged or fouled pipes.
The methodology and findings will enable:
Optimization studies for pipe sizing and material selection algorithms Multiphase Flows & Roughness:
4. SIGNIFICANCE AND APPLICATIONS
4. Theoretical Significance
4.1 Advancement in Fundamental Fluid Mechanics
This research contributes significantly to the fundamental understanding of turbulent boundary layer interactions with rough surfaces. While classical theories (Nikuradse, Moody) established basic relationships, this study provides detailed, quantifiable data on how specific roughness morphologies—represented by equivalent sand-grain values for actual engineering materials—alter turbulent flow structures. The investigation offers insights into:
4.2 Computational Fluid Dynamics Methodology Development
The study advances CFD practice by developing and validating a robust methodology for roughness implementation in commercial software. Specific contributions include:
4.3 Enhancement of Friction Factor Correlations
Current friction factor correlations (Colebrook-White, Swamee-Jain) rely heavily on Nikuradse's sand-grain experiments. This research provides contemporary data that could lead to:
4.4 Contribution to Turbulence Modeling Theory
The detailed flow field analysis contributes to turbulence modeling theory by:
4.5 Practical Applications
Engineering Design Optimization
The research provides directly applicable data for practicing engineers:
Material Selection Guidance:
System Design Enhancement:
4.6 Energy Efficiency and Sustainability Impact
The research supports global energy conservation efforts:
Direct Energy Savings:
Environmental Benefits:
4.7 Maintenance and Asset Management
The findings support improved infrastructure management:
Preventive Maintenance Planning:
Renovation and Rehabilitation:
4.8 Educational and Training Applications
The research serves as a valuable educational resource:
Academic Curriculum Enhancement:
Professional Development:
4.9 Industrial Sector Applications
Specific applications across various industries:
Water and Wastewater Sector:
Oil and Gas Industry:
Chemical and Process Industries:
HVAC and Building Services:
4.10 Software and Tool Development
The methodology supports development of engineering tools:
Design Software Enhancement:
Digital Twin Applications:
CFD Software (e.g., Ansys Fluent, OpenFOAM): Simulate fluid flow, incorporating detailed geometric roughness from 3D scans (CT scans) or standard roughness values (e.g., sand-grain equivalent) for complex models.
Machine Learning Models (ANN): Develop predictive tools using Artificial Neural Networks to establish correlations between physical parameters (roughness, material) and pressure drop.
Discrete Element Method (DEM): Used for granular flows (like soil-pipe interaction), simulating pipe roughness using overlapping spheres for micro-mechanical analysis.
Empirical/Semi-Empirical Tools: Software implementing formulas like Colebrook-White or developing new correlations based on experimental data for specific materials (cast iron , galvanized iron, PVC , concrete, asphalted cast iron ).
Tools for Simulating Roughness Effects:
5. LIMITATIONS AND SCOPE
5.1 Research Scope
5.1.1 Material Scope
The investigation is deliberately limited to five commercially significant pipe materials representing distinct categories:
Metallic Pipes:
Non-Metallic Pipes:
Flow Regimes: Examining the impact of roughness in laminar, transitional, and turbulent flows. Roughness effects are minimal in laminar flow but become dominant in fully turbulent regimes.
Varied Materials & Roughness Characterization: Comparing different materials (e.g., cast iron, galvanized iron, PVC, concrete, asphalted cast iron) and their associated absolute roughness values, which can range widely (from 0.0015 mm for PVC to 3.0 mm for concrete). The study can use established standards (like the ASME B46.1-2002 standard for roughness parameters) to characterize the surfaces.
Flow Conditions: Investigating the effects across various flow velocities (Reynolds numbers), fluid properties (viscosity, density), and potentially single-phase (liquid or gas) or multiphase flows (e.g., slurries).
Scale of Study: Ranging from conventional large-diameter pipes to microchannels, as roughness effects can vary significantly with pipe diameter (relative roughness).
Predictive Modeling: Developing and validating computational fluid dynamics (CFD) models or empirical correlations (like the Moody chart or Darcy-Weisbach equation) to accurately predict pressure drop for different roughness conditions.
5.2.2 Fluid and Flow Conditions
Working Fluid: Deionized water at constant temperature (25°C)
Flow Regime: Turbulent flow only (Re > 4000)
5.2.3 Geometric Scope
Pipe Configuration: Straight, horizontal, circular pipes
Surface Condition: New pipe condition with standard manufacturing roughness
5.2.4 Numerical Methodology Scope
CFD Approach: Steady-state RANS modeling
Software Platform: ANSYS Fluent 2021 R1 Academic Version
5.3 Research Limitations
5.3.1 Roughness Modeling Limitations Equivalent Sand-Grain Approximation:
Constant Roughness Assumption:
5.3 Numerical Modeling Limitations RANS Modeling Assumptions:
Near-Wall Treatment:
Mesh Resolution Constraints:
5.4 Physical Process Limitations Single-Phase Flow:
Isothermal Conditions:
Rigid Wall Assumption:
5.5 Scope for Future Work
5.5.1 Immediate Extensions
5.5.2 Methodological Extensions
5.5.3 Application Extensions
5.5.5 Experimental Validation
REFERENCES

Prayas Malviya*, Mukesh Shinde, Investigation Of Surface Roughness Effects On Pressure Drop In Varied Pipe Materials, Int. J. Sci. R. Tech., 2026, 3 (6), 683-695. https://doi.org/10.5281/zenodo.20621664
 10.5281/zenodo.20621664