

We use cookies to ensure our website works properly and to personalise your experience. Cookies policy
1Department of Chemical Engineering, Visvesvaraya National Institute of Technology, Nagpur-440010, Maharashtra, INDIA. E-mail: kalpanatrue@gmail.com
2Department of Civil Engineering, Visvesvaraya National Institute of Technology, Nagpur- 440010, Maharashtra, INDIA. E-mail: diliplataye@rediffmail.com
1Department of Environmental Science, Women’s College Samastipur, Bihar, 848101
Taguchi method is a powerful design in experimental studies. This method uses the minimum number of test factors affecting the overall process which will save cost and time. Taguchi method was used to optimize the adsorption of fluoride from aqueous solutions by adsorbents prepared from Bael Fruit Shell and Pongamia Pinnata. The carbons from Bael Fruit Shell (CBS) and bark of Pongamia Pinnata (PP) have been used as adsorbent to remove fluoride from water. The experiments were designed according to Taguchi’s (L9) orthogonal array to optimize experimental runs. The Batch studies were carried out using Ion electrode (HI-3222 pH/ORP/ISE meter, Hanna instruments, India) with four process parameters viz. Dose (m), Initial concentration of fluoride (C0), Temperature (T), Contact time (t). Analysis of variance was applied to determine the significant parameters that effect adsorption. The results indicated that the % of fluoride removal was influenced primarily by adsorbent dose (70.25%) followed by initial concentration (22.09%) in case of CBS while in case of PP initial concentration (45.83%) is most significant factor followed by the adsorbent dose (34.29 %) for the removal of fluoride. In both case Temperature (T) and Contact time (t) have little effect on fluoride removal. This study focuses on understanding of adsorption process and developing a cost effective technology for treatment of fluoride in water.
Water is essential for all physiological activities associated with humans, animals, and the plant kingdom. However, the nature and the quality of surface and ground water are widely variable and are determined by the local geological history, including the rocks and hidden ore deposits surrounding the sites for the collection of the water, and other factors, such as the movement of elemental particles and pollutants by lentic, lotic waters and underground aquifers1.
Fluoride mineral is essential as well as fatal for the dental and skeletal growth of human. It inhibits dental carries at low doses, and accelerates dental and skeletal fluorosis at high doses2. Depending upon the body weight, a minimum quantity of fluoride intake is essential for the formation of caries resisting dental enamel and for the normal process of mineralization in hard tissues. The element is metabolized from both electrovalent and covalent compounds. Low fluoride concentrations stabilize the skeletal system by increasing the size of the apatite crystals and reducing their solubility. About 95% of the fluoride in the body deposited in hard tissues, and it continues to be deposited in calcified structures even after other bone constituents (Ca, P, Mg, CO3 2− and citrate) have reached a steady state. Drinking of water from the groundwater sources is the main route of fluoride intake in rural areas of underdeveloped countries like India. The World Health Organization (WHO, 2006) set up the limits of maximum allowed concentration (MAC) of fluoride (mg/L) in drinking water is 1.0 for the tropical countries and 1.5 for the cooler climatic countries3. Latest guidelines from the Bureau of Indian Standards (BIS) suggest that the fluoride limit in ground water used for drinking and cooking purposes should not be greater than 1mg/L4. Thus, the drinking of groundwater that contains fluoride above the MAC level (1.5 mg/L) is a serious concern to the public health. In India, it is one of the biggest natural calamities. Depending on the geological formation, fluorite (CaF2) and fluoroapatite [3Ca3 (PO4)2·CaF2] minerals are hosted in the vein of all most all rocks in sub-surface soil. Surface water rich with bicarbonate when percolated through mineral beds undergoes water–mineral interaction, and releases fluoride due to some chemical reactions5 under the appropriate geophysical conditions. The fluoride being released mobilizes to the ground water unless any other natural phenomena play any significant role for arresting fluoride from the water that percolates.
The fluoride content in ground water tends to increase due to heavy withdrawal of water for agriculture purpose, poor recharging, low rainfalls and pollution from industrial effluents. India has declared fluorosis as an epidemic and has banned the use of water for drinking and cooking if the fluoride content is more than 1.5 mg/L. A study by United Nations International Children’s Emergency Fund (UNICEF) shows that fluorosis is endemic in at least 27 countries across the globe. These countries are Algeria, Argentina, Australia, Ban- gladesh, China, Egypt, Ethiopia, India, Iran, Iraq, Japan, Jordan, Kenya, Libya, Mexico, Morocco, NewZealand, Palestine, Pakistan, Senegal, Srilanka, Syria,Tanzania, Thailand, Turkey, Uganda, and United ArabEmirates6,7.In India, Fluorosis was first detected in Nellore district of Andhra Pradesh in 19378 . “According to the CGWB Annual Ground Water Quality Report 2025, 8.05% of the groundwater samples analysed across India exceeded the BIS permissible limit of 1.5 mg/L for fluoride, indicating that fluoride contamination remains a significant groundwater-quality concern in several regions of the country9.”Several methods have been applied to remove excessive fluoride from aqueous solution, such as adsorption10,11precipitation12 ion-exchange13, electrodialysis14 and reverse osmosis15. Among these methods, adsorption is still one of the most extensively used methods, because of its simplicity and the availability of a wide range of adsorbents. Various materials such as activated alumina10, clay16, soil17, bone char18, zeolites19 granular ferric hydroxide20 and biosorbent21 have been successfully tested for defluoridation of drinking water. De et. al. used de-oiled Pongamia Pinnata seed cake, a waste which is generated after oil extraction and converted it into engineered biochar (EBC)22 This EBC was used for the removal of fluoride from ground water. Pongamia Pinnata has been extensively investigated for other contaminants than fluoride for examples iron oxide impregnated pongamia pinnata biochar has been studied for arsenic removal from water by Indurkar et.al. 23
Taguchi design approach helps in finding the effect of the factors on characteristic properties and the optimal condition of the factors. This is one of the better and simple ways to optimize design for performance, cost and quality. The advantage of the Taguchi optimization design over the conventional optimization is the experimental conditions are determined with least variability where as in conventional optimization it is determined on the basis of measured values of the characteristic’s properties. The Signal/noise ratio is used to measure the quality characteristics deviating from the desired value in Taguchi method. The experimental conditions having the maximum S/N ratio are considered as the optimal conditions and the variability characteristics are inversely proportional to the S/N ratio. The steps for implementing Taguchi experimental design: a) Select the output variable to be optimized, b) identify factors (input variables) affecting output variable and choose levels to be tested, c) select orthogonal array, d) assign factors and interactions to the columns of the array e) perform experiments f) carry out a statistical analysis and the signal-to-noise ratio and determine the optimal conditions to adjust factor levels and g) perform confirmatory experiments 24.
Kim et al. optimized the experimental conditions based on Taguchi design for the formation of nano-sized silver particles by chemical reduction method25. Mohammadi et al. separated copper ions by electrodialysis26 Madaeni and Koocheki optimized the conditions for wastewater treatment using spiral- wound reverse osmosis element27. Kaminari et al. used an electrochemical reactor for recovering heavy metals from acidified aqueous solutions for different process parameters as metallic ion concentration, current density and bed expansion28. Plessis and Villiers applied Taguchi’s method in evaluation of mechanical flotation in waste activated sludge thickening29. Moghaddama et al. used Taguchi’s design methodology to determine the optimum purification conditions for minimizing the lead, cadmium, nickel and cobalt contents in the leaching solutions obtained from ammoniacal ammonium carbonate leaching of non-sulphide zinc ores30. Srivastav et al applied this methodology for multi-component adsorption of metal ions onto bagasse fly ash (BFA)31. Srivastav et al., used this methodology for adsorption of metal ions onto rice husk ash32. Lataye et al. used optimization process for multicomponent sorptive removal of toxics pyridine, 2-Picoline and 4-Picoline from aqueous solution by Bagasse fly ash33. This method was applied to optimize the treatment conditions of polyester-resin effluent by means of Advanced Oxidative Processes (AOPs) using chemical oxygen demand (COD) as response parameter by Siliva et al34. The influence of each independent parameter including respective interactions was evaluated by Taguchi Method, which allowed determining the most statistically significant variables and conditions to best fit the process.
Gottipati and Mishra studied adsorption of activated carbon prepared from bael fruit (Aegle marmelos) shell (BFS) for the removal of hexavalent chromium in aqueous solution35 . They found 92.81% removal at pH 6.39 at dose of 2.18 g/L. Anandkumar and Mandal also studied the Cr (VI) removal from aqueous phase by using activated bael shell. Maximum removal was found at pH 2 and maximum adsorption capacity was 17.27 mg/g. However Pongamia Pinnata as adsorbent has not been found in literature. This is the first study of pongamia pinnata as adsorbent for fluoride removal36.
MATERIAL AND METHODS
Carbon from Bael Fruit Shell (CBS) was obtained from Local Park, Kitchen garden of sadar area of Nagpur, India. It was crushed to reduce the size, washed several times with distilled water, dried, heated in muffle furnace for about 2 hours at 450 °C, washed, oven dried at 100 °C and stored for use. Pongamia Pinnata locally known as Karanza (PP) was obtained from VNIT campus and sadar area of Nagpur. It was cut into small pieces washed several times with double distilled water, Sun dried for 3-4 days, oven dried for 3-4 hours at 100 °C, stored in vaccum dessicators.
The physico-chemical characteristics of CBS and PP were determined using standard methods mention in APHA37. Proximate analysis was carried out using standard procedure38 (IS: 9235-1979, 2003). Scanning electron microscopy (SEM) micrographs of samples were obtained using a field emission scanning electron microscope (JSM-7600F, Jeol). The zero surface charge characteristics of the CBS and PP were determined by using solid addition method39. Particle size analysis of the adsorbent was carried out as per IS 2720 (part-4), 1985 using standard sieves40. Surface area was analysed (using Brunauer Emett and Teller method) by using Micromeritics USA, ASAP 2020, surface area and porosity analyser.
All the chemicals used in present study were of analytical reagent grade and were procured from the Global Marketing, Nagpur, India. Fluoride buffer was prepared by placing approximately 500 ml DDW in a liter beaker and 57 ml glacial acetic acid, 58 g NaCl, 4.0 g 1, 2 Cyclohexylenediaminetetraacetic acid (CDTA) was added. Beaker was placed in cool water bath and 6 N NaOH was slowly added until pH was in between 5.3 and 5.5. This mixture was transferred to 1 liter volumetric flask and distilled water was added to the mark. For measuring unknown concentration of fluoride equal volume of sample and buffer was taken in beaker. Electrodes (HI-3222 pH/ORP/ISE meter, Hanna Instruments, India) were immersed in it while stirring on a magnetic stirrer and direct reading of fluoride was taken37.
3. Taguchi’s Design of Experimental Methodology
Taguchi’s parameter design method is a powerful tool for optimizing the performance characteristic of a product/process 41,42. The aim of a parameter design experiment is to identify and design the settings of the process parameters that optimize the chosen quality characteristic and are least sensitive to noise (uncontrollable) factors. In the present study, the goal is to evaluate the effects of process parameters on the performance measure and the optimum combination of control factors that would maximize the adsorption capacity, of CBS and PP for fluoride removal. Selection of control factors and their levels are made on the basis of some preliminary trial experiments conducted in the laboratory and also from literature review on the subject. Four control factors such as Dose (m), Initial concentration of fluoride (Co), Temperature (T), Contact time (t) have been selected for present study. Each of the four control factors is treated at three levels in case of CBS and PP as shown in Table 1
Table 1: Process Parameters for Fluoride Removal by Using CBS and PP
| Factors Parameters | CBS | PP | ||||||
|---|---|---|---|---|---|---|---|---|
| Level 1 | Level 2 | Level 3 | Level 1 | Level 2 | Level 3 | |||
| A | Dose, m (g/100ml) | 0.2 | 0.4 | 0.6 | 0.1 | 0.2 | 0.3 | |
| B | Initial concentration of fluoride, Co (mg/L) | 4 | 6 | 8 | 2 | 4 | 6 | |
| C | Temperature, T (K) | 293 | 303 | 313 | 293 | 303 | 313 | |
| D | Contact time, t (min.) | 30 | 60 | 90 | 30 | 60 | 90 | |
The choice of three levels has been made because the effect of these factors on the performance characteristic may vary nonlinearly.
3.1. Design of Experiment
The experiments were designed based on the orthogonal array technique. An orthogonal array is a fractional factorial design with pair wise balancing property. Using orthogonal array design the effects of multiple process variables on the performance characteristic can be estimated simultaneously while minimizing the number of test runs. An L9 (34) standard orthogonal array as shown in Table 3 was employed for the present investigation. This array is most suitable to provide the minimum degrees of freedom as 9 [= 1 + 4 x (3–1)] required for the experimental exploration.
The next step is to design the matrix experiment and define the data analysis procedure. Before selecting a particular OA for an experiment two items must be established first43 (Ross, 1988).
(i) The number of parameters
(ii) The number of levels for the parameters of interest.
The OA selected must satisfy the total degrees of freedom of the OA ≥ total degree of freedom required for the experiment.
It is decided to study each selected parameter at three levels, because non-linear behaviour (if any) of the parameters of a process can only be determined if more than two levels are used44. With four parameters each at three levels the, the total DOF required is 8 [= 4 x (3-1)], since a three level parameter has 2 DOF (No. of level-1). Hence, an L9 (34) OA (a standard 3- level OA) has been selected for these phases of work.
Table 2 represents the layout of the experimental design, which has been obtained by assigning the selected factors and their levels to appropriate columns of L9 orthogonal array. This array has 9 rows and 4 columns and each row represents a trial condition while each column accommodates a specific process parameter. Moreover, the notation 34 implies that at most 4 factors, each at 3 levels can be investigated using this OA and their main effects can be estimated provided all other interactions are negligible which is assumed in the present case. The numbers in each column indicate the levels of specific factors (A, B, C and D). However, while conducting the experiments the test runs have been randomly made to avoid the unidentified noise sources, which are not considered but could have an adverse impact on the response characteristic
Table 2: Taguchi’s Orthogonal Arrays L9 (34) Design44
| Order of Expt. | Run | Factors | |||
|---|---|---|---|---|---|
| Dose | Co | Temp. | Time | ||
| A | B | C | D | ||
| 6 | 1 | 2 | 3 | 1 | 2 |
| 5 | 2 | 2 | 2 | 3 | 1 |
| 7 | 3 | 3 | 1 | 3 | 2 |
| 2 | 4 | 1 | 2 | 2 | 2 |
| 8 | 5 | 3 | 2 | 1 | 3 |
| 9 | 6 | 3 | 3 | 2 | 1 |
| 3 | 7 | 1 | 3 | 3 | 3 |
| 4 | 8 | 2 | 1 | 2 | 3 |
| 1 | 9 | 1 | 1 | 1 | 1 |
3.2. Batch Experimental Adsorption Studies (phase 2)
Batch adsorption experiments were performed for fluoride removal by using the selected 9 experimental trials, in combination with four parameters at three levels as shown in Table 2. For each experimental run 100 ml of aqueous solution, having different fluoride concentration was taken in 250 ml stoppered conical flask containing specific dosages of all three adsorbents. These flasks were agitated at constant shaking speed of 150 ± 5 rpm in temperature controlled orbital shaker (REMI Instruments, Mumbai, India) at required temperatures. The samples were withdrawn at appropriate time interval filtered and analysed for the residual fluoride by using Ion electrode (HI-3222 pH/ORP/ISE meter, Hanna instruments, India).
In Taguchi technique, the variation of the response is also examined using an appropriately chosen S/N ratio. Broadly speaking, the S/N ratio is the ratio of the mean (signal) to the standard deviation (noise). These S/N ratios, derived from the quadratic loss function, are expressed on a decibel (dB) scale. The formula used to compute the S/N ratio depends on the objective function. Generally, three standard S/N equations are widely used to classify the objective function as: 'larger the better', 'smaller the better', or 'nominal the best'. However, regardless of the type of performance characteristic, a larger S/N ratio is always desirable. The equation for calculating S/N ratios for HB type characteristics is given as follows:
[Figure - see the formatted PDF]
(1)
Where Yi is the value of characteristic in an observation i. R is the number of observations or number of repetitions in a trial
3.3. Analysis of Experimental Data and Prediction of Performance (phase 3).
The obtained experimental data was processed with “higher is better” (HB) quality characteristics to determine the optimum conditions for the adsorption, to identify the influence of individual factors on adsorption and to estimate the performance (q tot) under the optimum condition.
From among the methods suggested by Taguchi for analyzing the data, following methods have been used in the present work:
i) Plot of the average response curves
ii) ANOVA (Analysis of Variance) for raw data
The plot of the average response at each level of a parameter indicates the trend. It is a pictorial representation of the effect of parameters on the response. The change in the response characteristic with the change in levels of a parameter can easily be visualized from these curves.
For parameter A (Table 3), the level totals of the response raw data at A1, A2 and A3 are calculated by adding the responses corresponding to the levels L1, L2 and L3 are respectively. For example
A (1) = Level total due to parameter A at level L1
A (1) = (y11+y22+y13) + (y21+y22+y23) +……+ (y41+y42+y43) (2)
Where yij = response of trial i and repetition j
i.e. y11 = response of trial 1 and repetition 1.
Similarly, other level total A (2), A (3) are calculated. Similarly for other parameters level total are calculated.
3.3.1 Main effects due to parameters and interactions46
Main effects due to parameter A when level changes from L1 to L2 and L2 to L3 and L3-L1 are45 .

3.3.2 Calculation of variance45 (ANOVA)
ANOVA calculation follows the following procedure:
Step 1. Total of all results (TT)
[Figure - see the formatted PDF]
(5)
n = Total numbers of trials = 27
R= Total number of repetitions = 3
Step 2. Correction factor (C.F.)
[Figure - see the formatted PDF]
C.F. = (6)
Where, N= Total number of experiments = Rx n = 9x3 =27
Step 3. Total sum of squares (SST)
= (Sum of Sq of All Results - C.F.)
[Figure - see the formatted PDF]
SST=-C.F (7)
Step 4. Sum of squares due to a parameter (SS)
[Figure - see the formatted PDF]
(8)
Where NA1, NA2, NA3 are number of trials with parameter A at level 1, 2 and 3 respectively. The sum of squares SSB, SSC, SSD etc. are also calculated in similar manner.
Step 5. Error sum of squares (SSe)
SSe = SST – (SSA + SSB + SSc + SSD+ SSE+ SSF+ SSG+ SSH (9)
Where ‘e’ stands for error term.
Step 6. Total and parameter degrees of freedom (DOF)
f T = Total DOF = Total number of results-1 (10)
= (Total number of trials x no .of repetiton-1) = 9x3-1=26
fA = DOF of parameter A
= (Number of levels of parameter A-1) = 3-1=2 similarly, fB =2, fC = 2,fD=2,fE=2, fF =2.
Step 7. Mean square of Variance (Vm)
VA = variance due to parameter A= SSA/ fA (11)
VB = SSB/ fB, VB = SSc/ fc etc.
Ve = Variance due to error = SSe / fe
Step 8. Percentage contribution (P)
PA = % contribution of parameter A towards mean of the response
[Figure - see the formatted PDF]
= (12)
Similarly PB, Pc etc is calculated.
Step 9. F- ratios
[Figure - see the formatted PDF]
[Figure - see the formatted PDF]
,, (13)
Where, FA, FB, Fc, etc. are F-series due to parameters A, B, C, etc respectively.
Step 10. Pooling
If the calculated F-ratio (Step 9) for a parameter is less than F-ratio tabulated at a stated confidence level (95% confidence level) then the effect of the parameter is insignificant and the parameter is pooled43. If a parameter is pooled, the sum of square due to the parameter is added to the error sum of squares and the other ANOVA terms are modified. If parameter A is pooled,
SSe (pooled) = SSe + SSA (14)
fe (pooled) = fe + fA (15)
Ve (pooled) = SSe (pooled)/fe (pooled) (16)
Step 11. Pure sum of squares (SS’)
If parameter A is significant
SSA = SSA - (Ve x fA) (17)
Similarly, for other significant parameters pure sum of squares can be calculated. The subtracted amount of sum of squares must be added to the error sum of squares in order that the total sum of squares is unchanged.
SSe = SSe + (Ve x fA) (18)
Step 12. Modified percentage contributions
After pooling of the insignificant parameters, the percentage contribution of significant parameters is calculated. If parameter A is significant, the percent contribution is calculated as:
[Figure - see the formatted PDF]
(19)
Similarly,
[Figure - see the formatted PDF]
PB = (20)
[Figure - see the formatted PDF]
PC = (21)
Pe = Percentage contribution of error term
[Figure - see the formatted PDF]
(22)
PT = Total percentage contribution
= PA+ PB+PC+PD (23)
Where PA, PB, PC, PD etc. are percent contributions due to parameters A, B, C, D.
3.3.3 Prediction of the Mean
After determination of the optimum condition, the mean of the response (µ) at the optimum condition is predicted. This mean is estimated only from significant parameters. The ANOVA identifies the significant parameters.
3.3.4 Determination of Confidence Interval
The confidence interval is a maximum and minimum value between which the true average should fall at some stated percentage of confidence. The following two types of confidence intervals are suggested by Taguchi43 :
a) Confidence interval for the population (CIpop)-Around the estimated average of a treatment condition predicted from the experiment.
b) Confidence interval of sample group (CICE)-Around the estimated average of a treatment condition used in a confirmation experiment to verify predictions.
3.4 Confirmation Experiment
The confirmation experiment is the final step in verifying the conclusions drawn from previous round of experimentation. The optimum conditions are set for the significant parameters (the insignificant parameters are set at economic levels), and a selected number of tests are conducted under constant specified conditions. The average of the results of the confirmation experiments is compared with the anticipated average, based on the parameters and level tested.
RESULTS AND DISCUSSION
4.1 Physico – Chemical Characterization of Adsorbents
The physico-chemical properties viz. moisture content, ash content, volatile matter, fixed carbon and specific volume of CBS and PP have been analysed. Physical characteristics of adsorbents are presented in Table 3. It is observed that the amount of ash is very high in case of CBS as compared to PP. The amount of carbon content is also highest in case of CBS. Due to low carbon content, PP might have low porosity and there by low surface area than CBS.
Table 3: Physical Characteristics of Adsorbents
| Adsorbents | Moisture content (%) | Ash content (%) | Volatile matter (%) | Fixed Carbon (%) | Size (mm) | surface area (m2/g) |
|---|---|---|---|---|---|---|
| CBS | 2.88 | 55.07 | 33.01 | 9.04 | 0.836 | 2 |
| PP | 8.40 | 10 | 76.6 | 5 | 2-3 | - |
The morphologies of blank and fluoride loaded adsorbents were examined by scanning electron microscopy (SEM) analysis. These figures reveal the surface texture and porosity of the blank and loaded adsorbents. Fig. 1 (a) and Fig.1 (b) show the SEM of blank and fluoride loaded CBS at 100X magnification respectively. Well developed hexagonal pores are visible before adsorption while slightly hazy pores are visible after adsorption. Fig. 2 (a) and Fig. 2 (b) show the SEM of blank and fluoride loaded PP at 100X magnification respectively. From the figure it can be seen that very small pores with fibrous structure are visible in case of blank PP while in case of loaded PP such pores are not clear. It can be concluded from these figures that the surface texture of the blank adsorbents changes after adsorption of fluoride. From the SEM analysis only the morphological changes in structure can be observed.
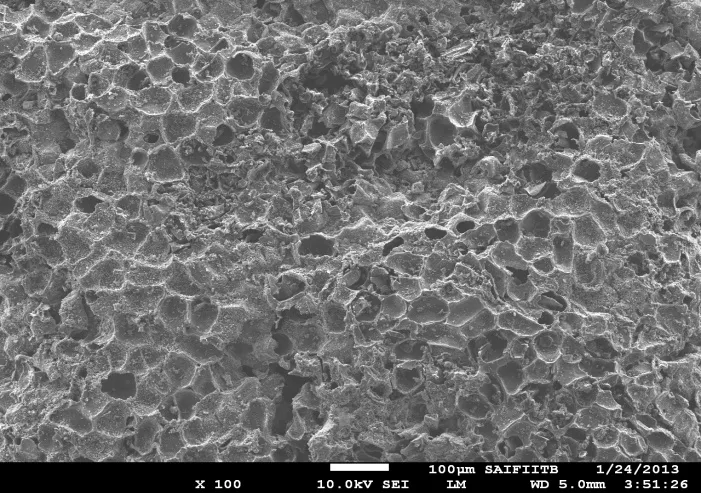
Figure 1: (A) SEM of Blank CBS at 100X Magnification
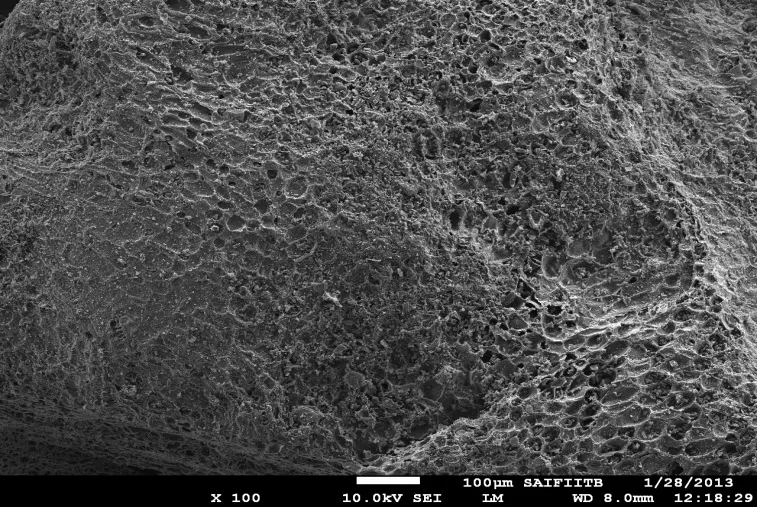
Figure 1: (B) SEM of Fluoride Loaded CBS at 100X Magnification
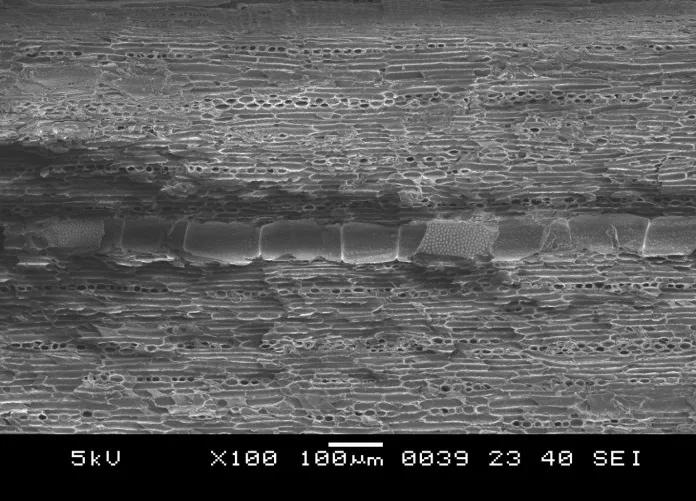
Figure 2: (A) SEM of Blank PP at 100X Magnification
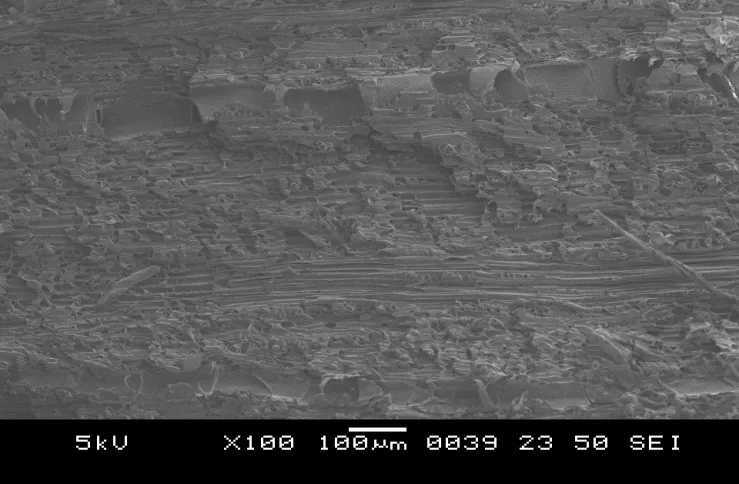
Figure 2: (B) SEM of Fluoride Loaded PP at 100X Magnification
FTIR spectra is a useful tool to identify functional groups in a molecule, as each specific chemical bond often has a unique energy absorption band, and can obtain structural and bond information. The FTIR spectra of CBS and PP were used to determine the vibrational frequency changes in the functional groups in the adsorbent. The spectra of adsorbent were measured within the range of 500-4000 cm-1 wave number. Spectra were plotted using same scale on the transmittance axis for all the adsorbent before and after adsorption. The FTIR spectra of the adsorbents display a number of adsorption peaks, indicating the complex nature of the studied adsorbents.
Structurally agricultural material consists of lignin, cellulose, hemi-cellulose and some protein which make them effective biosorbents. SB contained 35% cellulose, 25% hemi- cellulose and 22% lignin 46 Fig. 3 shows the FTIR spectra of blank and loaded CBS. From figure small bending frequency around 763, 823, 877 which shifted to slightly higher frequencies can be seen. Peaks around 2368 corresponds to amino group, that exists as (-NH+2 and NH+) which shows slight shift to 2350. A peak around 2860 is due to –CH stretching47 which also shows shift in frequency to 2866. Band around 2918 is due to stretching vibration of C-H group. Peaks around 1590 are identification of COO, C=O group 36.
[Figure - see the formatted PDF]
Figure 3: FTIR of Blank and Fluoride Loaded CBS
Fig.4 shows the FTIR of blank and fluoride loaded PP. From Figure it can be seen that small peaks are present at 609.5, 769.6, and 891.1. Peaks at 1047.3 confirmed the presence of C-O bond and lignin structure can be confirmed by this peak48, peaks around 1251.8 is due to -CH2 deformation. Peaks around 1726 corresponds to the C=C bond. Peaks around 2364.7 (which shifts to 2360.87) can be due to N-H stretching vibrations or to C=O stretching vibration, probably due to ketones, thus suggesting the possibility of oxygen or nitrogen that might be involved in adsorption. Peaks around 2893.2 (which shift to 2887) assigned to the C-H bonds of aliphatic acids49. Band at 3400 cm-1 is typical from cellulose which shifts to 3414; very small peak at 3240 is related to hemi-cellulose. Small peaks between 1508 and 1749 are due to the carboxylic group, present in lignin and hemi-cellulose50 . The adsorption peak around 3408.2 indicates the existence of free and interemolecular bonded hydroxyl groups.
[Figure - see the formatted PDF]
Figure 4: FTIR of Blank and Fluoride Loaded PP
“Point of zero charge” for a given adsorbent surface is the pH at which that surface has a net neutral charge. The significance of this kind of plot is that a given adsorbent surface will have positive charge at solution pH less than the pHpzc and thus be a surface on which anions may adsorb. On the other hand, that adsorbent surface will have negative charge at solution pH greater than the pHpzc and thus be a surface on which cation may adsorb51,33 Fig . 5 shows the pHpzc of CBS and PP. pHpzc for CBS and PP are found to be 6.3 and 6.6 with 0.1M KNO3 respectively. Similar results were noticed at 0.01 M concentration of KNO3.
[Figure - see the formatted PDF]
Figure 5: Point of Zero Charge pHpzc of CBS and PP
In pH range 5.5-6, the specific adsorption is due to the electrostatic interaction between the positively charged surface (pH <pHpzc) and fluoride ion for CBS
The probable mechanism can be:
[Figure - see the formatted PDF]
(24)
[Figure - see the formatted PDF]
(25)
[Figure - see the formatted PDF]
(26)
Where –NH2 represents the surface amine group.
The probable mechanism in case of PP for pH range 5.4-6 and at pH <pHpzc can be:
[Figure - see the formatted PDF]
(27)
[Figure - see the formatted PDF]
(28)
[Figure - see the formatted PDF]
(29)
[Figure - see the formatted PDF]
(30)
Where –COH represents the surface hydroxyl group.
4.2 Batch Adsorption Study using Taguchi’s Design of Experimental Methodology
Taguchi method is used to achieve two main objectives through the design of the experiments.
1. To determine the optimum process parameters values conditions for CBS and PP for the removal of fluoride.
2. To estimate the percentage contribution of each process parameter in batch adsorption system.
Various parameters and their levels which affect the removal of fluoride from aqueous solution onto CBS and PP are presented in Table 4.
Table 4: Significant Optimization Parameters and Their Levels for Adsorption of Fluoride onto CBS and PP
| Factors Parameters | CBS | PP | ||||||
|---|---|---|---|---|---|---|---|---|
| Level 1 | Level 2 | Level 3 | Level 1 | Level 2 | Level3 | |||
| A | Dose, m (g/100ml) | 0.2 | 0.4 | 0.6 | 0.1 | 0.2 | 0.3 | |
| B | Initial concentration of fluoride, Co (mg/L) | 4 | 6 | 8 | 2 | 4 | 6 | |
| C | Temperature, T (K) | 293 | 303 | 313 | 293 | 303 | 313 | |
| D | Contact time, t (min.) | 30 | 60 | 90 | 30 | 60 | 90 | |
Factors and ranges were selected based on the earlier batch experiments for both CBS and PP. Based on the experiments, four process parameter those having significant influence on the fluoride adsorption viz. Dose (m), initial concentration of fluoride (Co), temperature (T), contact time (t) were selected for the present study. Experiments were conducted for fluoride ion adsorption onto CBS and PP according to test conditions specified by L9 OA (Table 5 - Table 6). Each experiment was repeated three times for each trial condition. The average or mean values of qtot and S/N ratio for each parameter at levels 1, 2, and 3 are calculated for each of CBS and PP as shown in Table 7 - Table 8 respectively. It is observed that fluoride adsorption is strongly dependent on the parametric conditions.
Table 5: Taguchi L9 (34) Orthogonal Array with Experimental Qtot Values and S/N Ratio Data for Adsorption of Fluoride by CBS
| Run No. | Factors | qtot (mg/g) | S/N Ratio | |||||
|---|---|---|---|---|---|---|---|---|
| Dose | C0 | Temp | Time | R1 | R2 | R3 | ||
| A | B | C | D | |||||
| 1 | 2 | 3 | 1 | 2 | 0.20 | 0.24 | 0.28 | -11.75 |
| 2 | 2 | 2 | 3 | 1 | 0.51 | 0.35 | 0.08 | -17.14 |
| 3 | 3 | 1 | 3 | 2 | 0.40 | 0.42 | 0.39 | -7.92 |
| 4 | 1 | 2 | 2 | 2 | 0.72 | 0.68 | 0.78 | -2.86 |
| 5 | 3 | 2 | 1 | 3 | 0.02 | 0.02 | 0.02 | -34.66 |
| 6 | 3 | 3 | 2 | 1 | 0.05 | 0.15 | 0.13 | -22.74 |
| 7 | 1 | 3 | 3 | 3 | 0.72 | 0.46 | 0.83 | -4.32 |
| 8 | 2 | 1 | 2 | 3 | 0.53 | 0.55 | 0.56 | -5.28 |
| 9 | 1 | 1 | 1 | 1 | 1.06 | 1.06 | 1.05 | 0.46 |
Table 6: Taguchi L9 (34) Orthogonal Array with EXPERIMENTAl qtot Values and S/N Ratio Data for Adsorption of Fluoride by PP
| Run No. | Factors | qtot (mg/g) | S/N Ratio | |||||
|---|---|---|---|---|---|---|---|---|
| Dose | C0 | Temp | Time | R1 | R2 | R3 | ||
| A | B | C | D | |||||
| 1 | 2 | 3 | 1 | 2 | 0.05 | 0.02 | 0.10 | -30.38 |
| 2 | 2 | 2 | 3 | 1 | 1.13 | 1.06 | 0.11 | -14.21 |
| 3 | 3 | 1 | 3 | 2 | 0.16 | 0.14 | 0.14 | -16.57 |
| 4 | 1 | 2 | 2 | 2 | 2.09 | 2.06 | 2.08 | 6.35 |
| 5 | 3 | 2 | 1 | 3 | 0.70 | 0.73 | 0.71 | -2.95 |
| 6 | 3 | 3 | 2 | 1 | 0.02 | 0.00 | 0.11 | -44.07 |
| 7 | 1 | 3 | 3 | 3 | 1.16 | 0.60 | 0.87 | -2.09 |
| 8 | 2 | 1 | 2 | 3 | 0.17 | 0.21 | 0.22 | -14.14 |
| 9 | 1 | 1 | 1 | 1 | 0.38 | 0.37 | 0.34 | -8.80 |
4.3 Effect of Process Parameters
Various parameters (C0, T, m and t) significantly affect the qtot values. In case of CBS it can be seen from Table 7 that parameter A (m), parameter B (Co) and parameter D (t) have highest influence at level 1 while parameter C (T) has the highest influence at level 3. The difference between level 2 and level 1 (L2- L1) of each factor indicates the relative influence of the effect. The larger is the difference between two levels the stronger will be the effect. Table 7 shows that parameter C (T) has stronger influence on qtot than that of the other parameters. In case of PP it can be seen from Table 10 that parameter A (m) has highest influence at level 1 while parameter B (Co), parameter C (T) and parameter D (t) have the highest influence at level 2. Table 8 shows that Co (parameter B) has stronger influence on qtot than that of the other parameters. Tables 9 and Table 10 show the ANOVA of fluoride ion adsorption on CBS and PP respectively.
Table 7: Average and Effects of qtot Values for CBS: Raw and S/N Data
| Parameter | Raw data, average value | Main Effects (Raw data) | S/N Data, Average value | Main effects | ||||||
|---|---|---|---|---|---|---|---|---|---|---|
| L1 | L2 | L3 | L2-L1 | L3-L2 | L1 | L2 | L3 | L2-L1 | L3-L2 | |
| A | 0.82 | 0.37 | 0.18 | -0.44 | -0.20 | -2.39 | -11.39 | -21.78 | -9.00 | -10.38 |
| B | 0.67 | 0.35 | 0.35 | -0.31 | -0.01 | -4.24 | -18.22 | -12.94 | 13.98 | 5.29 |
| C | 0.44 | 0.46 | 0.47 | 0.02 | 0.01 | -15.32 | -10.29 | -9.79 | 5.02 | 0.50 |
| D | 0.49 | 0.46 | 0.41 | -0.03 | -0.05 | -13.14 | -7.51 | -14.75 | 5.63 | -7.24 |
Table 8: Average and Effects of qtot Values for PP: Raw and S/N Data
| Parameter | Raw data, average value | Main Effects (Raw data) | S/N Data, Average value | Main effects | ||||||
|---|---|---|---|---|---|---|---|---|---|---|
| L1 | L2 | L3 | L2-L1 | L3-L2 | L1 | L2 | L3 | L2-L1 | L3-L2 | |
| A | 1.11 | 0.34 | 0.30 | -0.76 | -0.04 | 1.42 | -19.58 | -21.19 | -20.99 | -1.62 |
| B | 0.24 | 1.19 | 0.33 | 0.95 | -0.86 | -13.17 | -3.60 | -25.51 | 9.57 | -21.91 |
| C | 0.38 | 0.77 | 0.60 | 0.40 | -0.19 | -14.04 | -17.29 | -10.96 | -3.25 | 6.33 |
| D | 0.39 | 0.76 | 0.60 | 0.37 | -0.16 | -22.36 | -13.53 | -6.40 | 8.83 | 7.14 |
Table 9: ANOVA of Fluoride Ion Adsorption on CBS
| Factors | Total variance of each factor | DOF | Variance | Variance ratio | Pure sum of square | Percent Contribution |
|---|---|---|---|---|---|---|
| A | 1.93 | 2.00 | 0.97 | 97.30 | 1.91 | 70.25 |
| B | 0.61 | 2.00 | 0.30 | 30.60 | 0.59 | 22.09 |
| C | 0.00 | 2.00 | 0.00 | 0.08 | -0.02 | 0.06 |
| D | 0.03 | 2.00 | 0.02 | 1.53 | 0.01 | 1.10 |
| Error | 0.18 | 18.00 | 0.01 | 1.00 | 0.10 | 6.50 |
| Totals | 2.75 | 26.00 | 1.29 | 100.00 |
Table 10: ANOVA of Fluoride Ion Adsorption on PP
| Factors | Total variance of each factor | DOF | Variance | Variance ratio | Pure sum of square | Percent Contribution |
|---|---|---|---|---|---|---|
| A | 3.69 | 2.00 | 1.85 | 40.82 | 3.60 | 34.29 |
| B | 4.93 | 2.00 | 2.47 | 54.56 | 4.84 | 45.83 |
| C | 0.71 | 2.00 | 0.36 | 7.86 | 0.62 | 6.61 |
| D | 0.61 | 2.00 | 0.31 | 6.79 | 0.52 | 5.70 |
| Error | 0.81 | 18.00 | 0.05 | 1.00 | 0.45 | 7.56 |
| Totals | 10.77 | 26.00 | 5.02 | 100.00 |
Fig 6. Shows the response curve for the fluoride adsorption parameters by CBS on the average values of qtot . In case of m (parameter A) i.e. the adsorbent dose, an increase in m from level 1 to level 3 led to decrease in the value of qtot, showed that the adsorption capacity of adsorbent decreases with increase in m. An increase in initial concentration Co from level 1 to 2 increases the amount of qtot and increase in level 2 to 3 shows more or less same qtot values. An increase value of parameter C (temperature, T) from level 1 to 2 shows increase in qtot and increase in level 2 to 3 also shows an increase in the qtot value. An increase in the level of contact time (t) (parameter D) from 1 to 2, results in an increase in the qtot value. However, the q tot value remains the same with subsequent increase from level 2 to level 3.
[Figure - see the formatted PDF]
Figure 6: Effect of Process Parameters on qtot for Adsorption
OF FLUORIDE ON CBS
The Fig. 7 Shows the response curve for the fluoride adsorption parameters by PP on the average values of qtot. In case of m (parameter A) i.e. the adsorbent dose, an increase in m from level 1 to level 3 led to decrease in the value of qtot, showed that the adsorption capacity of adsorbent decreases with increase in m , this may be due to increase in adsorbate to adsorbent ratio with increase in m. An increase in initial concentration Co from level 1 to 2 increases the amount of qtot and increase in level 2 to 3 shows decrease in qtot values. Initially the qtot increased with increase in Co as the resistance to uptake of fluoride from the solution decreases with the increase in fluoride concentration 52 . The qtot should increase with increasing initial concentration due to the increasing driving force but after level two in the present study it decreases which may be due to the combined effect of the other parameters viz. adsorbent dose, temperature and time of agitation. An increase values of parameter C (temperature, T) from level 1 to 2 shows increase in qtot and increase in level 2 to 3 shows more or less same value because sorption is an exothermic process, it would be expected that an increase in T would result in decrease in the qtot value. However, if the diffusion process controls the adsorption process, the qtot value will increase with increase in temperature, because of the endothermicity of the diffusion process. An increase in T results in increased mobility of the fluoride ions and a decrease in the retarding forces acting on the diffusing ions. These results in the enhancement in the sorptive capacity of the adsorbents. However, the diffusion of the fluoride ions into the pores of the adsorbent is not only rate- controlling step and the diffusion resistance can be ignored with adequate contact time 32.33,53,54 . Therefore, the increase in sorptive uptake of fluoride with increase in temperature may be attributed to chemisorption. An increase in the level of contact time (t) (parameter D) from 1 to 2, results in an increase in the qtot value. However, the qtot value decreases with subsequent increase from level 2 to level 3. Also, the adsorption of fluoride ions increases as t increases until equilibrium is attained between the solute molecules in the liquid and the solid phases. During initial stage of adsorption, all adsorbent sites are vacant and the solute concentration gradient was high. Afterwards, the fluoride uptake rate by the adsorbent decreases significantly, due to decrease in adsorption sites55.
[Figure - see the formatted PDF]
Figure 7: Effect of Process Parameters on Qtot for Adsorption
OF FLUORIDE ON PP
By studying the main effects of each of the factors, the general trends of the influence of the factors on the adsorptive removal of fluoride process can be characterized. The characteristics can be controlled such that lower or higher values in a particular influencing factor produce the preferred result. Thus, the levels of factors necessary to produce the best results can be predicted. The percentage contribution of each parameter, for qtot as the desired response characteristic for CBS is shown in Fig. 8. It shows that parameter A (m) is the most significant factor with 70.25% contribution followed by parameter B (C0) with contribution of 22.09% for the removal of fluoride. The percentage contribution of each parameter, for qtot as the desired response characteristic for PP is shown in Fig. 9. It shows that parameter B (C0) is the most significant factor with 45.83% contribution followed by parameter A (m) with contribution of 34.29% for the removal of fluoride
[Figure - see the formatted PDF]
Figure 8: The Percentage Contribution of Each Parameter, for qtot (CBS) (a: Dose of CBS; B: Initial Concentration; C: Temperature; D: Contact Time)
[Figure - see the formatted PDF]
Figure 9: The Percentage Contribution of Each Parameter, for qtot (PP) a:Dose of PP; B: Initial Concentration; C: Temperature; D: Contact Time)
4.4 Selection of Optimal Levels and Estimation of Optimum Response Characteristics
Because qtot is a higher is better (HB) type quality characteristic, the greater qtot value is considered optimal. Table 13 summarizes the optimal level of various parameters obtained after examining the response curve (Fig. 8- Fig. 9). Table 13 indicates that in case CBS the first level of parameter A (m), B (C0), D (t) and third level of Parameter C have higher values of qtot and S/N ratio while in case of PP the first level of parameter A (m) the second level of parameter B (C0), C (T) and D (t) have higher values of qtot and S/N ratio.
4.5 Confirmation Experiments.
The confirmation experiments have been conducted for the adsorption of fluoride onto CBS and PP at selected optimal levels of the process parameters. The average values of the characteristic are obtained and compared with the predicted values. The results are given in Table 13. The values of qtot obtained through the confirmation experiments are within 95% of CICE. These optimal values are valid within the specified range of process parameters.
CONCLUSIONS:
Notations
qtot = Equilibrium adsorption uptake (mg/g)
Co = Initial fluoride concentration (mg/l)
Ce = Equilibrium fluoride ion concentration (mg/l)
m = Adsorbent dose (g/l)
V = Volume in litre
L (y) = Loss function
K = Proportionality constant
mT = Target value
y = Experimental value obtained in each trial
R = Sample size
µ = Mean of the response
[Figure - see the formatted PDF]
= Overall mean of the response
[Figure - see the formatted PDF]
= Average values of response at the second level of parameter A
[Figure - see the formatted PDF]
= Average values of response at the second level of parameter B
CIPOP = Confidence interval for the population
CICE = Confidence interval of sample group
Ve = Error of variance
N = Total number of results
T = Grand total of results
fe = Degree of freedom of error.
REFERENCES

Kalpana Singh, Dilip H. Lataye, Kailas L. Wasewar, Optimization of Fluoride Adsorption from Aqueous Solution by Bael Fruit Shell and Pongamia Pinnata Using Taguchi Method, Int. J. Sci. R. Tech., 2026, 3 (10), 955-974. https://doi.org/10.5281/zenodo.23411863
 10.5281/zenodo.23411863