

We use cookies to ensure our website works properly and to personalise your experience. Cookies policy
DY Patil Institute of MCA and Management, Akurdi, Pune
This study presents a proof-of-concept method for identifying materials other than grain (MOG) during soybean harvest. Images of grain samples were taken using front-lighting and back-lighting techniques, and various image processing techniques were used to identify different dockage fractions, namely split, contaminated, and defective beans and stems/pods. The image background was segmented using the HSI color space model, followed by the identification of the dockage fractions using median filtering, morphological operations, watershed transformation, and component labeling based on projective area and circularity. Split, contaminated, and defective beans and stems/pods were accurately identified by the algorithms with 96%, 75%, 98%, and 98% accuracy, respectively.
Soybean (Glycine max) is one of the world’s most essential leguminous crops. It is harvested using grain heads, which bring the pods from the plants to threshing, separating, and cleaning machines. Combine harvesters have been used in soybean harvesting since the 1920s; however, the quality of the grain has not significantly changed until 1970 [1].
The percentage of material other than grain that mixes with the grain in the combine tank, or MOG, is an essential quality factor because the harvested products are classified based on various physical properties [2]. MOG also affects the performance of processing equipment, makes the oil extraction process less efficient, and deteriorates the final products [3]; therefore, soybeans with a noticeable amount of MOG must be cleaned.
The level of MOG in the combined output depends greatly on how well the combined is adjusted. Inappropriate adjustments or inability to make appropriate changes will allow foreign objects to enter the hopper, affecting the quality of the output. The speed of rotation of the threshing cylinder is the key factor in the case of mechanical damage; excessive rotation causes cracked beans or beans divided into parts (split beans), whereas inadequate rotation causes beans to remain on the pod. The size of the sieve holes, its oscillations, and the speed of the fan have influence on the MOG level.
The operator typically uses the recommended settings for his machine; however, due to the lack of visual information about the grain in the hopper, this results in grain damage and increases grain loss [4], [5]. Real-time information about grain condition would make it possible to set up machine settings to minimize MOG and grain damage [6]–[8]. Sensing, positioning, communication, and computing technologies have enabled precision agriculture, in which each step of the production process is monitored for better quality, record keeping, and management purposes. The present proposal is based on recent advances in sensing and digital image processing, which have already been implemented to achieve quality control in the food and agricultural industry [9]-[12]. For example, an improved computer vision system accurately identified mold infestation in soybeans with 80% precision [13]. Moreover, a laboratory-scale grain cleaner controlled by a machine vision system was designed, constructed, and tested [14], while a multispectral vision sensor for the online determination of the weight percentage of MOG in a sample to adjust the combine settings was proposed [8]. In more recent research, a machine vision system achieved classification of the following soybeans: frogeye with 96%, mildewed with 95%, worm-infested with 92% and damaged with 92% accuracy.
This research aims to formulate a machine vision-based proof of concept for a grain quality monitoring system that will be used in a combine harvester.
MATERIALS AND METHODS :-
The machine vision subsystem within the proposed monitoring approach includes a digital camera with back, front, and structured lighting.
Soybeans, including MOGs in the form of cracked seeds, defective seeds, leaves, and pods, were placed in a container. The popular Fukuyutaka variety, harvested in December 2011 in Mie Prefecture, Japan, was chosen. Soybean samples were selected directly from the combine harvester tank, with a moisture content of approximately 11%, wrapped in plastic bags, and stored in a cool box at approximately 12 °C. The 500 g samples were randomly selected from this lot. The most frequent anomalies included split
beans, stems/leaves, soil-contaminated beans, Phomopsis longicolla-contaminated beans (fungus causes small cracks where the mold develops), heat-damaged beans, and purple-stained beans, affected by the Cercospora fungus. The following classes were considered in this study:
A. Image Acquisition :
To satisfy the limitations of the proposed system, a compact, robust, and affordable camera was selected: a 2MP portable webcam (C905m, UXGA class, Logicool Co., Ltd., Japan). In addition to a good camera, proper illumination is necessary for achieving good image quality [11], [16].
Lighting in machine vision systems can be in the form of front, back, or structured illumination. Front illumination highlights surface details, whereas back illumination provides contrast details [17]. In this work, cracks on the beans and stem/pods were identified based on morphological details; thus, back illumination was required, whereas contamination was detected through surface details, thus requiring front illumination.
To avoid halation, bright or purplish spots in the images of the target objects, a ring light with a polarization (PL) filter (CCS Co., Ltd., Tokyo, Japan) was used as the front light. The ring structure of the light source permitted the placement of the web camera within the ring, such that the entire setup remained small. For the backlight, a square-shaped flat dome light (CCS Co., Ltd.) was chosen because its patterned surface provided strongly diffused light and no shadows in the images.
The acquisition cell consisted of a web camera mounted in the ring LED and equipped with a polarization filter, which was used to observe a glass object plate with one smooth and one rough surface, with the background being a flat white LED unit. The soybean samples were placed on the smooth surface of the plate, and the rough surface was exposed to backlighting. The flat dome LED functioned as a diffusing panel. The distance between the ring LED and the object plate was maintained at 47 mm, and the field of view was 50 mm × 50 mm. This acquisition system is protected by Japanese patent No. 5780642 [18].
Camera parameters were set using Logicool Webcam Software V-1.1. Following adjustment of each parameter, a white balance check was performed to avoid color distortion and shadow noise. The final camera parameters are listed in Table I. It should be noted that the white balance images demonstrated an even distribution of light over the sampling area.
Table 1: Camera Calibration Data
| Parameter | Front lighting | Back lighting |
|---|---|---|
| Shutter speed (s) | 1/500 | 1/100 |
| Gain (dB) | 10000 | 10000 |
| Brightness | 4050 | 4050 |
| Contrast | 1255 | 1255 |
| Colour intensity | 1098 | 1098 |
| Sharpness | 7490 | 7490 |
| White balance | 10000 | 10000 |
| Focus | 155 | 155 |
After the camera settings were set, images of the 10 g samples were taken with a resolution of 1600 x 1200 pixels, which corresponds to a 24 pixel/mm (1200 vertical pixels / 50 mm vertical field of view) resolution. An average sample picture includes ten normal beans, four split beans, four soil-contaminated beans, four defect objects, and one stem or pod, placed on the glass plate within the 50 mm × 50 mm sampling zone. Images with front lighting allowed for the identification of normal, soil-contaminated, and defect beans and stems/pods, whereas images with backlighting allowed for the identification of split beans. A total of 50 frontlit and 50 backlit images, comprising approximately 500 g of material, were processed. The testing dataset consisted of 620 normal soybeans, 70 split beans, 36 soil-contaminated beans, and 145 other objects (defect beans and stems/pods).
B. Pre-processing of Images :
The program was implemented using Microsoft Visual C++ 6.0, and the images in JPEG format were processed using the functions provided by the OpenCV (Open Source Computer Vision) library [19]. For the purpose of
detecting the objects, the RGB (red, green, blue) and HSI color models of both front- and back-lit images were thresholded. The HSI color model describes colors more naturally for human perception than the RGB and CMYK color models, and is therefore regarded as suitable for algorithm development [20], [21]. The transformation from RGB to HSI is described in [21]:
H = cos ¹ {0.5 [(R−G)+(R−B)] / [(R−G)² + (R−B)(G−B)]^½} (1) S = 1 − 3·min (R,G,B) / (R+G+B) (2)
I = (R+G+B) / 3 (3)
By plotting the histogram of all target objects and background HSI, threshold T can be selected for image segmentation, whereby pixels with values greater than or equal to T are considered as object pixels (white) and those below T as the background (black). Following segmentation, smoothing, opening, closing, de-bridging, size, and shape discrimination were conducted. In the case of smoothing, median blur followed by morphological opening and closing eliminated isolated noise pixels in the segmented image. Finally, the watershed algorithm was applied to separate overlapping or touching objects in the segmented image, called de-bridging. The projected area of each object was determined by counting the pixels within the object boundaries of the binary image using a FloodFill algorithm [19], and the perimeter was generated using a mask image [22]. The circularity of each object was determined based on its area and perimeter using (4) [23]:
Circularity = √(4π·Area) / Perimeter (4)
RESULTS AND DISCUSSION :-
To provide clarity, the results are presented in two sections. Images with frontal illumination were utilized to identify normal beans, beans with contamination, beans with defects, and stem or pods, whereas images with back illumination were utilized to detect split beans. It was necessary to use images with back illumination to identify split beans because the external features of split beans resemble those of normal beans; hence, they cannot be identified in a frontal illuminated image. The projected areas of normal beans, contamination spots, and split beans were determined in pixels for
further processing. Normal soybeans covered an area of 25,000 to 35,000 pixels, whereas contamination spots on the soil covered an area of less than 500 pixels.
A. Front-lit Image Segmentation :
The histogram comparison between the HSI of normal, defect beans, stems/pods, and background is illustrated in Table II, where the limits and mean values of the extracted HSI features for each object are presented. As seen from the saturation-hue and intensity-hue histograms, there are distinctive differences between the objects and the background; therefore, the histograms can be used for thresholding. The threshold limits were determined from the minimum and maximum values of the HSI for various sampling points for the separation of normal soybeans from the rest of the objects. The minimum and maximum limits of H, S, and I were 0–354, 0 –15, and 126 –211, respectively.
Table 2: HSI Colour Features of Front- Lighted and Back-Lighted Images (min–MAX / Mean)
| Object | H | S | I |
|---|---|---|---|
| Front: normal beans | 0-354 / 36 | 0-15 / 6 | 126-211 / 176 |
| Front: defect beans | 0-359 / 79 | 0-100 / 71 | 0-127 / 43 |
| Front: stem/pods | 0-359 / 40 | 1-100 / 31 | 7-130 / 68 |
| Front: background | 193-257 / 223 | 19-100 / 45 | 12-86 / 43 |
| Back: split beans | 29-64 / 44 | 29-100 / 90 | 46-183 / 97 |
| Back: all other objects | 0-358 / 38 | 1-100 / 83 | 1-238 / 28 |
1)Identification of beans affected by contamination: Beans affected by contamination are normal beans with one or more regions contaminated. To identify normal beans, the front-lit images were initially converted to binary form using the chosen thresholds (Table II). After applying the thresholding operation, the segmented image had many noisy regions with a color almost similar to that of the soybeans. Therefore, to remove the noisy regions, median-blur smoothing and one morphological opening were performed.
This was followed by filtering of regions less than a given size and circularity. The image consisting of normal and split beans was then
inverted and filtered using the same area and circularity filters. The identification of contaminated spots was accurate up to 75%.
2. Detection of defect beans and stem/pods: As seen in Table II, all target objects have unique differences from the background in terms of HSI properties. To separate normal beans, defect beans, and stem/pods, binary conversion was performed using thresholds for H (193-257), S (19-100), and I (12-86), and then the image was inverted. The watershed approach was employed to detect the boundary of each object, and the inverted image was subtracted from the boundary image to obtain the de-bridged image. At this point, all target objects were separated and could be analyzed separately.
For the detection of defect beans and stem/pods, the de-bridged image was subtracted from the normal/cracked bean image, and size and shape filtering was performed to eliminate the remaining noise pixels. Defect beans and stem/pods were successfully detected using the algorithm with an accuracy of 98%.
B. Backlighting Image Processing and Segmentation
The backlighting technique provided a strong contrast in terms of surface color between normal and split beans, thus distinguishing the split beans. The intensity-hue and saturation-hue values of the backlit sample that contained split, normal, and defective beans, along with the stems/pods, were analyzed. Given that the I-values for the split beans were different from those of all other objects, thresholding was performed on the intensity part of the HSI.
Pixels from the outside of the normal beans and from stems or pods coincided with the split-bean pixels in the binary image. To eliminate those noisy regions, the image was smoothed out, then subjected to morphological opening and closing operations (erosion followed by dilation and vice versa). Noise regions still remained because their sizes were sufficiently large to accommodate the structuring element; hence, a logical AND was introduced. First, the back-lit color image was separated into its red-green-blue components, and the blue component was converted into a binary image with a threshold value of 50 to find all the objects of interest (with intensities above 50) and eliminate the background. Then, the watershed algorithm found boundaries of those objects, and the binary image was subtracted from the boundary image to separate touching objects. Size discrimination eliminated anything but the beans. Ultimately, an AND operation between the smoothed and filtered split-bean image and the isolated-bean image resulted in keeping only the split beans. There were some noise areas from the edges of regular soybeans left, but they were discarded because their projected area was smaller than 10,000 pixels, and their shape was different from the shape of split beans (circularity less than
0.1). The accuracy of detecting the split beans using the algorithm was 97%.
3. Identification Results :-
Both the front-lit and back-lit algorithms were tested with all representative samples, and the results are presented in Table III. In the output image produced after applying both the algorithms, normal beans, contaminated beans, split beans, and other objects such as defect beans and stems or pods are denoted in green, pink, blue, and red colors, respectively. The algorithms based on the HSI color model successfully identified the objects.
Table 3: Detection Results for the Objects in the Harvested Grain
| Target objects | Real | Detected | Accuracy (%) |
|---|---|---|---|
| Normal beans | 620 | 620 | 100 |
| Split beans | 70 | 67 | 96 |
| Contaminated beans | 36 | 26 | 75 |
| Other objects | 145 | 143 | 98 |
The split beans were found with an accuracy of 96%. However, the algorithm failed to detect three beans that were excessively overthreshed. This was due to the similarities in the areas of the projections of such defective beans and the stem/pods; hence, the filtering process eliminated them. Contaminated beans were detected with an average accuracy of 75%. In case the region of contamination was situated in the peripheral regions of the bean, detection became impossible owing to the similarity in color with that of the background. The detection of defective beans and stem/pods had an accuracy of 98%.
D. Limitations and Future Work
The final goal of this project is the development of an effective and durable machine vision system for combine harvester operators that provides them with information on the quality of grains in real time. This current study represents the first stage where the technical possibility of grain quality control through lighting from the front and rear sides and image processing
was investigated. It was obvious before that the efficiency of the system would depend on the inverse proportionality to the density of the grain flow, so the system should be provided with a sparsely packed, single-layered grain flow. It is due to the reasons mentioned above that the field of view was established at 50 mm × 50 mm after conducting a number of experiments involving sample weights of 10 g, 15 g, and 20 g. Of these three samples, the 10 g sample produced the least occlusion in images compared to those of 15 g and 20 g. While occlusion may significantly affect object detection, the watershed transformation successfully separated touching objects in a single layer image. The next stage is going to be about implementing the proof of concept together with the harvester. The first problem to be addressed is how to put the system above the grain tank in such a way that grain flow images are captured by the detection windows.
CONCLUSIONS :-
A proof-of-concept real-time grain quality system has been developed for use in a soybean harvester to identify typical abnormalities or dockage fractions in clean and intact soybeans in order to adjust the combine harvester's subsystems to achieve the highest quality of grain in the tank. A web camera equipped with both front and back illumination has been used to determine the detection accuracy of dockage fraction for five different classes: (1) normal (intact) beans, (2) split beans, (3) contaminated beans,
(4) defective beans, and (5) stems/pods. Fifty different sets of data have been gathered wherein a certain amount of these objects was arranged randomly within an imaging cell of 50 mm × 50 mm. The algorithm of digital image processing has identified each dockage fraction in the sample through both the front illuminated and back illuminated images, achieving 96%, 75% and 98% detection for split, contaminated and defect beans respectively.
5. SURVEY FINDINGS :-
To gather information on the present methods used for assessing soybeans’ quality and the adoption of automation in such process, a survey with 37 respondents was created. Each chart presented here is followed by its summary.
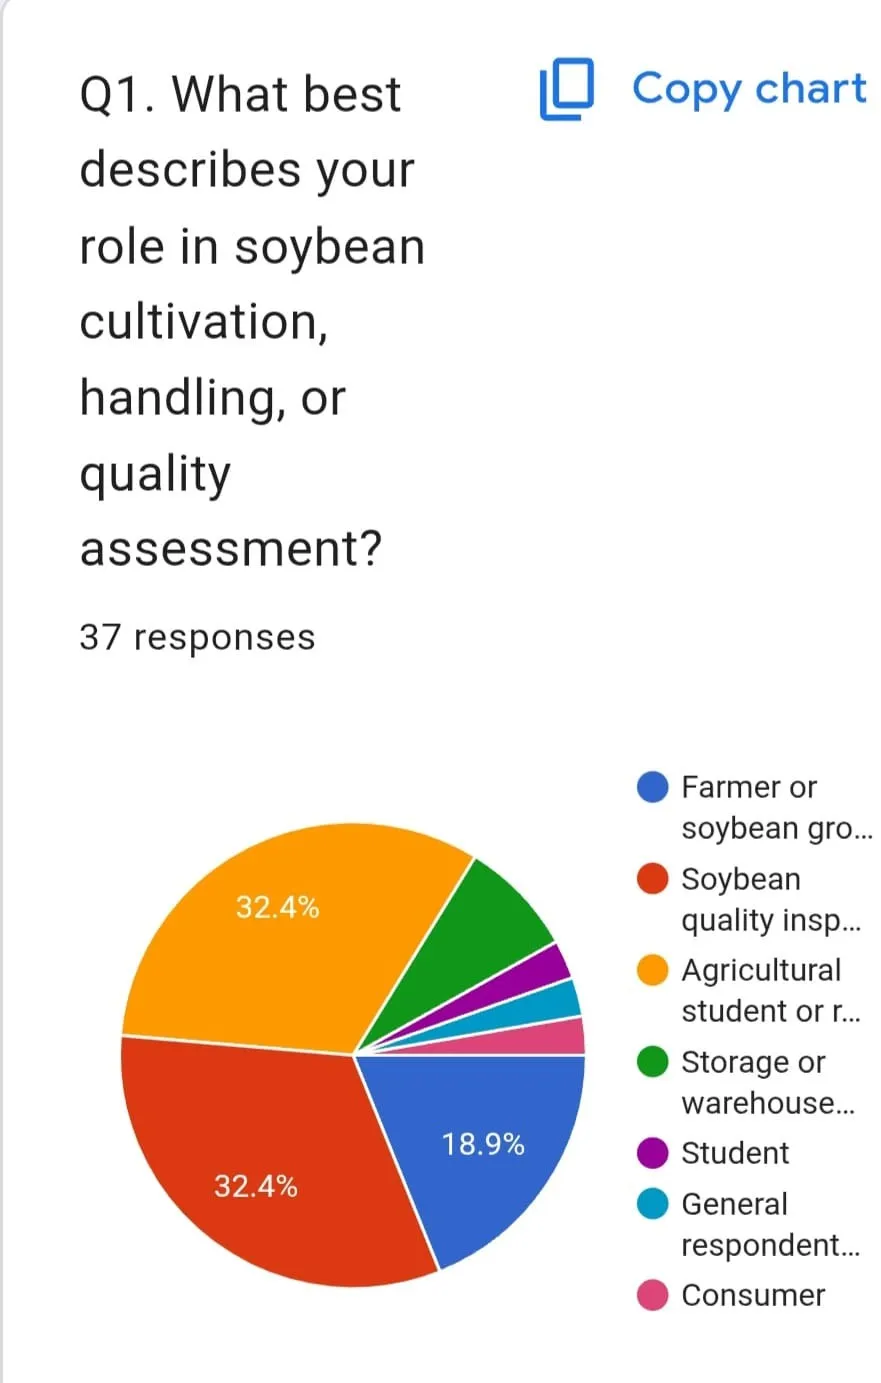
Figure 1: Q1: Role of Respondents
Q1. Respondent category. Agricultural scholars/students and inspectors of soybean quality (each comprising 32.4%) are the most dominant groups, while farmers/growers account for 18.9%. The rest consist of warehouse/staff members, students, general and consumers. In other words, the sample includes practitioners, scholars and general respondents.
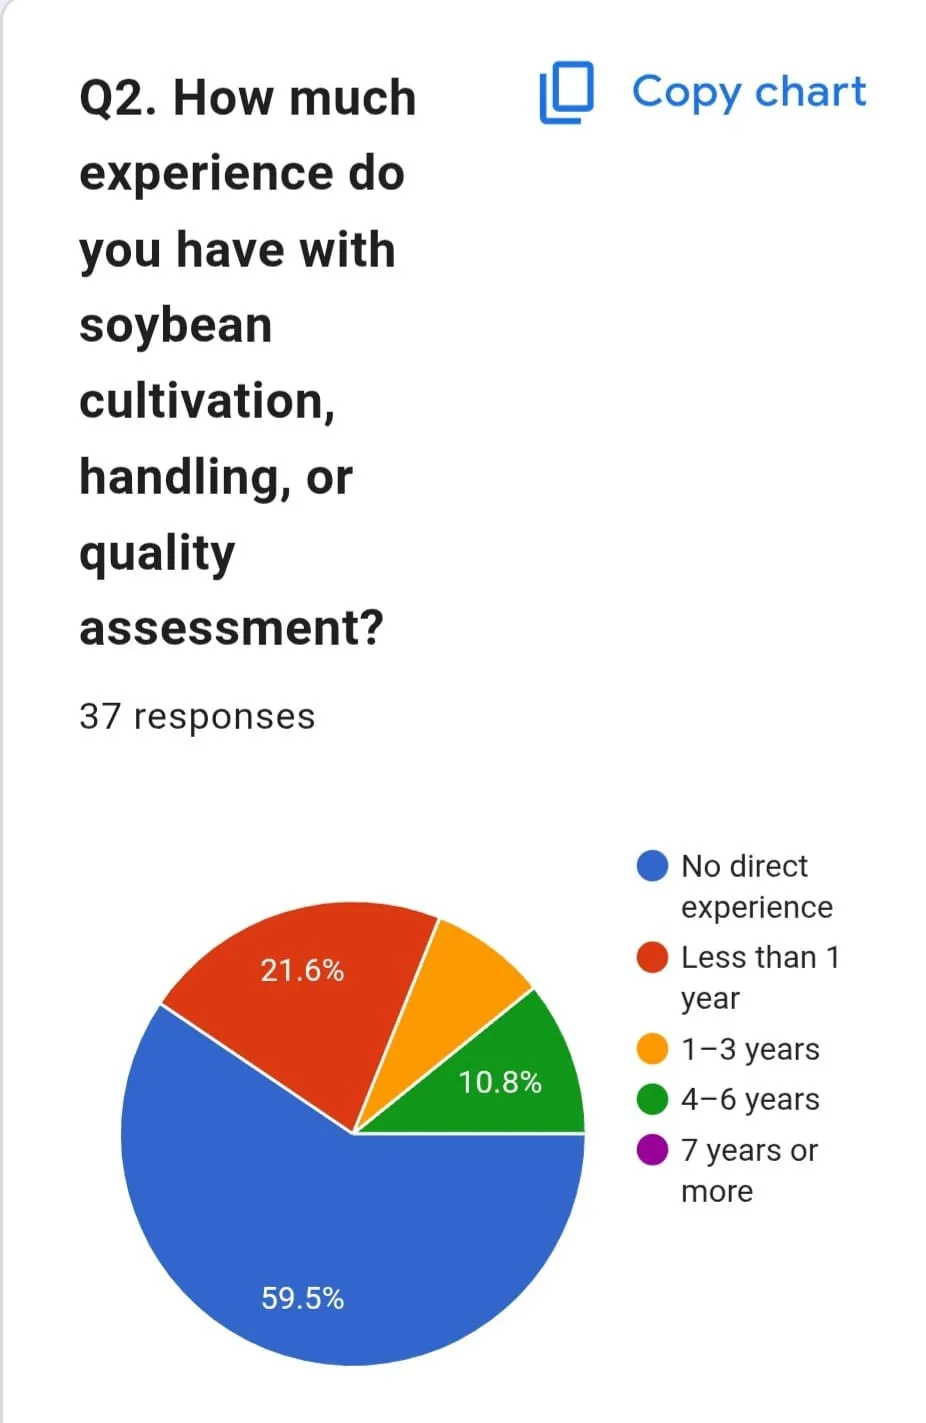
Figure 2: Q2: Experience Level.
Q2. Experience. A majority of respondents (59.5%) have no direct experience with soybean cultivation, handling or quality assessment, and 21.6% have less than one year. Only 10.8% report 4-6 years and a small share 1-3 years, while no one reports 7 years or more. The results thus mainly reflect early-stage or indirect perspectives.
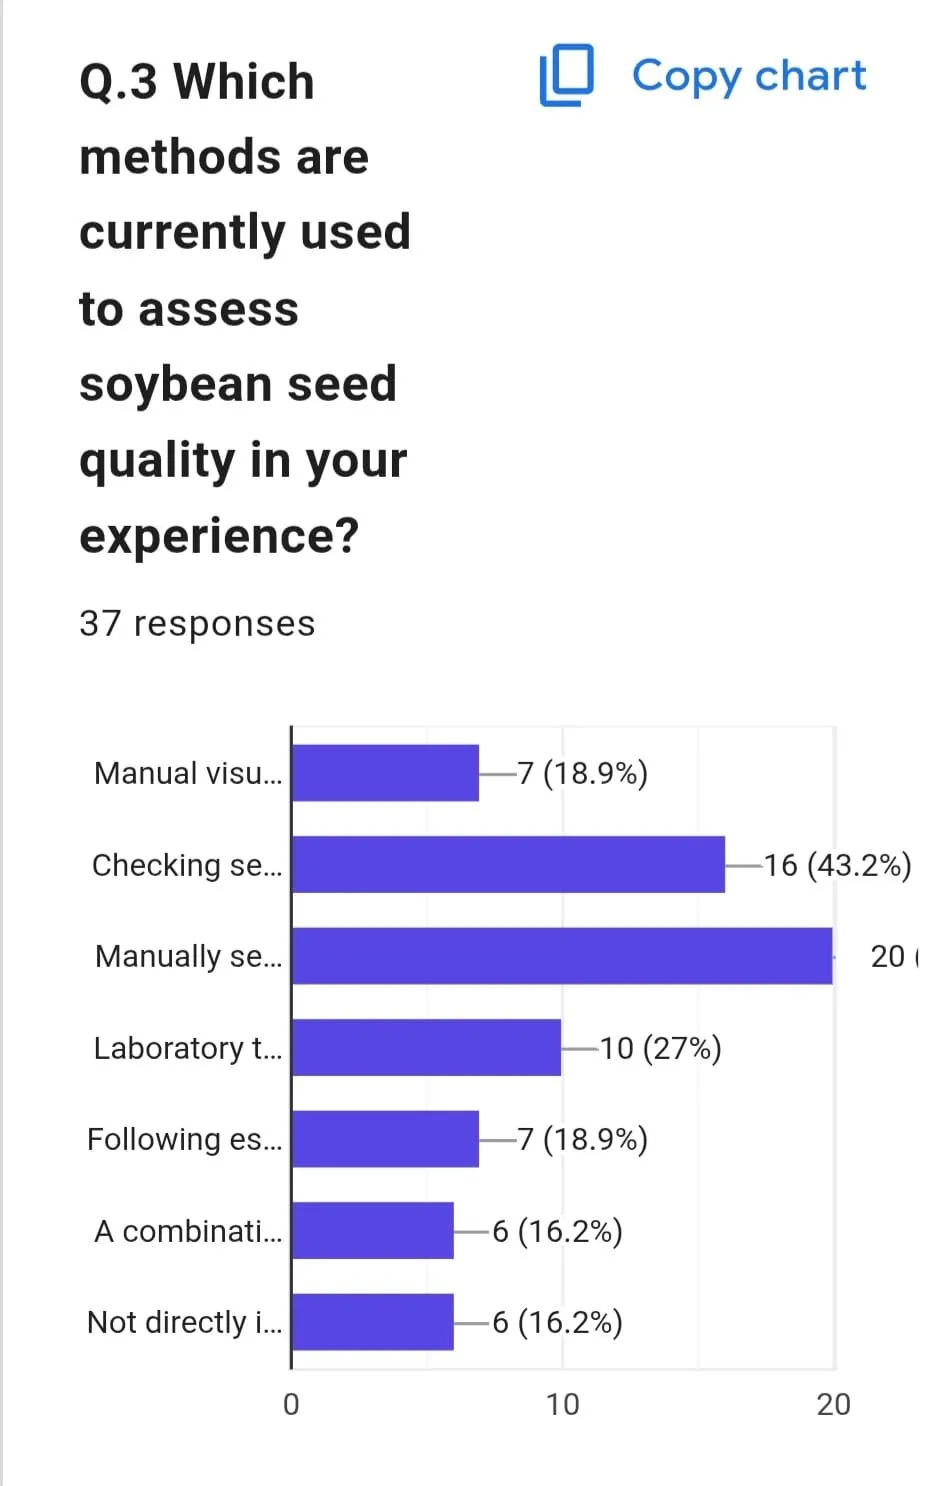
Figure 3: Q3: Current Assessment Methods.
Q3. Current methods of assessment. Manual picking has proven to be the most used technique (20 responses), while 16 respondents (43.2%) use the technique of checking the seeds for any damages or defects and 10
respondents (27%) test the seeds in the laboratory. Seven respondents each (18.9%) said that manual visual inspection or working according to the set standards were their methods of assessment.
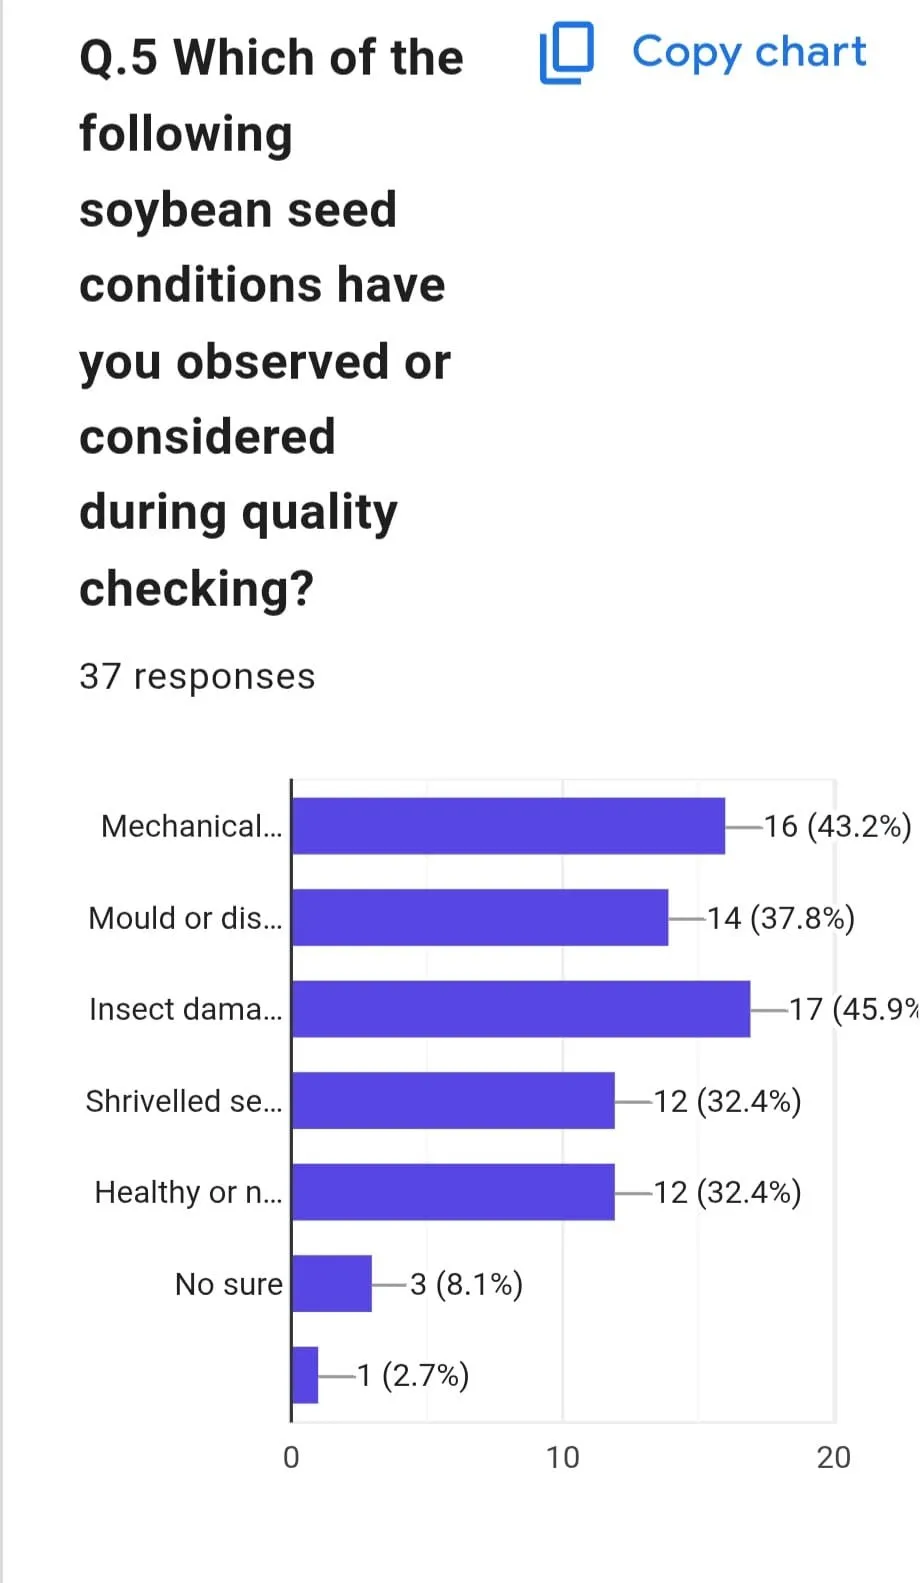
Figure 4: Q5: Seed Conditions Observed.
Q5. Seed Conditions Seen. The most commonly seen seed condition is that of insect damage (17; 45.9%), then comes mechanical damage (16; 43.2%) and mould/disease (14; 37.8%). Each of shrivelled seed and healthy/normal seed have 12 mentions (32.4%), while those who are unsure amount to just three people (8.1%).
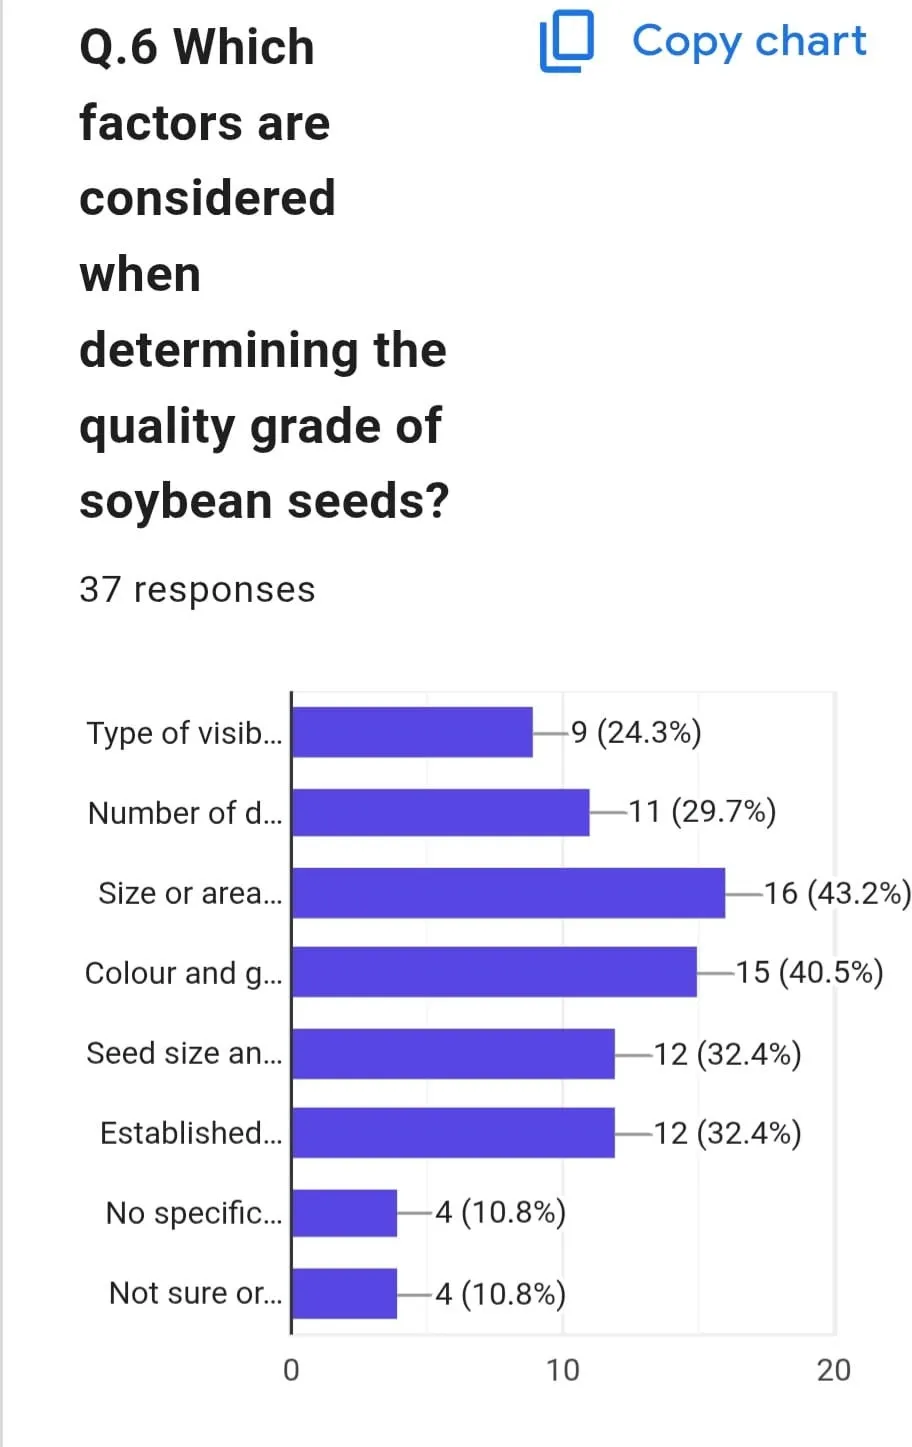
Figure 5: Q6: Factors for Quality Grade.
Q6. Factors considered in grading. Size or area of the defect is most influential (16, 43.2%), then colour and overall appearance (15, 40.5%). Seed size and standard are both mentioned by 12 people (32.4%), number of defects by 11 (29.7%) and type of the defect by 9 (24.3%). No factors and no idea are both mentioned by about 10.8%.
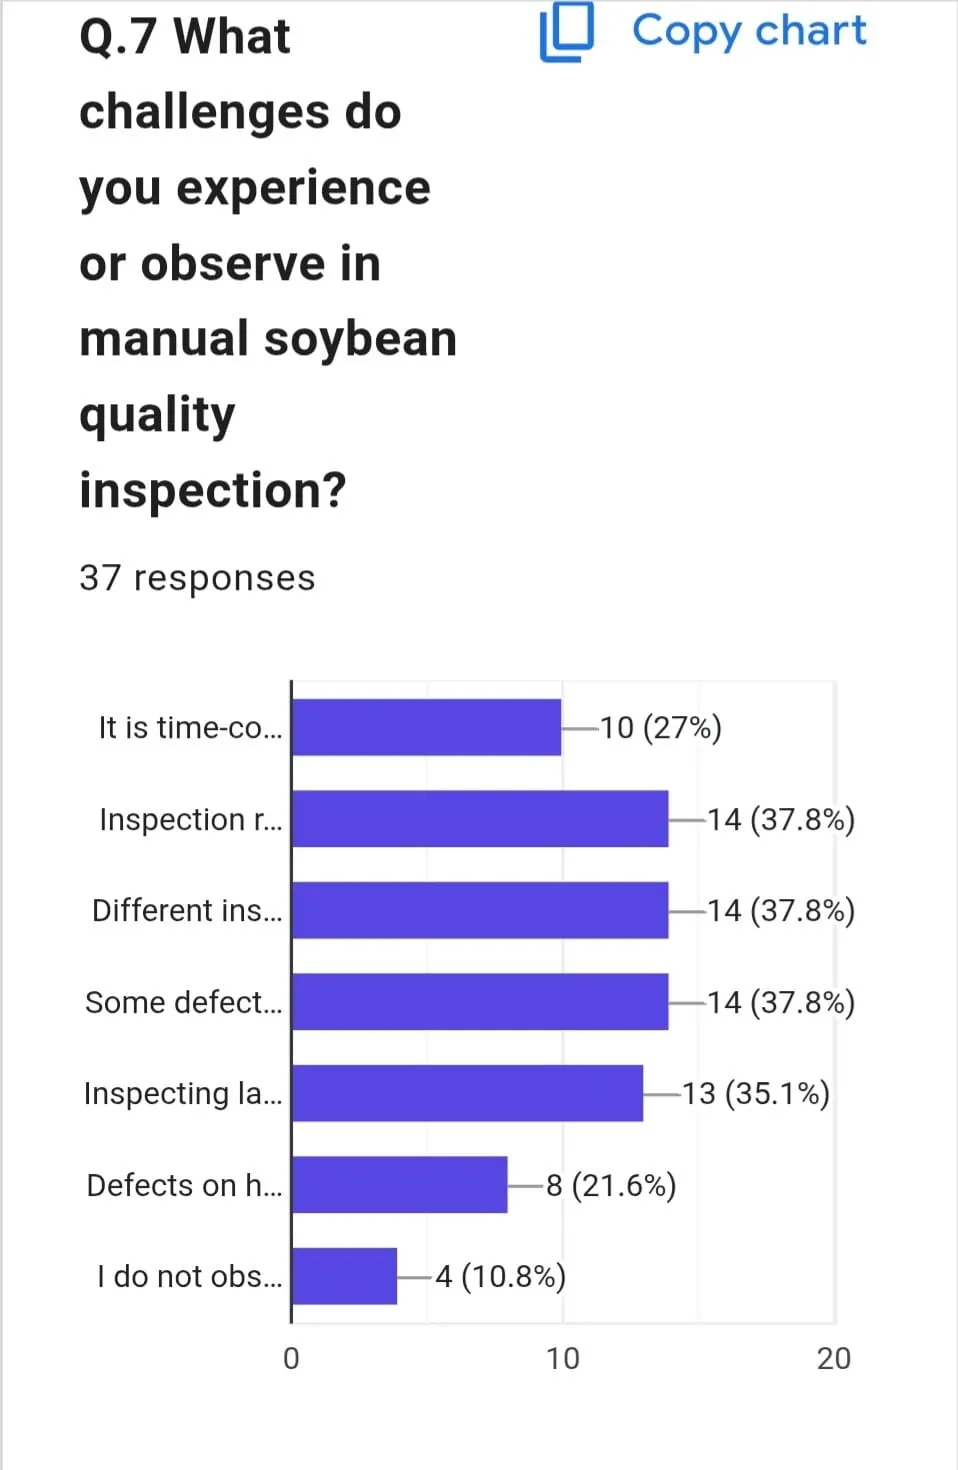
Figure 6: Q7: Challenges in Manual Inspection.
Q7. Difficulties in manual inspections. Differences between inspectors, difficult-to-detect defects, and one more difficulty got 14 votes each (37.8%); checking huge amounts of goods was ranked fourth (13 responses;
35.1%). Time-consuming process got 10 votes (27%); defects that are on unseen sides got 8 (21.6%), and no difficulties at all got 4 votes (10.8%).
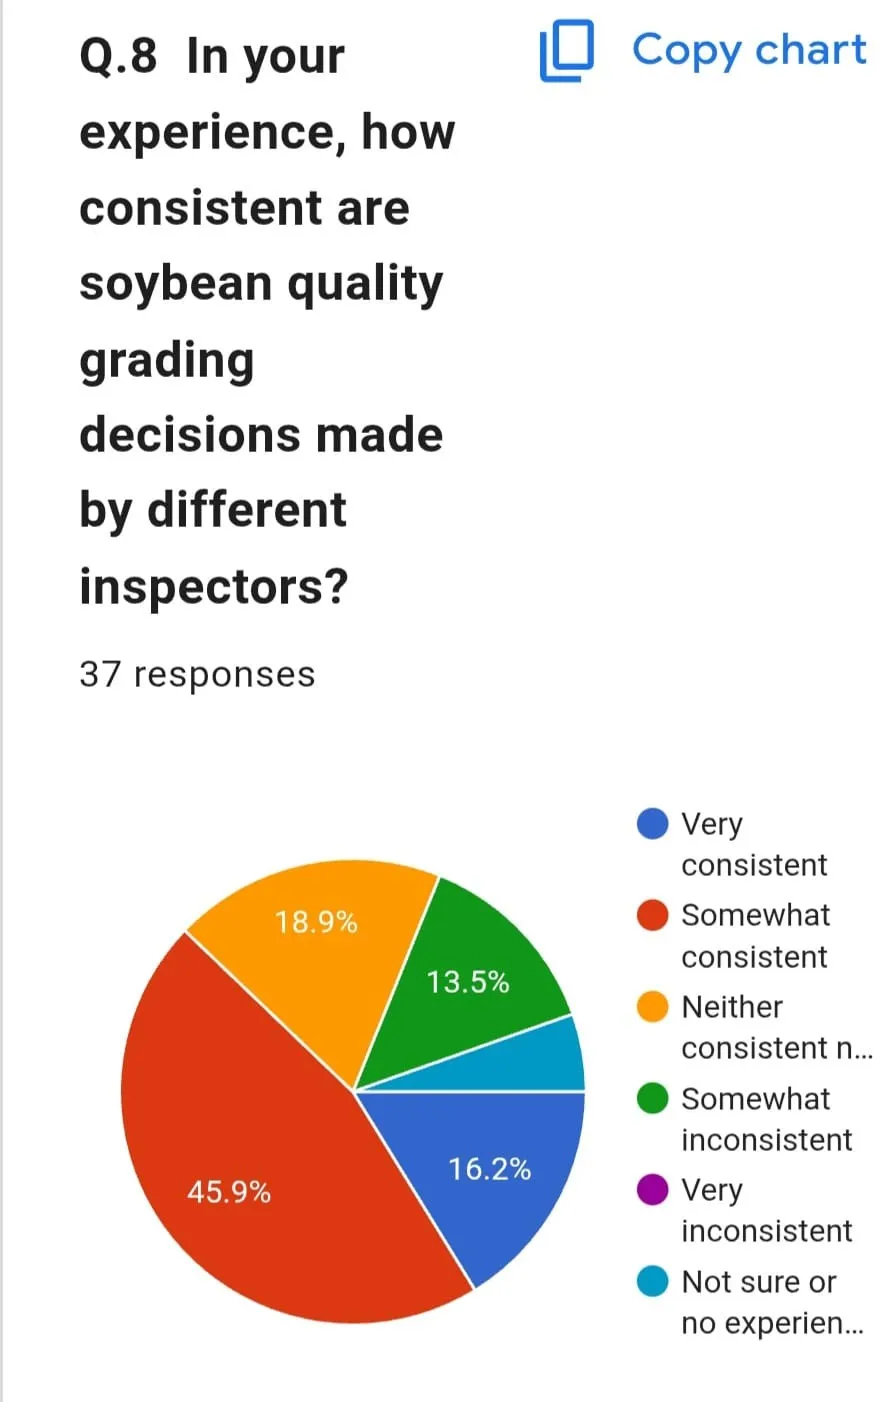
Figure 7: Q8: Grading Consistency Between Inspectors.
Q8. Consistency in grading. Grading was viewed as being consistently done by most of the respondents, who viewed it as being moderately consistent, with 45.9% responding as somewhat consistent and 16.2% as very consistent. Some 18.9% had a neutral attitude towards the consistency while 13.5% felt that it was somewhat inconsistent.
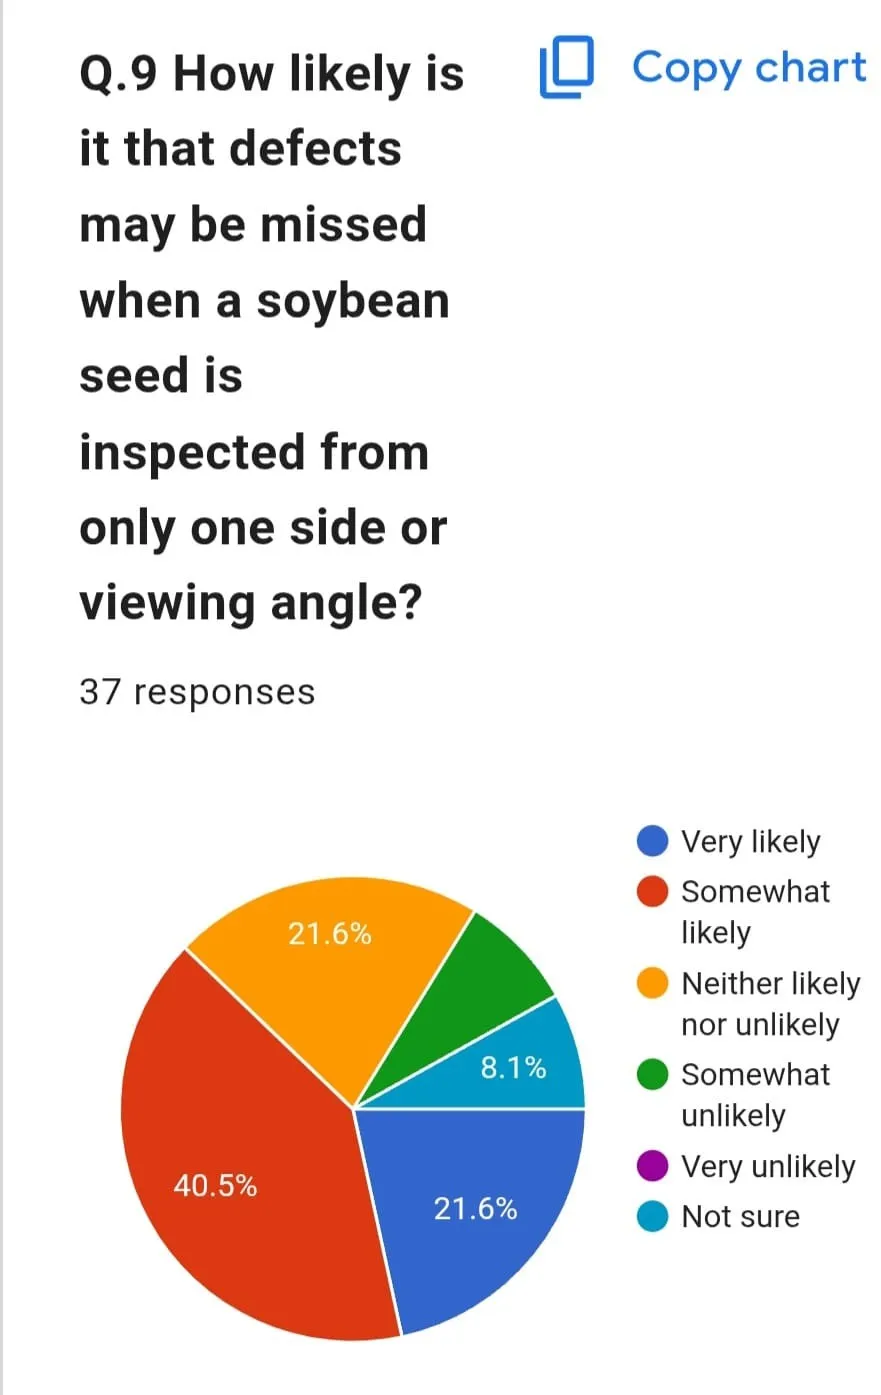
Figure 8: Q9: Risk of Missed Defects (Single View).
Question 9: Defects missed due to single view. More than 62% of the participants find missed defects quite probable if there is a check of the seed using a single view (somewhat probable – 40.5%; very probable – 21.6%). The rest 21.6% answered that they are neutral about this question.
Less than 8% said that this is somewhat improbable or not sure; none selected very improbable.
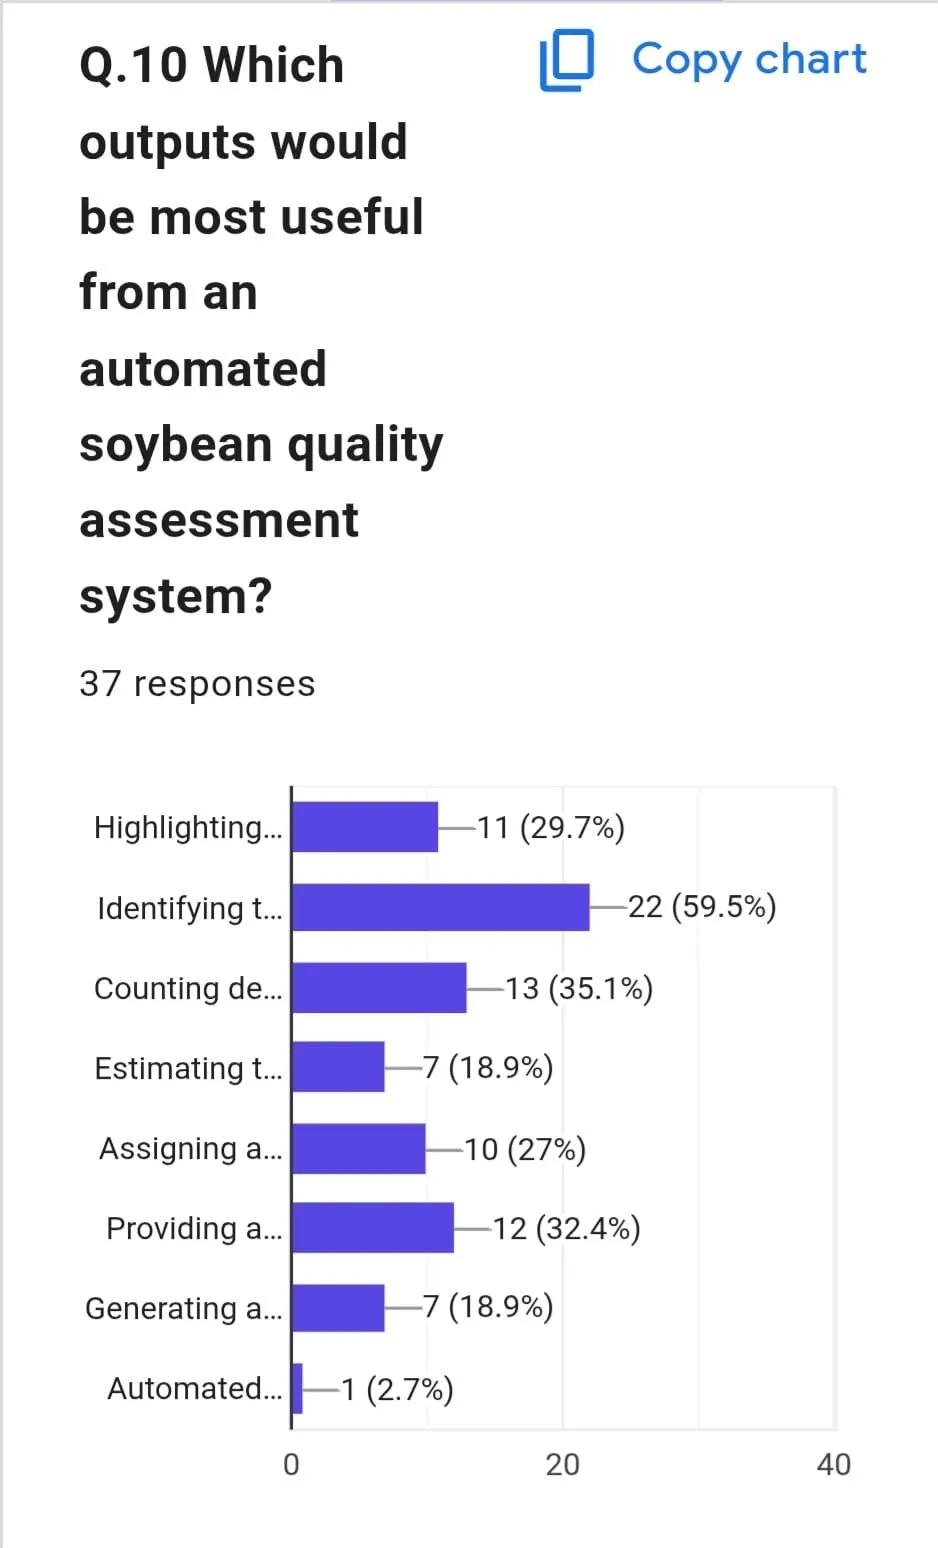
Figure 9: Q10: Most Useful System Outputs.
Question 10. Useful outputs. Defect identification is definitely a favorite (22 or 59.5%), with defect counting coming next (13 or 35.1%), while giving a rating or report comes third (12 or 32.4%) and then defect location (11 or 29.7%). Quality rating is listed by 10 people (27%), severity estimation/report generation by 7 each (18.9%), and automation alerts by 1 (2.7%).
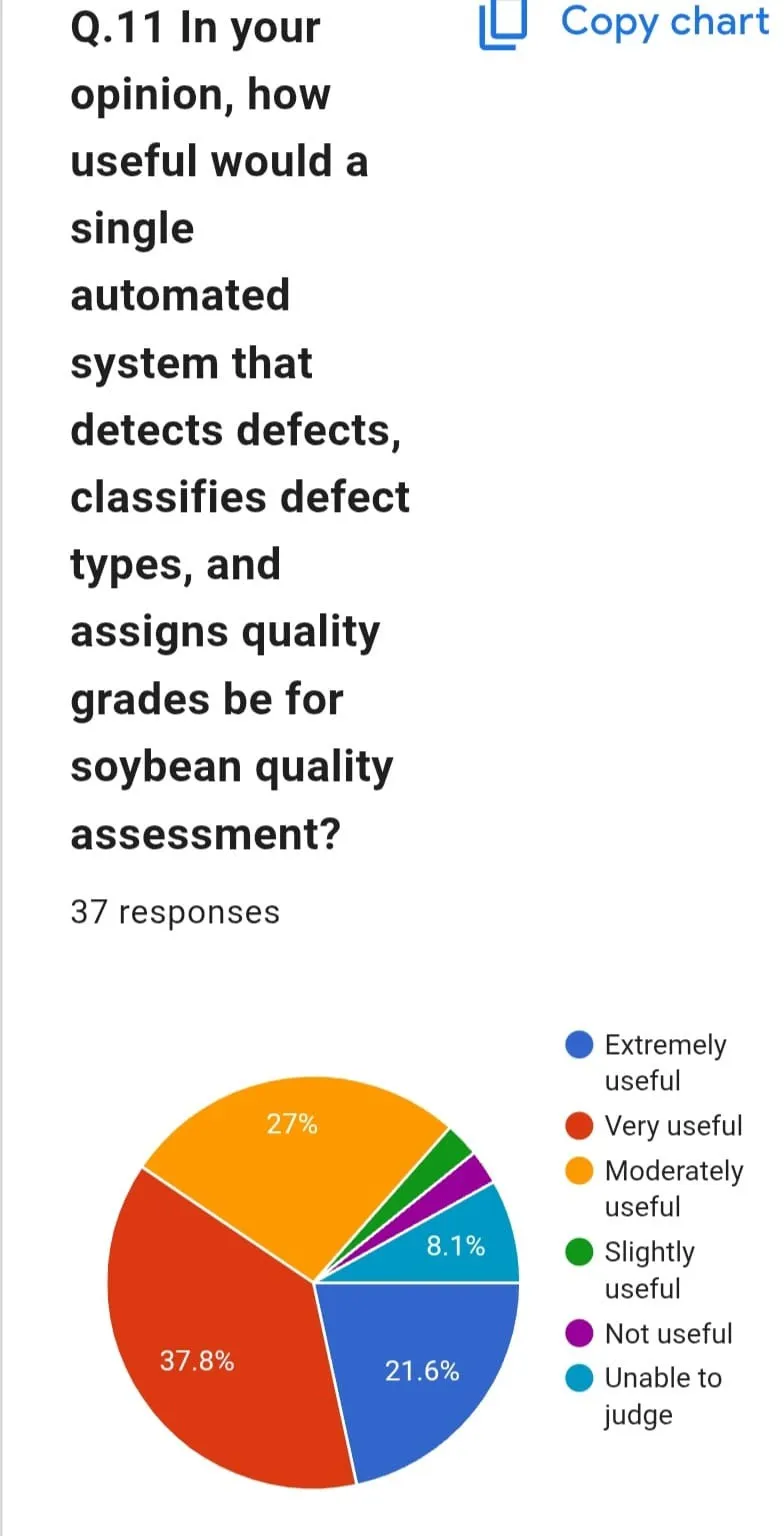
Figure 10: Q11: Usefulness of Integrated System.
Question 11. How useful would you consider an integrated detection, classification and grading of defects system? A very strong positive response was given here: 37.8% considered such a system as very useful, 21.6% as extremely useful and 27% as moderately useful, giving around 86% of respondents rating it at least as moderately useful. Only a small percentage of respondents found it slightly or not useful, while 8.1% couldn't comment.
Overall Summary
The current quality control for soybean is manual and varies from one inspector to another. From their responses, it can be noted that inspecting soybean from only one side may overlook defects and that respondents would prefer an automated process that will identify defect types, count and grade the soybeans. Since the respondents sampled are made up of mainly students, whose experience is minimal in the field, this is not conclusively proof but shows a positive outlook towards its use if feasible.
Acknowledgments
The authors would like to thank the funding and facilities for the field experimentation offered by Yanmar Co. Ltd., Okayama, Japan.
REFERENCES

Siddhi Santosh Mirajkar, Samruddhi Dhanaji Ilage, Dr. Sapna Sharma, Soybean Quality Evaluation Using Machine Vision, Int. J. Sci. R. Tech., 2026, 3 (11), 715-729. https://doi.org/10.5281/zenodo.24217266
 10.5281/zenodo.24217266