

We use cookies to ensure our website works properly and to personalise your experience. Cookies policy
1Department of Physics, Mewar University, Chittorgarh, Rajasthan, India.
2Department of Chemistry, Mewar University, Chittorgarh, Rajasthan, India.
3Department of Clinical Research Aarihant School of Pharmacy and Bioresearch Institute Swarrnim Startup and Innovation University, Ghandinagaar, Gujarat
There has been growing interest in plant-based photoprotective materials due to the negative effects of ultraviolet (UV) radiation and the problems associated with some of the synthetic ingredients of sunscreens. The absorption of Moringa oleifera leaf extract in the ultraviolet range was studied using the UV-Vis spectrophotometry technique. Absorbance and transmittance were recorded in multi-wavelength mode at seven wavelengths from 200 to 800 nm. The extract showed an absorbance of 0.4644 at 200 nm (UV-C), 0.5503 at 300 nm (UV-B), and 0.2324 at 400 nm (UV-A edge), which correspond to 65.67%, 71.84%, and 41.44% of the incident light not being transmitted. Absorbance in the visible region was 0.6394 at 500 nm and 0.8233 at 600 nm, and it fell to baseline at 700 and 800 nm. The strongest ultraviolet attenuation was therefore found in the UV-B region, and it was about 2.4 times the value at 400 nm. These results show that the extract attenuates UV radiation under the conditions tested and support a higher-resolution spectral scan, calculation of the in vitro sun protection factor, and formulation studies.
1.0 Introduction
Sun exposure causes damage to the skin, and solar UV radiation can be divided according to wavelength as UV-A (320–400 nm), UV-B (290–320 nm), and UV-C (200–290 nm) [1]. Sunscreens are widely used for protection, yet some synthetic filters have shown toxicity or instability under UV exposure and raise environmental concerns, which has encouraged the search for natural alternatives [1]. Plant extracts are one such alternative. Plant compounds that carry aromatic rings usually absorb across the 200-400 nm range, and they often possess antioxidant activity as well [2]. A recent review of herbal photoprotective agents likewise points to flavonoids, tannins, and other phenolic compounds as the constituents that absorb UV rays [12].
Moringa oleifera Lam. (family Moringaceae) is a fast-growing tropical tree whose leaves are widely consumed and used in traditional medicine. Reviews of its chemistry list flavonoids, alkaloids, and carotenoids among its constituents [3], and phenolic compounds such as caffeic and gallic acid have been isolated from different parts of the plant [4]. Broader surveys of more than 200 studies describe flavonoids, phenolic acids, and glucosinolates as its main bioactive groups [5]. The composition of a leaf extract depends on how it is prepared, and extraction technique and solvent are recognized as important variables [6].
Several recent studies have already tested Moringa oleifera leaf extract in sun-care products. Adding the extract to a body lotion raised the measured SPF in proportion to the amount added [7]. A gel combining moringa leaf extract with lime peel extract reached the "ultra" protection category in vitro [8]. A nanoemulgel containing 2, 3, and 4% extract was assessed by in vitro and in vivo assays in rats [9]. Ethanolic moringa extract was also screened for SPF in comparison with basil leaf extract [10], and a moringa cream combined with niacinamide was evaluated for SPF and physical properties [11].
These studies mostly report sun protection factor (SPF) values for finished formulations. The basic UV-Vis absorption behavior of the extract itself, recorded across the ultraviolet and visible range, is less often presented as a starting point. The same extract was first measured in a comparative study of natural dyes for solar cells [14], following an extraction protocol described in an earlier report on mango leaf [13]; the present work re-examines the moringa readings from the standpoint of UV protection. The objective of this work was to record the UV-Vis absorbance and transmittance of an M. oleifera leaf extract from 200 to 800 nm and to describe its absorption in the UV-C, UV-B, and UV-A regions.
2.0 Materials and Methods
2.1 Plant material
Leaves of the fresh Moringa oleifera were picked in the morning from a plant that was cultivated on the Mewar University campus in Chittorgarh, Rajasthan, India, after getting permission from the Agriculture Department of the university. The Agriculture Department also confirmed the identification of the plant, and none of the protected or endangered plants were used. The leaves were thoroughly washed with tap water and then with distilled water, dried in the shade at ambient temperature (25-30°C) for 5 days, ground in a laboratory blender, and kept in a sealed glass container.
2.2 Extract preparation
The cold maceration technique was used to prepare the extract in absolute ethanol with a low amount of acetic acid according to the earlier described procedure [13, 14]. 5 g of leaf powder were stirred magnetically for 1 h at room temperature in a 250 mL beaker with 80 mL of absolute ethanol containing 0.5 mL of HCl, and the mixture was then kept in the dark for 24 h. The mixture was filtered through Whatman No. 1 paper, and the filtrate was stored in an amber glass bottle in the dark at about 4°C. The extract concentration was not standardized, and its pH was not recorded. The complete procedure is summarized in Fig. 1.
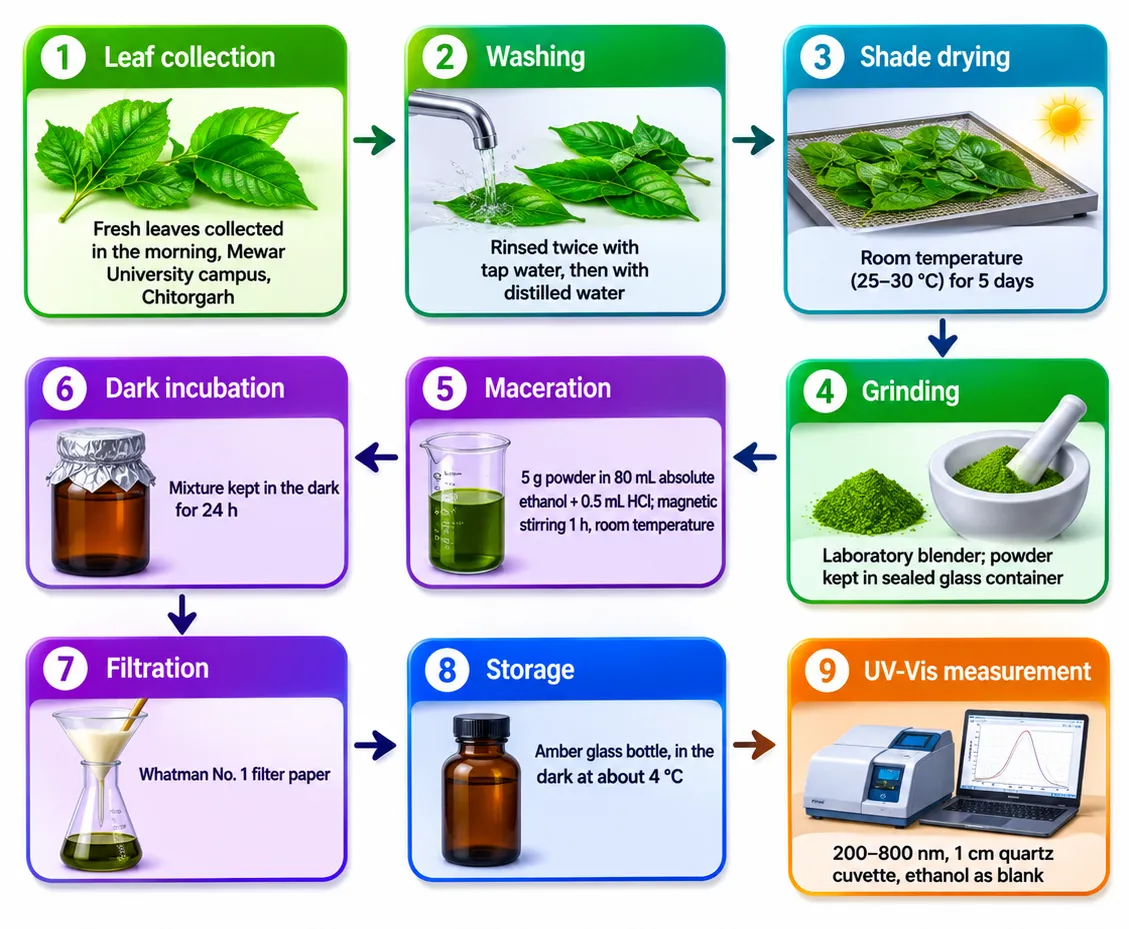
Figure 1 demonstrates the flow diagram of plant material handling, extract preparation and UV-Vis measurement of the M. oleifera leaf extract.
2.3 UV-Vis measurement
Measurements were made using a double-beam UV-Vis spectrophotometer in multi-wavelength mode, i.e., discrete readings and not a continuous scan. Absorbance (Abs) and percent transmittance (T) were recorded at 200, 300, 400, 500, 600, 700, and 800 nm in a 1 cm quartz cuvette. Ethanol was used as the blank. Each wavelength was read once.
2.4 Data treatment
Wavelengths were assigned to spectral regions as follows: UV-C, 200-290 nm; UV-B, 290-320 nm; UV-A, 320-400 nm; visible, above 400 nm [1]. The percentage of incident light not transmitted was calculated as 100 minus T. Absorbance and transmittance were checked for consistency using the relation A = -log10 (T/100).
3.0 Results and Discussion
3.1 Absorbance and transmittance at each wavelength
The recorded values were presented in Table 1 and plotted in Fig. 2 (absorbance) and Fig. 3 (transmittance). Absorbance and transmittance agreed with A = -log10 (T/100) at every wavelength within rounding. These readings are the same ones previously reported for this extract in a solar-cell dye study (see Introduction); they are interpreted here for UV protection.
Table 1: UV-Vis Absorbance and Transmittance of the Moringa oleifera Leaf Extract
| Wavelength (nm) | Spectral region | Absorbance | Transmittance (%) | Light not transmitted (%) |
|---|---|---|---|---|
| 200 | UV-C | 0.4644 | 34.33 | 65.67 |
| 300 | UV-B | 0.5503 | 28.16 | 71.84 |
| 400 | UV-A edge | 0.2324 | 58.56 | 41.44 |
| 500 | Visible | 0.6394 | 22.94 | 77.06 |
| 600 | Visible | 0.8233 | 15.02 | 84.98 |
| 700 | Visible | −0.0002 | 100.05 | 0 |
| 800 | Visible | 0.0004 | 99.91 | 0.09 |
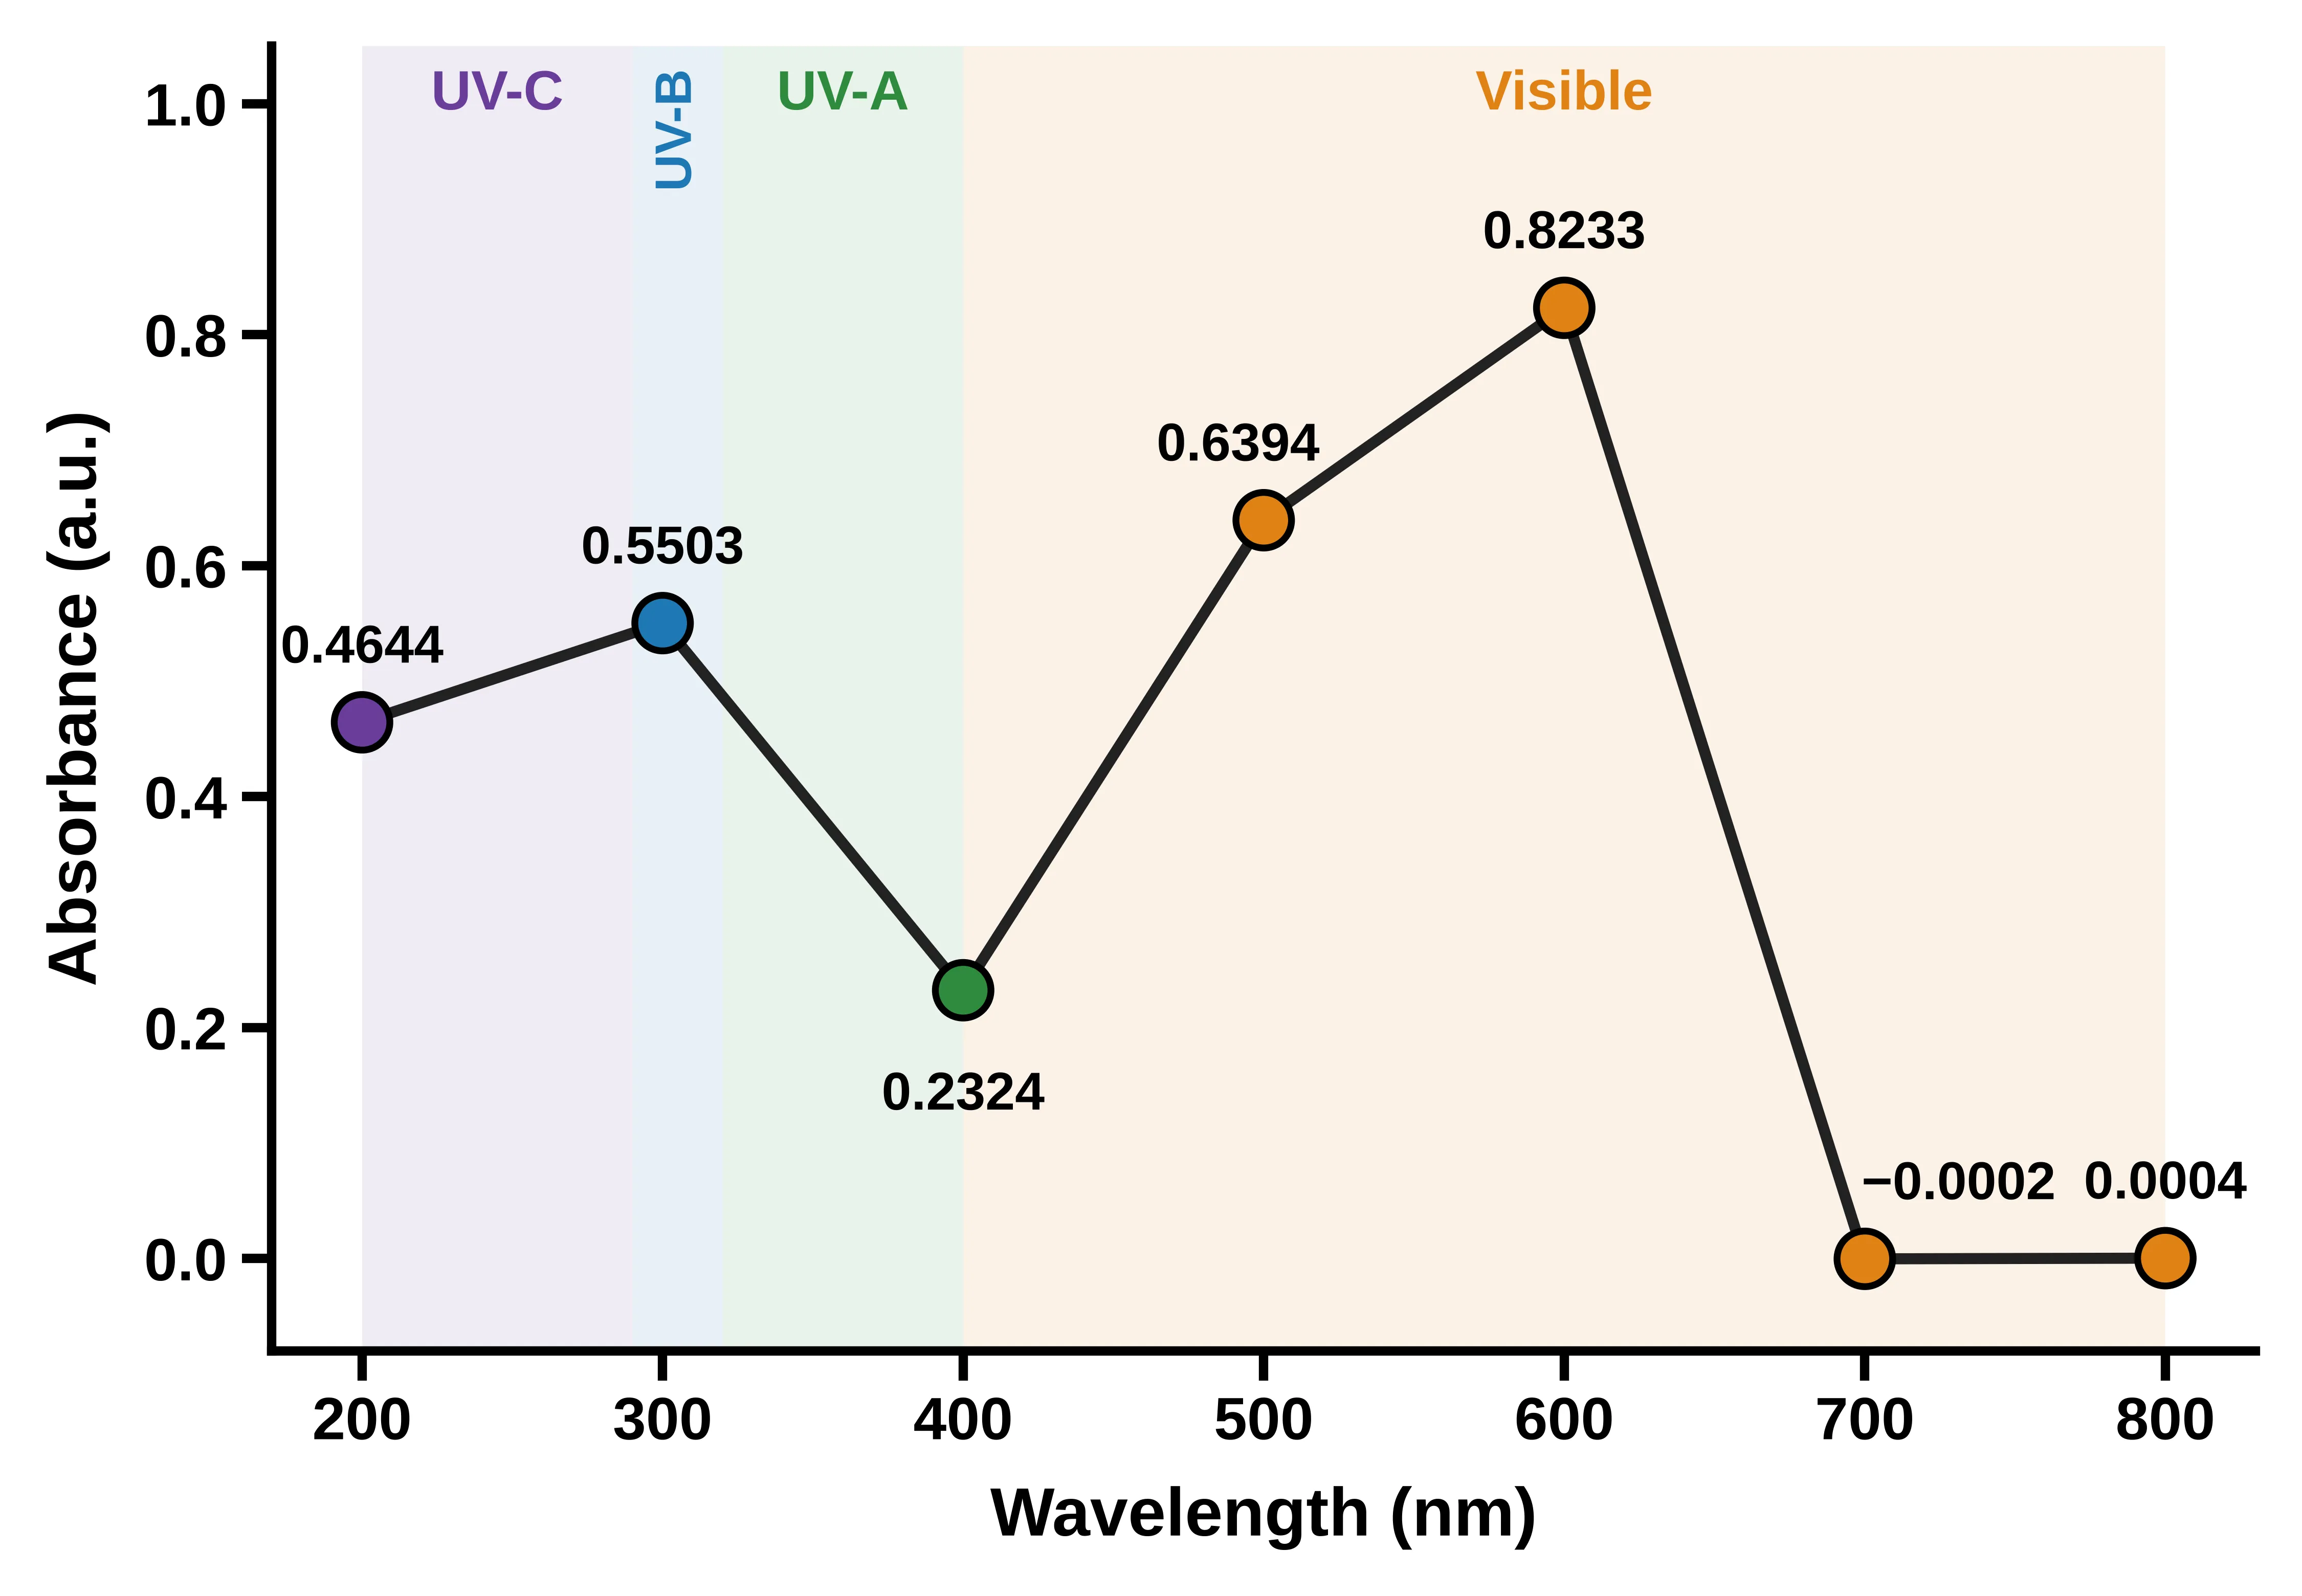
Figure 2 proves the UV-Vis absorbance of the Moringa oleifera leaf extract at the seven wavelengths recorded (200-800 nm). Shaded bands mark the UV-C, UV-B, UV-A and visible regions. The line joins discrete readings and is not a continuous scan.
Fig. 2 shows the absorbance of the extract from Moringa oleifera leaves at the seven wavelengths recorded between 200 and 800 nm. Among the three ultraviolet readings, absorbance was highest at 300 nm (0.5503), compared with 0.4644 at 200 nm and 0.2324 at 400 nm. The 300 nm value was therefore about 1.2 times the 200 nm value and about 2.4 times the 400 nm value. Absorbance rose again in the visible range, to 0.6394 at 500 nm and 0.8233 at 600 nm, the highest value in the data set. At 700 and 800 nm the readings (−0.0002 and 0.0004) were within instrument noise, so the baseline is flat beyond 700 nm. The line only connects discrete readings, so the position of any maximum between the sampled wavelengths cannot be read from the graph.
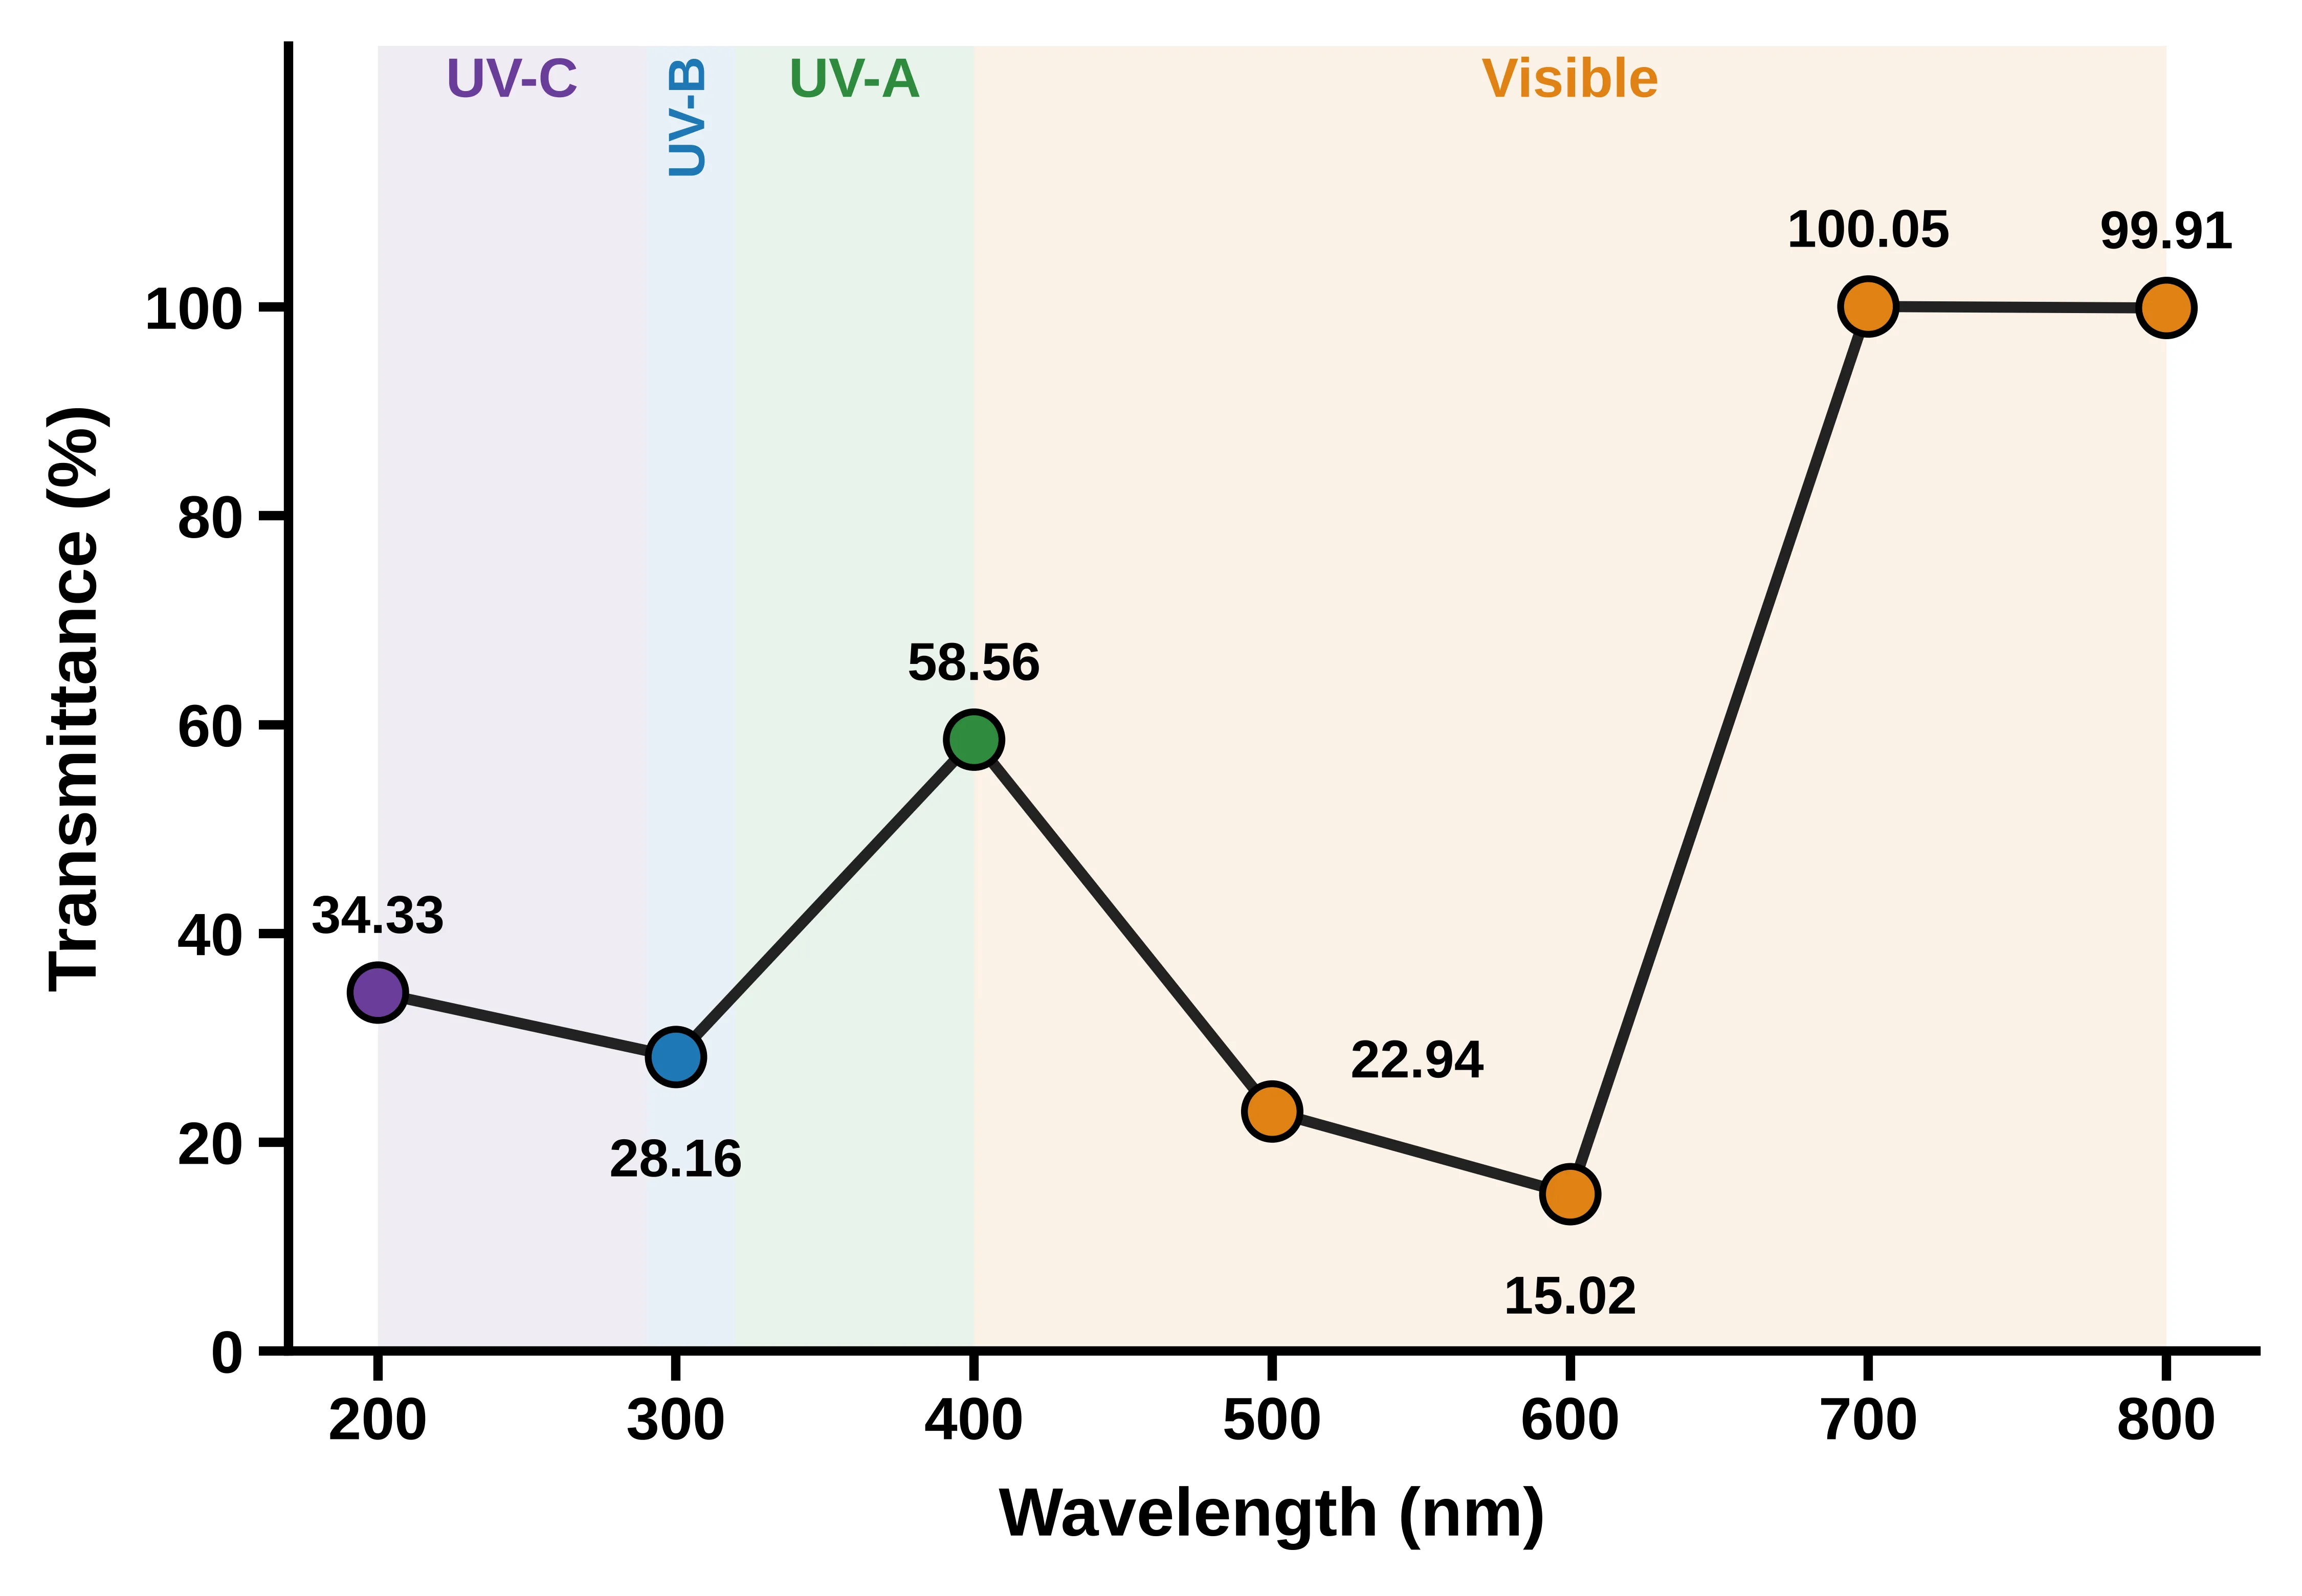
Figure 3 illustrates percent transmittance of the M. oleifera leaf extract at the same seven wavelengths. The value of 100.05 % at 700 nm is within instrument noise. The line joins discrete readings and is not a continuous scan.
Fig. 3 presents the percent transmittance at the same wavelengths and mirrors the absorbance data. In the ultraviolet range, transmittance was lowest at 300 nm (28.16%), against 34.33% at 200 nm and 58.56% at 400 nm. It fell further in the visible range, to 22.94% at 500 nm and 15.02% at 600 nm, the lowest value recorded. At 700 and 800 nm the sample transmitted essentially all of the incident light (100.05% and 99.91%), and the value above 100% lies within instrument noise. Each transmittance value agrees with its absorbance through A = −logâ‚â‚€(T/100). As in Fig. 2, the line joins discrete points and is not a continuous scan.
3.2 Ultraviolet absorption
The extract was absorbed in all three UV regions sampled. The highest ultraviolet absorbance was recorded at 300 nm (0.5503), where 28.16% of the light was transmitted. At 200 nm the absorbance was 0.4644, and at 400 nm it fell to 0.2324. Absorbance at 300 nm was therefore about 1.2 times the value at 200 nm and about 2.4 times the value at 400 nm. The extract attenuated more strongly in the UV-B region than at the long-wavelength end of UV-A, and UV-B is the region responsible for sunburn and the one most relevant to sunscreen screening [1]. The fraction of light not transmitted at each wavelength is compared in Fig. 4.
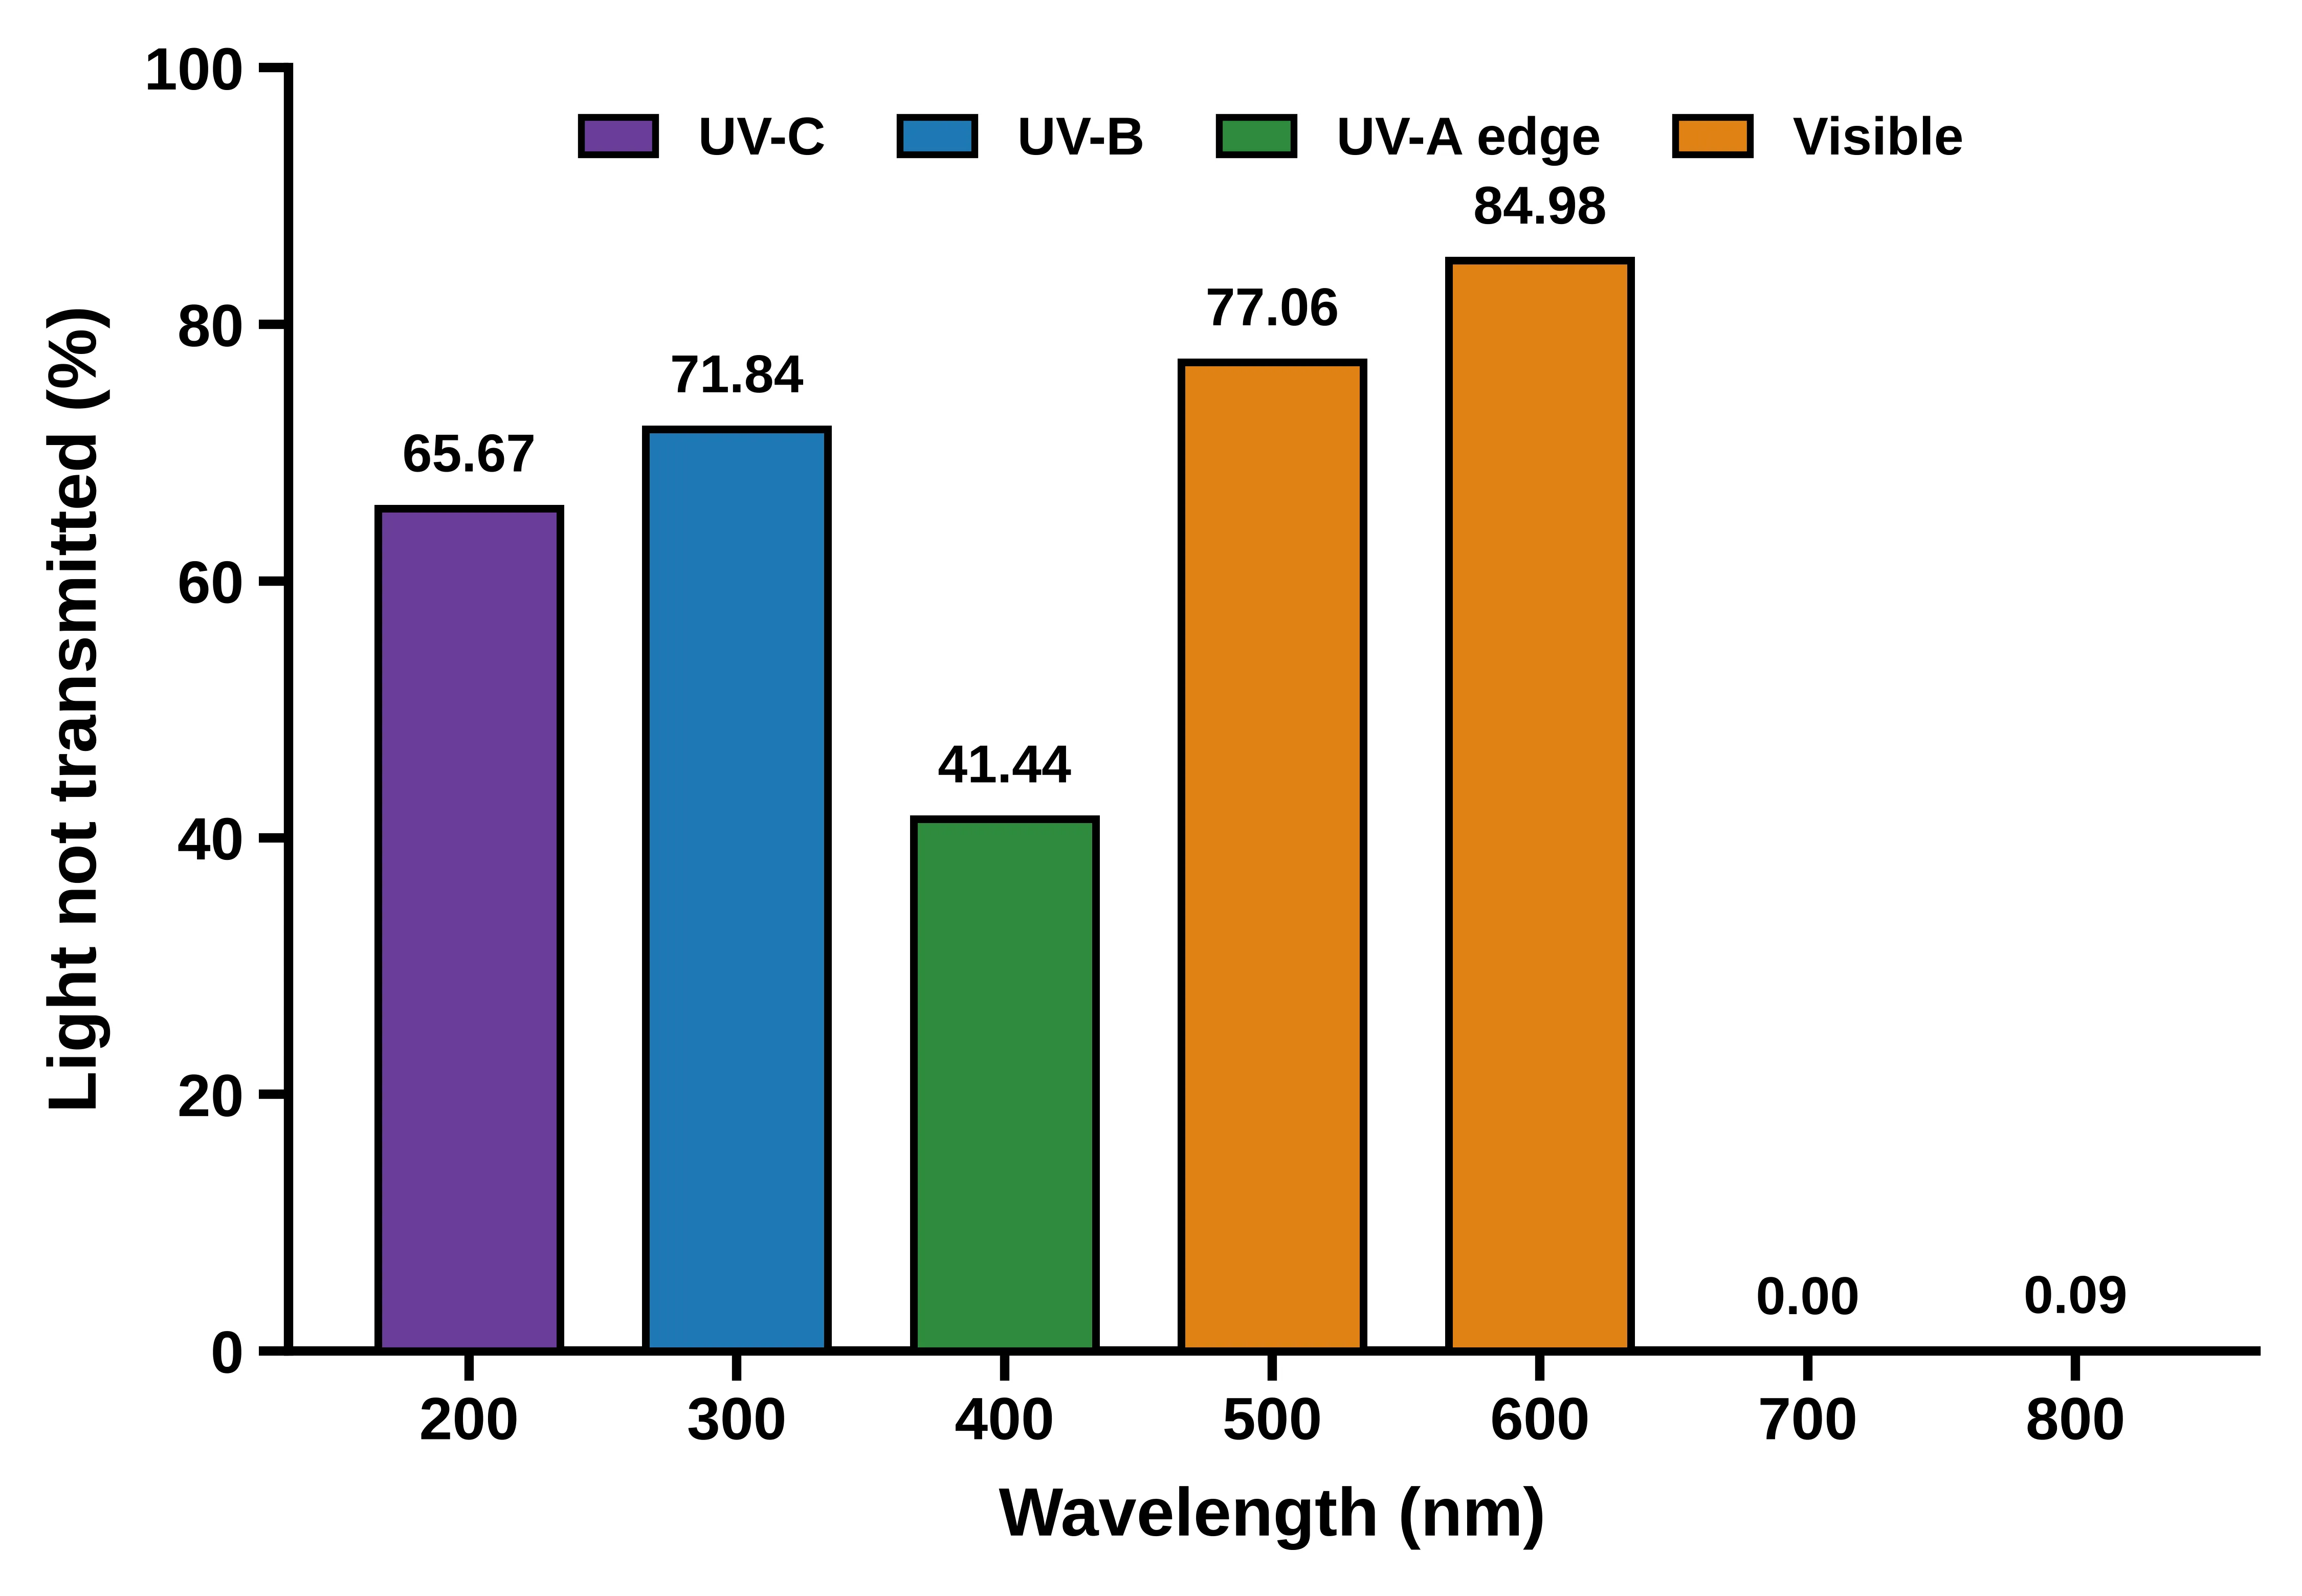
Figure 4 presents the percentage of incident light not transmitted (100 − T) by the M. oleifera leaf extract at each recorded wavelength, colored by spectral region.
This behavior agrees in general with the finding that plant compounds with aromatic rings absorb over a wide ultraviolet range [2]. Moringa oleifera leaves are reported to contain flavonoids and phenolic compounds [5], which may contribute to the observed absorption. This study, however, did not measure or identify any individual compound, so the absorbance cannot be assigned to a specific constituent.
The value at 200 nm should be read with care. Many solvents begin to absorb strongly near this wavelength, and the signal may include a solvent contribution as well as absorption by the extract.
3.3 Visible region and baseline
Absorbance rose again in the visible region, reaching 0.6394 at 500 nm and 0.8233 at 600 nm. Leaf extracts are colored, and carotenoids are among the constituents reported for Moringa oleifera [3]; thus, pigments may account for part of this signal. The present data do not show which pigments are responsible. Absorbance at 700 and 800 nm was -0.0002 and 0.0004, which is within instrument noise and confirms a flat baseline beyond 700 nm. The small transmittance value above 100% at 700 nm (100.05%) is consistent with that noise.
Because absorbance at 500 and 600 nm exceeds the ultraviolet readings, and the 400 nm reading is lower than the one at 500 nm, the spectrum between the sampled points cannot be inferred. A continuous scan is needed to show whether there are separate bands in the UV and visible regions.
3.4 Relation to earlier work on moringa photoprotection
Earlier work on Moringa oleifera has generally measured SPF in formulated products using the 290-320 nm range of the Mansur approach [8, 10] and has reported SPF rising with extract content in a lotion [7] and effects in rats with a nanoemulgel [9]. The present measurements concern the extract alone and are not SPF values. They show that the extract itself attenuates light in the UV-B region, which is the region those SPF methods examine, and in that respect, they are consistent with the rationale of the formulation studies [11]. A direct numerical comparison is not possible because the earlier studies used different solvents, concentrations, and formulations.
3.5 Comparison with related literature
Studies differ in solvent, concentration, path length, and wavelength coverage, so Table 2 compares what each recent study measured and reported, not absolute absorbance values.
Table 2: Recent Studies Used for Comparison with the Present Readings.
| Authors | Plant material and solvent | Measurement | Reported outcome |
|---|---|---|---|
| [15] | Moringa concanensis bark, methanol extract and fractions | TPC, TFC, DPPH, SPF, UVA/UVB absorption spectra | All fractions showed a broad-spectrum covering UVA and UVB; chloroform fraction SPF 10.46 at 200 µg/mL |
| [16] | Herbal plant extracts, ethanol | SPF (Mansur, 290-320 nm), TPC, TFC, antioxidant and cytotoxicity assays | Specific plant parts showed promising photoprotective capability |
| [17] | Papaya leaf, ethanol extract and fractions | SPF (Mansur) | Concentration for SPF 15: 90.08 ppm (ethyl acetate) vs 305.03 ppm (ethanol) |
| [18] | Jengkol leaf, ethanol extract | SPF at 290-320 nm, total phenolics | Best SPF 28.29 at 400 ppm (ultra category) |
| [19] | Kapuk randu leaf, ethanol extract | SPF at 290-320 nm, 100-500 ppm | Proposed as a sunscreen active; tannins and flavonoids present |
| [20] | Moringa oleifera leaf dye | UV-Vis spectrum | Three absorption peaks, the first at 334 nm |
| [21] | Moringa oleifera leaf, solvent extracts | Chlorophyll content over storage | Chlorophyll fell with storage, particularly in methanol and ethanol extracts |
| Present study | Moringa oleifera leaf, acidified ethanol | Absorbance at 7 wavelengths | 0.4644 (200 nm), 0.5503 (300 nm), 0.2324 (400 nm) |
Two points stand out. First, the UV-protection studies in Table 2 measure absorbance across 290-320 nm in 5 nm steps and convert it to an SPF, whereas the present work has a single UV-B reading at 300 nm. The high absorbance there (0.5503) shows the same UV-B attenuation that those studies quantify, but it cannot be placed on their SPF scale. Second, solvent matters. In the papaya leaf study, the ethyl acetate fraction needed about one third of the concentration of the ethanol extract to reach SPF 15 [17]. The present extract was made in acidified ethanol only, so the effect of solvent was not tested.
For Moringa specifically, a reported peak at 334 nm lies between the present readings at 300 and 400 nm, so it can neither be confirmed nor excluded here. The broad UVA and UVB coverage reported for a related species (M. concanensis) also cannot be checked, because the UV-A range (320-400 nm) was sampled only at its edge. In the visible region, chlorophyll in Moringa extracts has been reported to decline during storage, especially in ethanol and methanol [21]. Because pigments may contribute to the 500-600 nm absorbance seen here, storage time and extract age should be controlled in repeated measurements.
3.6 Future scope and socio-economic impact
The first step is a continuous 200-800 nm scan at several concentrations with replicates, which would locate absorption maxima and test linearity with concentration. This would allow SPF to be calculated from 290-320 nm absorbance, together with critical wavelength and the UVA/UVB ratio. Solvents should then be compared, and photostability tested after UV exposure. The compounds responsible should be identified by LC-MS profiling, as was done for the related species [15], and cytotoxicity should be checked alongside photoprotection [16]. Interest in plant-based filters is driven in part by concerns about synthetic ones. Sunscreen ingredients accumulate in marine biota and have wider environmental effects [22], and the widely used filter benzophenone-3 has been questioned for use by children and pregnant women [23]. Plant secondary metabolites, for example from Mexican plants, are being studied as UV-protective molecules [24], and microalgae are another natural source under investigation [28]. Protection also depends on how a product is applied and used [26], so any extract-based product would need testing in its finished form. UV exposure has benefits as well, such as vitamin D synthesis, so photoprotection should be balanced with these [27].
Moringa oleifera is a fast-growing tropical species, and its leaf biomass is being considered within circular bioeconomy models [25]. If the extract proves effective, locally grown leaves could in principle supply a low-cost raw material for small-scale producers. The same plant has also been studied as a dye for solar cells [20], which suggests more than one possible use for its extracts.
These benefits are potential only. The present study measured absorbance of a single extract at seven wavelengths and did not test protection, safety or any product.
3.7 Limitations
The present study is a preliminary spectroscopic screening, and several constraints limit the conclusions that can be drawn. Absorbance and transmittance were recorded at seven discrete wavelengths separated by 100 nm, from a single scan of one extract without replicates. The absorption maxima, band shape, and any peak structure, therefore, could not be resolved, and the measurement variability could not be estimated. The same sampling interval precluded the calculation of the in vitro sun protection factor, critical wavelength, and UVA/UVB ratio, which require absorbance at closely spaced wavelengths (typically 5 nm intervals) across 290-400 nm. In addition, absorbance depends on the extract concentration and the solvent system. The concentration was not standardized, and the pH was not recorded, so the reported values are valid only for the conditions in Section 2 and cannot be compared quantitatively with other studies. The strong absorption at 200 nm may also include a contribution from the solvent, which was not characterized separately. Photostability, phytochemical composition, and biological activity were not evaluated, and absorbance measured in solution does not predict performance in a formulated product or on skin. Future work should therefore include continuous, replicated spectral scans (200-800 nm) at several standardized concentrations, followed by SPF determination by the Mansur method and photostability testing after UV exposure.
4.0 Conclusion
The leaf extract of M. oleifera absorbed radiation with absorbance levels of 0.4644 (200 nm), 0.5503 (300 nm), and 0.2324 (400 nm), with the lowest absorbance in the ultraviolet region (UV-B) encompassing 71.84% of the radiation that was not transmitted, whereas a high absorbance (0.8233) was recorded in the visible region at 600 nm and low or negligible absorbance was recorded in the ultraviolet (400 nm) and visible (700, 800 nm) regions. Such values, however, are limited to single readings at seven wavelengths on one extract and are not indicative of absorption maximum, band shape, or variability. The high absorbance values of the extract in the UV-B region (71.84% of UV light was not transmitted) and the visible maximum absorbance value of the extract (0.8233 at 600 nm) are recorded only at seven wavelengths for one extract of unstandardized concentration and therefore do not represent either absorption maxima, band shapes, or absorbance variations; absorbance values at 700 nm and 800 nm were not measured; the photoprotective potential of the extract therefore needs to be established through continuous, replicated scans at the standardized concentration of the extract, followed by in vitro determination of SPF values and photostability testing.
Funding
No specific funding was received from any public, commercial, or not-for-profit funding agency for this research.
Conflict of Interest
The authors declare no conflicts of interest with respect to the research, authorship, or publication of this article.
Data Availability
The datasets generated during the current study are available from the corresponding author upon reasonable request.
CRediT Author Contributions
Ibrahim Abba Ibrahim: Conceptualization, methodology, data collection and Curation, writing the original draft preparation, Submission the Manuscript.
Lawan Abdulrazaq Ali: Investigation, resources, writing, reviewing and editing.
Hamza Mustapha Umar: Data Curation, writing, Software, formal analysis,
Kabiru Umar Abdullahi: Characterization, resources, validation.
Ethical Approval
This study did not involve human participants or animals performed by any of the authors. Not applicable
Consent to Publish
‘Not applicable’
REFERENCES



Ibrahim Abba Ibrahim, Lawan Abdulrazaq Ali, Hamza Mustapha Umar, Kabiru Umar Abdullahi, Spectroscopic Evaluation of the UV-Absorption Behavior of Moringa Oleifera Leaf Extract for Natural UV-Protective Applications, Int. J. Sci. R. Tech., 2026, 3 (11), 785-794. https://doi.org/10.5281/zenodo.24279017
 10.5281/zenodo.24279017