

We use cookies to ensure our website works properly and to personalise your experience. Cookies policy
CMR University, SOM Lakeside Campus, Bangalore, India.
This article examines the proposition that Bengaluru is India’s most inclusive metropolitan employment engine: a city capable of absorbing workers across unusually wide ranges of education, skill and income. Using evidence from the Karnataka Economic Survey 2025–26, national labour-force and platform-economy reports, Startup India, the Ministry of MSME and official technology-sector statistics, it develops the concept of an “employment ladder”. Bengaluru’s labour market is not one unified market but an interconnected system of high-productivity technology and global capability-centre employment, formal corporate and professional services, manufacturing and logistics, micro and small enterprise, platform-mediated work, construction, retail and household services. The city’s approximately 6.3 lakh MSMEs are reported to support around 51 lakh jobs, while Karnataka’s mature startup ecosystem, technology exports and concentration of multinational centres amplify both direct and induced demand. The article argues that this diversity lowers entry barriers and creates potential pathways of occupational mobility. It also rejects celebratory determinism: job availability is not equivalent to decent work. High housing and commuting costs, informality, gendered access, algorithmic control and a persistent mismatch between skills and job quality weaken inclusion. Bengaluru is therefore best understood not as a city that literally guarantees employment to everyone, but as India’s broadest urban employment platform—one whose long-term legitimacy depends on converting opportunity into productive, secure and upwardly mobile work.
From “Silicon Valley” to employment city
Bengaluru is normally narrated through a narrow lens: software engineers, venture capital, unicorns and glass-walled technology campuses. That portrait is accurate but incomplete. The visible technology economy sits on a far larger urban production system. Every office cluster generates demand for security guards, drivers, electricians, cooks, cleaners, delivery partners, retail workers, warehouse staff, teachers, nurses, accountants, designers, lawyers, recruiters, repair technicians and small suppliers. Advanced services and ordinary urban work are not rival economies; they are mutually reinforcing layers of the same metropolitan system.
The stronger and more defensible proposition is therefore not that Bengaluru guarantees a job to every individual. No city can substantiate such a claim, and official labour statistics do not permit it. Rather, Bengaluru appears to offer India’s widest metropolitan range of work across income and skill groups. This “employment ladder” matters because labour-market inclusion depends on both horizontal diversity—the number of sectors through which a worker may enter—and vertical mobility—the possibility of moving from low-productivity or insecure activity into better-paid, more formal and more productive work.
The central question is thus: what makes Bengaluru unusually capable of generating work at the top, middle and base of the income distribution, and what prevents this breadth from becoming genuinely inclusive prosperity?
2. Analytical framework and method
The article uses a descriptive-analytical method and triangulates four forms of evidence. First, district-level MSME and employment figures establish the depth of the enterprise base. Second, official startup and technology indicators capture high-productivity job creation. Third, national labour and gig-economy evidence clarifies how platformisation opens work to workers with different skill levels. Fourth, the ten Bengaluru ventures identified in the source note are treated as illustrative cases of ecosystem breadth rather than as a representative statistical sample.
The term “employment ladder” is used analytically. It describes a metropolitan economy with multiple entry points and potential transitions: casual or own-account work; platform and frontline services; skilled trades and MSME employment; salaried professional and corporate work; and entrepreneurial or knowledge-intensive leadership. The ladder metaphor does not imply that upward movement is automatic. Human capital, language, gender, caste, networks, digital access, transport and the cost of living all influence who can climb it.
3. The statistical foundation: a dense enterprise economy
The most striking figure in the Karnataka Economic Survey 2025–26 is Bengaluru’s approximately 6.3 lakh MSME enterprises generating around 51 lakh jobs. Karnataka as a whole records roughly 24.8 lakh MSMEs and more than 2.3 crore associated jobs. Bengaluru therefore represents about one quarter of the state’s MSME units and just over one fifth of its reported MSME employment. These are registrations and declared employment rather than a census of unique, continuously employed persons; they should be read as an indicator of economic scale, not as a precise metropolitan headcount (Government of Karnataka, 2026).
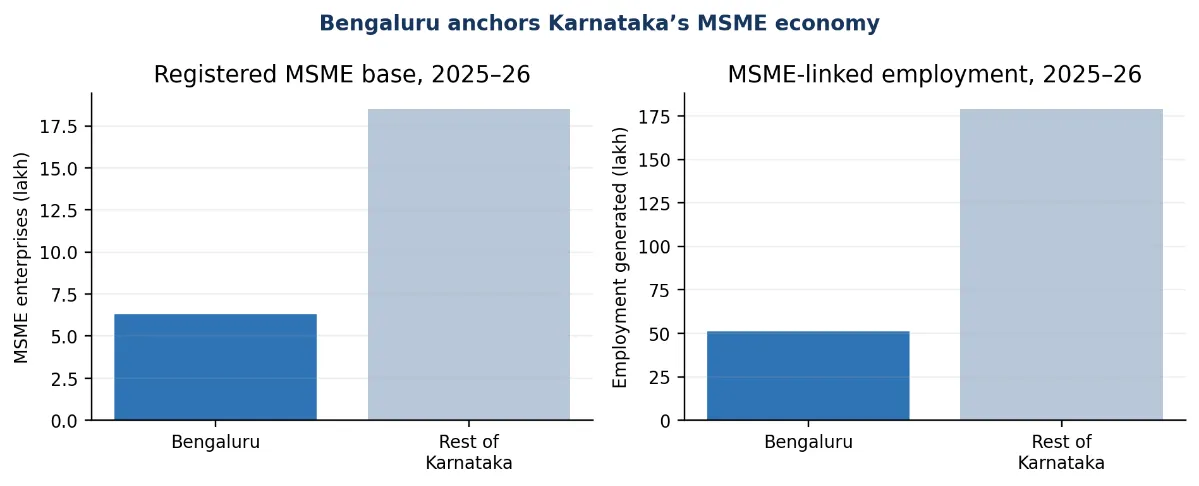
Source: Calculated from Government of Karnataka (2026); figures rounded.
Figure 1. Bengaluru’s place in Karnataka’s MSME economy
|
Indicator |
Bengaluru |
Karnataka |
Bengaluru share |
|
MSME enterprises |
6.3 lakh |
24.8 lakh |
25.4% |
|
MSME-linked employment |
51 lakh |
>230 lakh |
≈22.2% |
|
Average jobs per enterprise (derived) |
≈8.1 |
≈9.3 |
Indicative only |
Source: Government of Karnataka (2026); author’s calculations. Rounded values make ratios approximate
Table 1. MSME scale and employment intensity, 2025–26
The economic importance of these figures lies in enterprise density. A large micro-enterprise base creates work for people who may not enter a multinational corporation: shop assistants, fabricators, food processors, mechanics, tailors, technicians, bookkeepers, salespersons and family workers. At the same time, small and medium firms supply software, components, facilities, logistics and professional services to larger enterprises. Bengaluru’s labour-market breadth is therefore generated by linkages, not merely by the coexistence of unrelated sectors.
4. Bengaluru’s seven-rung employment ladder
|
Rung |
Illustrative work |
Typical entry asset |
Economic role |
|
1. Household & neighbourhood services |
Domestic work, care, food vending, repairs, security |
Availability, trust, local networks |
Supports daily reproduction of the city |
|
2. Construction & urban operations |
Masons, helpers, drivers, maintenance, sanitation |
Physical skill, trade experience |
Builds and maintains metropolitan infrastructure |
|
3. Platform & frontline services |
Delivery, ride-hailing, fulfilment, field sales |
Smartphone, vehicle or task skill |
Converts digital demand into local income |
|
4. MSMEs & skilled trades |
Machining, garments, food processing, bookkeeping, retail |
Vocational, commercial or technical skills |
Diversifies production and supplier networks |
|
5. Formal services & manufacturing |
Banking operations, education, health, aerospace, electronics |
Diploma, degree or certification |
Creates stable middle-income employment |
|
6. IT, R&D & GCCs |
Software, analytics, finance, design, cybersecurity, research |
Advanced technical/professional skills |
Generates high productivity and export income |
|
7. Entrepreneurship & capital formation |
Startup founders, specialist consultancies, scalable MSMEs |
Ideas, networks, finance and risk capacity |
Creates firms, innovation and future jobs |
Source: Author’s framework; categories overlap and do not imply automatic progression.
Table 2. A stylised Bengaluru employment ladder
The ladder is unusually broad because the top rungs continually stimulate the lower and middle rungs. A new technology campus directly hires engineers and managers, but it also procures transport, catering, maintenance, recruitment, legal, accounting and security services. Its employees demand housing, education, healthcare, entertainment, food and mobility. Economists describe these as indirect and induced effects. Bengaluru’s distinctive advantage is that much of this demand can be met locally by a thick network of enterprises and workers.
5. The high-productivity anchor: IT, startups and global capability centres
India’s technology sector expanded from US$118 billion in total revenue in FY2014–15 to an estimated US$283 billion in FY2024–25; exports rose from US$100 billion to US$224 billion (Ministry of Electronics and Information Technology, 2025). These are national figures, but Bengaluru is the country’s most important spatial concentration of technology firms, research talent and global business-service operations. The national expansion therefore provides the demand environment within which Bengaluru’s high-skill labour market has deepened.
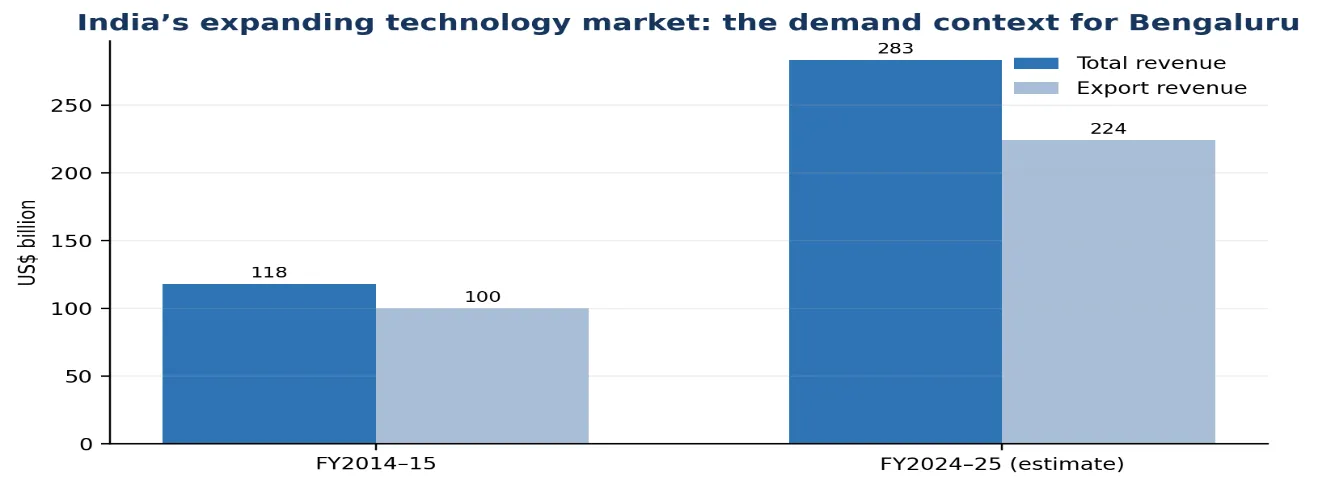
Source: Ministry of Electronics and Information Technology (2025), citing NASSCOM.
Figure 2. Growth of India’s technology industry
Karnataka’s startup system supplies a second anchor. Startup India reports 21,000 startups, more than 40 unicorns and 14 Centres of Excellence in the state (DPIIT, 2026). Bengaluru accounts for the dominant share of this ecosystem. Startups matter beyond founder wealth: they create employment in engineering, sales, operations, customer support, compliance, content, warehousing and field execution. Successful ventures also generate alumni networks whose skills and capital seed subsequent firms.
Global capability centres (GCCs) extend the model beyond software outsourcing. They increasingly perform finance, analytics, product development, cybersecurity, engineering and R&D for multinational enterprises. Karnataka’s policy objective of expanding the GCC base and creating 350,000 additional jobs by 2029 demonstrates both the opportunity and the risk: such employment can raise productivity and wages, but its benefits remain concentrated unless education, transport and housing enable a wider population to participate (Government of Karnataka, 2024).
6. Startups and enterprises as bridges across sectors
|
Enterprise |
Sector |
Employment-system significance |
|
Flipkart |
E-commerce |
Links technology, warehousing, sellers, delivery and customer operations |
|
Zerodha |
Fintech |
Demonstrates profitable, technology-led financial intermediation |
|
Swiggy |
Food delivery & quick commerce |
Connects restaurants, dark stores, logistics and platform labour |
|
Razorpay |
Payments infrastructure |
Enables business formalisation and digital transactions |
|
PhonePe |
Digital financial services |
Links consumers and merchants through a mass payments network |
|
Meesho |
Value e-commerce |
Expands market access for small suppliers and resellers |
|
Ather Energy |
Electric mobility |
Combines R&D, manufacturing, retail and charging infrastructure |
|
NoBroker |
Property technology |
Creates digital, field-sales and service work around housing |
|
Jar |
Digital savings |
Illustrates fintech products aimed at small-ticket participation |
|
Zishta |
Crafts & sustainable homeware |
Connects an urban MSME to artisan livelihoods across states |
Source: Adapted from the supplied manuscript; company descriptions are illustrative, not a performance ranking.
Table 3. Ten Bengaluru ventures and their labour-market linkages
The cases reveal why Bengaluru cannot be reduced to “IT jobs”. E-commerce depends on logistics and small sellers; fintech serves merchants and consumers; food platforms coordinate restaurants and delivery; electric mobility joins software to manufacturing and infrastructure; and craft retail connects metropolitan demand with dispersed artisan production. Digital firms therefore act as bridges between high-skill capital and lower-barrier economic participation. Yet the distribution of value is unequal: a software architect, warehouse picker and delivery partner may be connected by the same platform while experiencing radically different wages, bargaining power and security.
7. Platform work: a rapid entry gate, not yet a secure rung
Platform work is especially important to the claim of broad employability. NITI Aayog estimated 7.7 million gig workers in India in 2020–21 and projected 23.5 million by 2029–30. Its skill distribution—31 per cent low-skilled, 47 per cent medium-skilled and 22 per cent high-skilled—shows that the platform economy is not confined to one educational group (NITI Aayog, 2022). Bengaluru’s density of consumers, firms, smartphones and venture-backed platforms makes it a major arena for this form of work, although city-level worker counts remain inadequate.
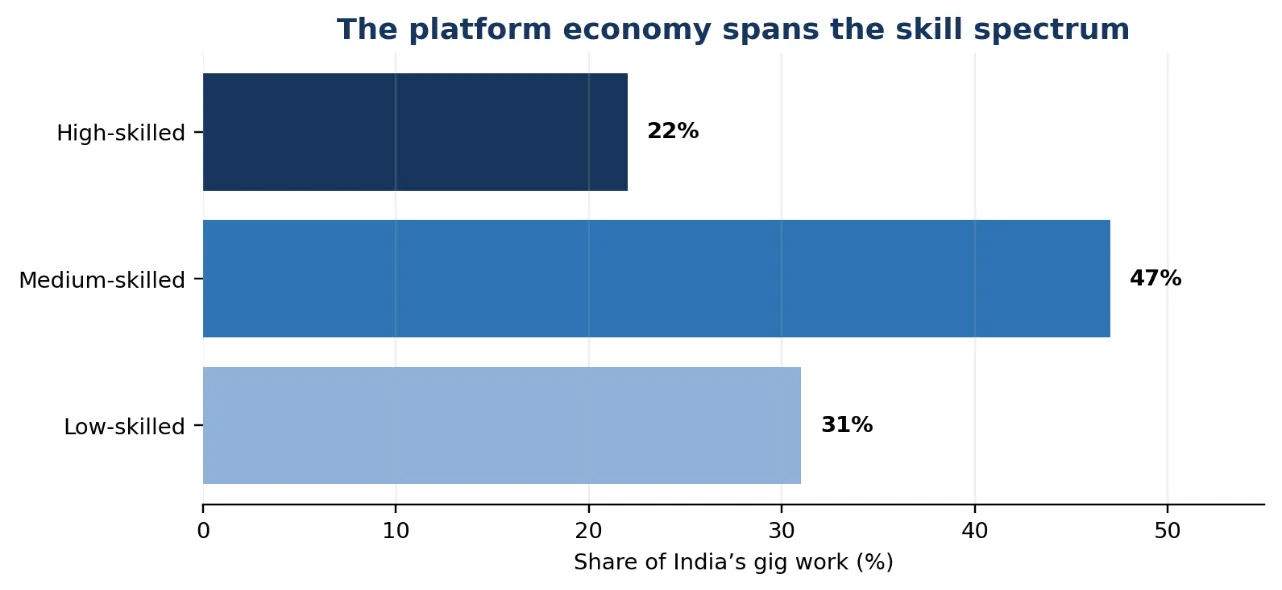
Source: NITI Aayog (2022). National distribution; not a Bengaluru-only estimate.
Figure 3. Skill composition of India’s gig economy
For a migrant or displaced worker, delivery, driving, beauty services, repair or task-based platforms may provide quicker labour-market entry than formal recruitment. This flexibility is economically valuable. However, gross receipts are not net income: fuel, vehicle finance, maintenance, waiting time and unpaid risk can materially reduce earnings. Algorithmic ratings and unilateral changes in incentives can further weaken worker bargaining power. Platform work must therefore be treated as an entry gate whose quality depends on transparent contracts, portable social protection, accident insurance, grievance redressal and credible earnings disclosure.
8. Why the city attracts workers at different income levels
Four mechanisms explain Bengaluru’s unusual absorptive capacity.
Agglomeration: firms benefit from proximity to talent, suppliers, finance, customers and knowledge. Each new investment can enlarge the market for complementary services.
Demand multipliers: high-wage technology and professional employment generates local expenditure on housing, education, food, mobility, care and leisure, creating work outside the technology sector.
Low- and high-barrier entry points: a worker may enter through casual, platform or neighbourhood services, while graduates and specialists enter formal corporate, technical and research roles.
Enterprise churn and experimentation: frequent startup creation and failure reallocate people, ideas and capital. This is disruptive but also creates repeated opportunities for re-employment and entrepreneurship.
The result is a labour market with many doors. This does not mean all doors are equally accessible or lead to the same destination. English proficiency, digital literacy, recognised credentials, safe transport, affordable housing and professional networks heavily influence outcomes. Bengaluru’s employment advantage is breadth of opportunity; its inclusion problem is unequal capability to convert opportunity into durable advancement.
9. The counter-case: employment abundance can coexist with labour distress
|
Constraint |
Labour-market effect |
Policy implication |
|
High housing cost |
Pushes lower-paid workers to distant peripheries or overcrowding |
Rental housing near job clusters; dormitories and hostels |
|
Congestion and long commutes |
Reduces effective hourly earnings and labour-force participation |
Reliable buses, metro integration, walking and last-mile links |
|
Informality and insecure contracts |
Weakens income stability, benefits and bargaining power |
Portable social security, written terms and enforcement |
|
Skill mismatch |
Vacancies and unemployment can coexist |
Employer-linked apprenticeships and modular upskilling |
|
Gendered safety and care burdens |
Restricts women’s access to shifts, locations and career continuity |
Safe transport, childcare and flexible formal work |
|
Digital and language divides |
Excludes workers from platforms and formal recruitment |
Multilingual job services and assisted digital access |
|
Ecological stress |
Water, heat and flooding disrupt firms and workers |
Climate-resilient infrastructure and dispersed job nodes |
Source: Author’s synthesis.
Table 4. From job quantity to employment quality
The city’s success also produces its own diseconomies of agglomeration. Rising rents, road congestion, water stress and long commutes function like an implicit tax on labour. For a highly paid professional, these costs are inconvenient; for a guard, domestic worker or delivery partner, they can determine whether employment is economically viable. A publication-quality assessment must therefore distinguish three concepts: availability of tasks, adequacy of earnings and quality of employment.
Nor should MSME employment figures be interpreted as proof of formal, full-time or unique jobs. Administrative databases can include self-employment, declared employment and enterprises of differing operational status. City-specific unemployment, wage and occupational-transition data remain insufficient. The thesis is consequently structural and comparative: Bengaluru possesses an exceptionally diverse employment ecosystem, but the precise probability that a particular worker will obtain decent work cannot be inferred from enterprise counts alone.
10. A policy agenda for an inclusive employment metropolis
Bengaluru should pursue an “employment ladder compact” that links growth policy to mobility and job quality.
Measure the city labour market: publish a Bengaluru employment dashboard covering vacancies, wages, occupations, gender, migration, informality, platform work and commuting time. Administrative counts should be reconciled with surveys.
Build progression into entry-level work: create stackable skill certificates and employer-recognised “skill passports” so experience in logistics, retail, facilities and platform work can lead to supervisory and technical roles.
Deepen MSME–large firm linkages: supplier-development programmes, prompt payment, shared testing facilities, digital compliance support and affordable industrial workspaces can convert corporate growth into distributed employment.
Make mobility an employment policy: integrated fares, higher bus frequency, safe last-mile access and transit-oriented affordable rental housing would raise effective wages by reducing time and transport costs.
Protect platform and informal workers: ensure transparent pay statements, accident cover, grievance mechanisms and portable benefits without eliminating flexible entry.
Expand women’s access: safe late-hour transport, neighbourhood childcare, sanitation and enforceable anti-harassment systems are economic infrastructure, not peripheral welfare measures.
Create multiple job districts: planned employment nodes around transit and satellite towns can reduce excessive centralisation while retaining the benefits of the wider Bengaluru ecosystem.
CONCLUSION
Bengaluru’s defining economic achievement is not merely that it hosts celebrated technology firms. It is that a high-productivity innovation economy has become intertwined with one of India’s deepest MSME networks and a vast urban service economy. The resulting system offers work at remarkably different levels of skill, capital and income—from delivery, retail and household services to machining, education, finance, software, R&D and entrepreneurship.
That evidence supports a strong but qualified conclusion: Bengaluru is arguably India’s broadest metropolitan employment ladder. It should not be described as a city that literally provides a job for everyone. Such language confuses opportunity with guarantee and quantity with quality. The more consequential claim is that Bengaluru offers more varied routes into economic participation than any other Indian metropolis, while also displaying the country’s sharpest contradictions between innovation and insecurity, high wages and high living costs, flexibility and precarity.
The city’s next development phase must therefore be judged not only by unicorns, exports or office absorption, but by occupational mobility: whether a delivery partner can become a logistics supervisor; whether an MSME technician can acquire advanced certification; whether women can reach and retain safe formal work; and whether urban services pay enough to sustain life near the jobs they support. If Bengaluru can convert its many entry points into genuine pathways of advancement, it will be more than India’s technology capital. It will become the country’s most credible model of an inclusive employment metropolis.
REFERENCES

Rajib Kumar Sanyal*, Santosh Angadi, Roopa Devi, Aarya Aarya, The Bengaluru Employment Ladder: Why India’s Technology Capital Offers Work Across The Income And Skill Spectrum, Int. J. Sci. R. Tech., 2026, 3 (8), 156-164. https://doi.org/10.5281/zenodo.21790858
 10.5281/zenodo.21790858