

We use cookies to ensure our website works properly and to personalise your experience. Cookies policy
1Department of Pharmaceutics, Arvind Gavali College Of Pharmacy Jaitapur Satara.
2Department of Pharmacology, Arvind Gavali College Of Pharmacy Jaitapur Satara.
Pharmacoepidemiology examines the use and effects of medicines in large populations and provides evidence for drug safety, effectiveness, utilization, and public health decision-making. This narrative review describes the concepts, major data sources, epidemiological study designs, important sources of bias, causal inference frameworks, and emerging directions in pharmacoepidemiology. Real-world sources discussed include electronic health records, insurance claims, patient registries, digital and mobile health data, prescription and pharmacy dispensing databases, economic assessments, national health surveys, and pharmacovigilance databases. Observational and experimental designs are compared, including descriptive studies, cohort and case-control studies, cross-sectional designs, randomized controlled trials, and non-randomized controlled trials. Particular attention is given to confounding, selection, information, time-related, misclassification, immortal-time, prevalent-user, and other biases, together with methods such as propensity scores, directed acyclic graphs, target-trial emulation, marginal structural models, instrumental variables, and sensitivity analyses. Future directions include artificial intelligence and machine learning, integration of real-world data with randomized evidence, international data networks, regulatory science, and real-time pharmacovigilance.
Examining the usage and effects of drugs in large populations after they are approved for commercial release is the focus of the important field of pharmacoepidemiology. Pharmacoepidemiology and Drug Safety aims to create a global forum for the sharing and evaluation of pharmacoepidemiology-related data, approaches, and perspectives. [1] Due to the widespread use of drugs in clinical practice, pharmacoepidemiology emerged at the close of the previous century as a means of evaluating their effects. Its goals are to evaluate medication use patterns, analyze drug efficacy and adverse drug reactions (ADRs), and compare data from clinical trials with drug use in clinical practice.[2]
The concepts, methods, applications, difficulties, and potential future directions of pharmacoepidemiology in drug safety monitoring and public health decision-making are examined in this narrative review.
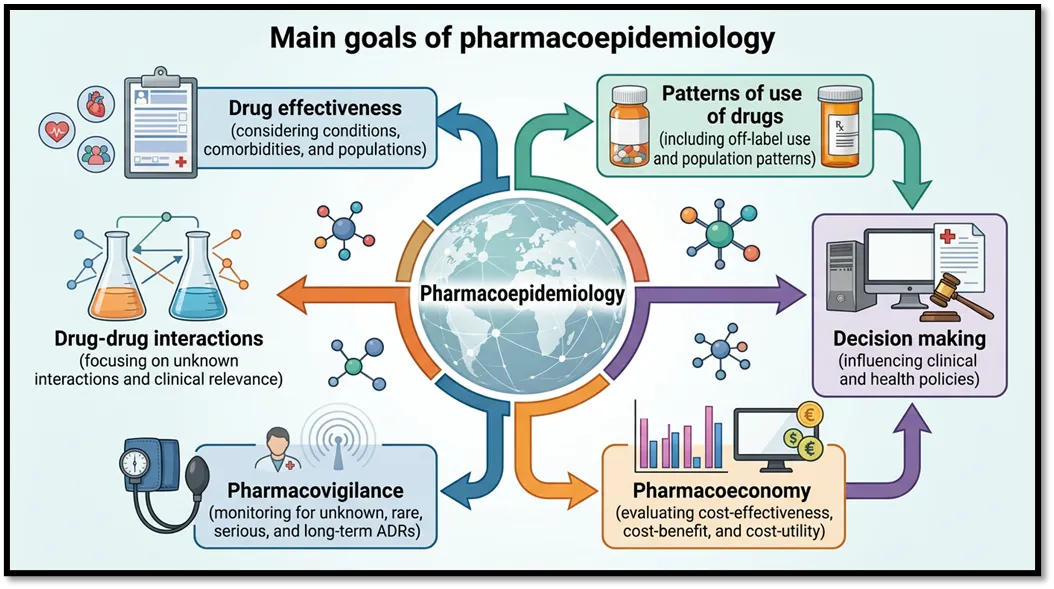
Figure 1: Core goals and multidimensional scope of pharmacoepidemiology.
Goals And Concept Of Pharmacoepidemiology:
Pharmacoepidemiology is described as the investigation of drug use and effects in large populations by using epidemiological methodologies to pharmacological research.(1)
|
Goals |
An explanation |
Public Health Significance
|
|
Comparative studies of effectiveness. |
Comparing treatment results in real-world situations |
Helps Make Clinical Decisions |
|
medication utilization patterns |
Assessment of prescription and drug use trends |
Promotes The Proper Use Of Medications |
|
Pharmacovigilance |
Detect and quantify adverse drug reactions (ADRs) |
Increases The Safety Of Medications |
|
Policy development |
Evidence-based policy development |
Improves Population Health Outcomes |
|
Evaluation of risk and benefits |
Assessment of treatment advantages against possible hazards |
Provides Information For Regulatory Actions |
|
Digital Epidemiology & Real-World Data (RWD) Integration |
Utilizing unstructured health data from wearables, patient forums, and mobile apps alongside traditional EHRs |
Enables Real-Time Tracking Of Drug Safety And Adherence Outside Clinical Settings. |
|
Eco-Pharmacoepidemiology |
Monitoring the public health and ecological consequences of pharmaceutical waste and drug residues in the ecosystem. |
Directs Environmental Safety Standards And Tackles Threats Like Widespread Antimicrobial Resistance. |
Table 1: Pharmacoepidemiologic Goals & Their Public Health Impact
Data Sources For Pharmacoepidemiology
Pharmacoepidemiologic studies use a Various kinds of data sources, such as
1) Electronic Health Records (EHR):
EHR are digitalized patient records that include a wealth of clinical data, such as diagnoses, prescription drugs, test results, and treatment histories. Pharmacoepidemiology makes extensive use of EHRs for Studies on the efficacy of drugs,identification of adverse drug reactions (ADRs), Analysis of population health.(3)
2) Insurance claims databases:
These can be used to find trends in drug use and adverse occurrences and include data on medical claims. These datasets are very helpful for large-scale research on drug use, analysis of cost-effectiveness, long-term safety surveillance. (4)
3) Patient Registries:
Patient registries are organized systems that collect regular data on individuals with specific Patient registries are structured systems that collect continuous data on individuals with particular illnesses or exposures throughout time. They are particularly useful for rare disease research, long-term safety monitoring, and post-marketing surveillance. (5)
4) Mobile and Digital Health:
According to recent research, data from social media platforms like Facebook and Twitter can be helpful for analyzing drug safety. Health apps for mobile devices, Wearable technology, Social media networks. These data sources allow for real-time monitoring of health outcomes and drug adherence.(3)
5) Big Data Analysis:
Big data analytics makes it possible to use huge healthcare utilization databases for long-term follow-up, subgroup analysis, and the investigation of uncommon adverse events. (5)
6) Prescription Databases:
These types of databases can be used to find patterns of medication use and possible drug interactions. They usually include comprehensive information about medications prescribed to patients, including the medicine name, dose, the duration of the prescription, and the prescribing healthcare professional.(6)
7) Pharmacy Dispensing Databases:
These give information regarding medication adherence and indicate that the patient has received the drug, but they do not guarantee that the medications have been taken. As a result, it is an imprecise measure of drug exposure in an outpatient. (7)
8) Economic assessment:
This assesses the costs of medical treatment, including preparation, administration, drug monitoring, managing adverse drug reactions (ADRs) (including duration of stay and monitoring tests conducted), and the financial implications of a drug's advantages.(8)
9) National Health Surveys:
These are extensive surveys that gather data on people's health, usage of healthcare, and use of medications within a population.(9)
10) Pharmacovigilance Databases:
These include data on suspected adverse drug reactions (ADRs), suspected medications, and patient outcomes that are gathered from a range of sources, including medical literature, pharmaceutical firms, healthcare providers, national authorities, and patients themselves.(3)
|
Data Source |
Main Strength |
Primary Use |
Major Limitation |
|
Electronic Health Records (EHRs) |
Deep, comprehensive clinical detail (labs & history) |
Drug effectiveness & ADR tracking |
Missing values & coding inconsistencies |
|
Insurance Claims |
Massive scale and highly standardized data |
Large-scale utilization & cost analysis |
Lacks granular clinical depth/severity |
|
Patient Registries |
High-quality, long-term (longitudinal) uniform tracking |
Rare disease research & surveillance |
High risk of selection bias |
|
Digital & Mobile Health |
Captures real-time, continuous patient metrics |
Tracking vitals & medication adherence |
Highly unstructured and erratic data quality |
|
Big Data Analytics |
Integrates massive volume and variety simultaneously |
Processing complex, rapid data streams |
Major data reliability (Veracity) challenges. |
|
Prescription Databases |
Captures precise provider intent (exact drug names, dosages, durations, clinicians). |
Identifying medication patterns and catching potential drug interactions. |
Fails if patient adherence is poor; cannot extract actual doses taken or daily regimens. |
|
Pharmacy Dispensing Databases |
Hard confirmation that the patient physically went out and acquired the medicine. |
Assessing and tracking long-term patient medication adherence. |
Vague indicator of true drug exposure; no guarantee the patient actually ingested it. |
|
Economic Assessment |
Tracks end-to-end medical care costs (prep, administration, hospital stays). |
Calculating financial consequences against the clinical benefits of a drug. |
Focuses entirely on financial and resource metrics rather than clinical nuances. |
|
National Health Surveys |
Captures broad, representative population health metrics, lifestyle data, and general healthcare utilization. |
Population health monitoring; Evaluating national health status trends |
High risk of patient recall bias; Data collected at fixed intervals rather than continuously. |
|
Pharmacovigilance Databases |
Aggregates suspected adverse events from global sources (patients, providers, literature, companies). |
Early signal detection for unknown ADRs
|
High dependency on spontaneous, voluntary reporting |
Table 2: Strengths, Uses, and Limitations of Real-World Health Data Sources
Types of epidemiological Design:
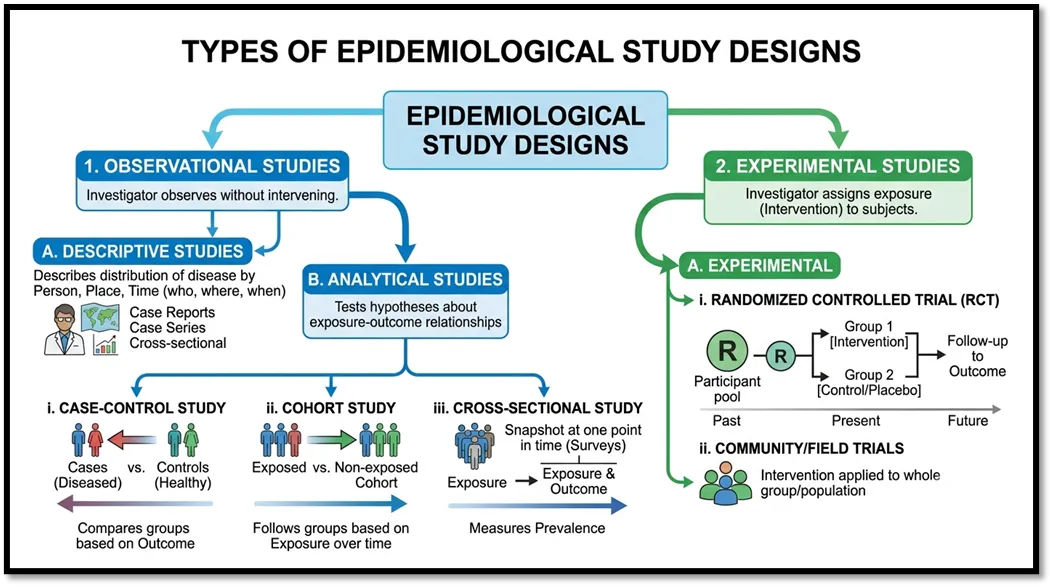
Figure 2: Overview and classification framework of epidemiological study designs
Observational Vs. Experimental:
|
Observational |
Experimental |
|
Also known as Non-investigational/Non interventional/Uncontrolled |
Also known as Investigational or Interventional or Controlled trials |
|
These studies generate hypotheses and fall into two categories: descriptive and analytic. |
Hypothesis testing studies |
|
Descriptive observational investigations describe the exposure or the result, whereas analytic observational studies quantify the relationship between the two. |
It entails an intervention that assesses the relationship between exposure and outcomes. |
|
Monitored in real-world, natural environments; less rigid control over confounding variables. |
Monitors by Investigator, Ethical & Regulatory authorities in controlled environment |
|
Does not naturally use very strict experimental control groups (groups are selected based on exposure or disease status, as in cohort or case-control studies). |
Contains Testing and Controlled group |
Table 3: Observational vs. Experimental Research: Methodological Differences
1.Observational Studies:
In observational investigations, the researcher notes a naturally occurring link between exposure and outcome.The researcher is only monitoring and evaluating the traits of specific groups of people in this study design. Neither medications nor surgical procedures are used as active interventions.(10)
A) Descriptive Study:
Descriptive studies focus on one or more features of a group of individuals, rather than analyzing them. They never try to provide answers or determine correlations between variables. These kinds of investigations may lead to hypotheses. Case reports, case series, and cross-sectional surveys are a few types of descriptive research.(11)
Case report:
A case report is a comprehensive description of certain patients or clinical instances with distinctive disorders or complications, as well as atypical or misleading semiology, etiology, or result.(12)
Case Series:
A case series refers to a group of people who have the same characteristic or medical condition. They are not useful for determining whether there is a statistical correlation, but they can be used to develop hypotheses and investigate the possibilities of doing analytical or experimental research. (12)
Cross‑sectional surveys:
This type of study, a cross-sectional study design, assesses a larger number of patients at once with no follow-up. A comparative group does not exist. The cause and consequences have already occurred. It can determine the prevalence of a disease or risk factor.
B) ANALYTICAL STUDY:
The goal of analytical epidemiological study designs is to comprehend the relationships between exposure and outcome. Therefore, testing hypotheses is a typical method used in analytical designs to explain why and/or how a health outcome happens. There are various kinds of them.(13)
Cross‑sectional analytical study:
The goal of analytical cross-sectional research is to simultaneously evaluate a dependent variable (outcome) and an independent variable (exposure) in a specific population. The main characteristic of an analytical cross-sectional study is that it collects data on exposures (risk factors or independent variables) and outcomes (illness or dependent variables) at a single point in time. The nature of cross-sectional studies is retrospective.
Cohort study:
A cohort is a collection of participants who have something in common, typically exposure to the item being studied. Until participants experience the desired effect, are lost to follow-up, or the study concludes, the cohort is tracked throughout time and compared with another cohort of unexposed people. They might be either prospective or retrospective. The two groups (exposed and unexposed) in prospective cohort studies are created prior to the onset of the desired result or illness.
Case control study:
In order to find differences in risk variables, case-control studies compare two groups, such as people with an illness (called cases) and subjects without a disease (called controls). This research is utilized to investigate an illness's etiology or risk factors, particularly when the disease is uncommon. In a case-control study, identifying controls is crucial since it can affect how the relationship between exposure and outcome is estimated. These studies are always retrospective because the results have already been obtained and are backward-directed.(13)
2) Interventional study:
Researchers that use interventional study designs also known as experimental study designs intervene at some point during the investigation. In an interventional investigation design, the researcher takes an active role in the process by giving an intervention to some or all participants.This is a prospective design.
Interventional study methods can be broadly classified into two categories:
1. Clinical trials
2. Community experiments.
Randomized Controlled Trials:
A randomized clinical trial may also be referred to as parallel group randomized trials or randomized controlled trials. Randomized clinical trials entail assigning patients with identical characteristics to two (or more) groups: one that receives the experimental or intervention therapy and one that receives a placebo (or standard of care). Randomization is a way to eliminate "bias" while allowing for comparability. Randomization is the "heart" of each controlled trial. It will provide the most confidence that the groups are equivalent, allowing "like can be compared with like". This is often done via computer software, manually, or by other techniques. As a result, we can measure the results and efficacy of the intervention/experimental therapy being examined without bias because patients were randomly assigned to their respective groups with equal baseline characteristics. This study design is regarded the gold standard for clinical research. This study design is not generally relevant to rare and dangerous disease processes since treating those patients with a placebo would be unethical. Randomization can be done in a variety of ways, from a simple 'flip of a coin' to using computer software and statistical approaches. To further understand randomization, consider three types: simple randomization, block randomization, and stratified randomization.(14)
Types of Randomization:
Simple randomization
Simple randomization involves assigning people to trial or intervention groups at random with a constant probability.That is, if there are two categories, A and B, the subject has a 0.5 chance of being assigned to either one. This can be done in a variety of ways, ranging from a simple 'flip of a coin' to using random tables or numbers. The benefit of utilizing this process is that it removes selection bias.
Block randomization
Block randomization groups participants with comparable features into blocks. Block randomization aims to balance the number of people assigned to each trial or intervention group. For example, suppose there are four participants in each block, and two of them are randomly assigned to each group. As a result, there will be two subjects in one group and two in the other.
Stratified randomization
Stratified randomization involves categorizing subjects according to specific strata, which are covariates. For instance, age can serve as a covariate, allowing the population to be randomized within each age category concerning an experiment or intervention group. This approach offers the benefit of enhancing comparability between experiment and intervention groups, thereby streamlining the analysis of results.(15)
Interactive Response Technology (IRT)
Computer generated -Interactive Response Technology (IRT):
• Research sites utilize Interactive Web Response Systems (IWRS) and Interactive Voice Response Systems (IVRS) to register patients for clinical trials, assign them randomly, and oversee the distribution of study medications.
• At the core of clinical trials lies interactive response technology (IRT); this software system is essential for patient randomization and the management of the study's supply chain.
• IRT comprises two main components. Firstly, it functions as a patient management system, facilitating the inclusion of patients in the trial through screening and randomization. Secondly, the software plays a crucial role in overseeing the clinical trial supply chain. “Trials require the correct medication at the appropriate location and time, consistently.”
• IRT systems manage both the digital and physical aspects of the supply chain. According to Kole, after a drug or device is produced, it is typically given a serial number for tracking purposes. These serial numbers, together with batch IDs and expiration dates, are uploaded to the IRT.
• When a trial is initiated and begins screening or recruiting participants, the supply can then be dispatched. IRT facilitates the tracking of supplies and alerts supply managers in case of any shortages.(16)
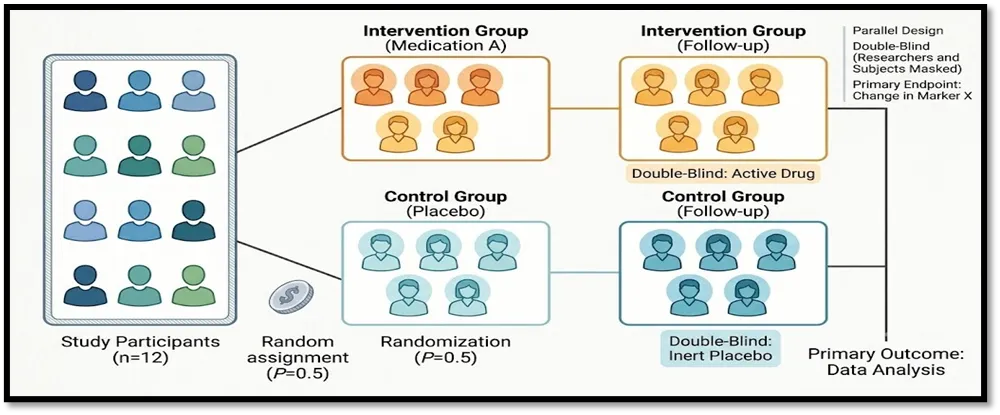
Figure.3: Schematic of a Standardized RCT for Comparing Treatment and Control Arms with Prespecified Analysis Plans
Non-randomized Controlled Trial (nRCT):
In a non-randomized clinical trial, controls are chosen through a method that does not involve randomization. Typically, this study design follows a specific pattern, like choosing subjects and controls on particular days of the week. The predictability of this selection method introduces bias in the choice of subjects and controls, which can cast doubt on the validity of the results obtained.(17)
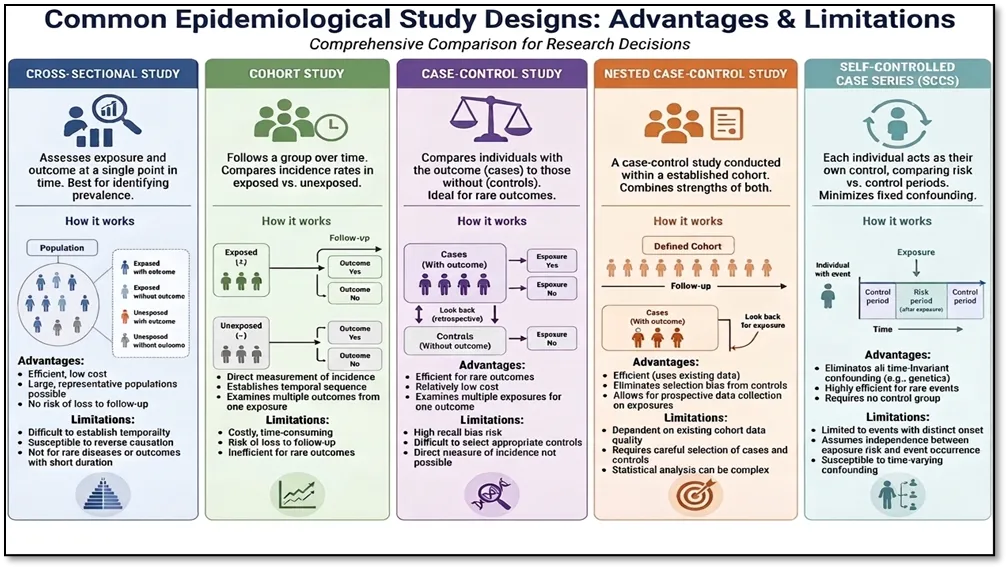
Figure.4 : Overview of Common Epidemiological Study Designs, Methodologies, Advantages, and Limitations.
Bias In Pharmacoepidemiological Research:
Bias refers to systemic inaccuracies in estimating pharmacological effects. It is among the most significant methodological issues in pharmacoepidemiology. In pharmacoepidemiology, biases are a serious problem because they can skew relationships between drug exposures and outcomes and provide false findings.(18)
Key biases associated with Study Population
Confounding:
Confounding occurs when a third variable associated with both exposure and result confuses the link between the two.(19)
Selection bias:
Selection bias arises when inclusion is linked to exposure and outcome, or when the study group does not reflect the intended population.(20)
Information (measurement) bias:
Systematic errors in measuring exposure, outcome, or variables are referred to as information bias.
Time-related bias:
Time-related bias occurs when the exposure, result, eligibility, or follow-up times are not correctly established. In pharmacoepidemiology, these biases are particularly significant because medicine use varies throughout time.(21)
|
Bias Type |
Core Definition |
Case Example Context |
Mitigation Methods |
|
1. Primary Biases Linked to the Study Population |
|||
|
Confounding by Indication |
This occurs when the underlying diagnostic or clinical factors that drive drug usage are likewise linked to the research outcome. |
The underlying ailment for which a medicine is administered has a greater impact on the risk outcome than the drug itself. |
• Alternate study design selection/construction • Matching, Stratification, Restriction • Propensity scores, Multivariable regression • Instrumental variables, G-estimation, MSM |
|
Channeling Bias |
This occurs when equivalent therapies are prescribed to patients with varied risk or prognosis profiles. |
Preferentially prescribing a newer drug over an older one based on perceived safety, effectiveness, or prior drug failure/intolerance. |
• Alternate study design selection/construction • Propensity score methods • Multivariable regression & stratification |
|
Healthy User / Adherer Bias |
Propensity for patients taking preventive therapies (or adhering to them) to engage in other healthy behaviors. |
Patients taking preventive drugs like metformin being more active, eating well, and getting vaccinated, which reduces health risks independently. |
• Alternate study design selection/construction • Negative control outcomes • Multivariable adjustment for lifestyle factors |
|
Protopathic Bias |
Occurs when an early, undiagnosed sign of an outcome triggers the drug prescription, making the drug falsely appear as the cause. |
Initiating insulin for unexplained high glucose caused by undetected early-stage pancreatic cancer. |
• Lag-time approach • Restricting analyses to populations at low risk of protopathic bias |
|
2. Primary Biases Linked to Study Design |
|||
|
Prevalent User Bias |
Distortion arising when time-dependent risk causes early attrition of susceptible individuals, leaving low-risk, long-term users in the study. |
Comparing long-time users of an old drug with new users of a new drug, overestimating the new drug's relative risk due to depletion of susceptibles in the old group. |
• New-user design • Active comparator new-user design
|
|
Immortal Time Bias |
Distortion resulting from misclassifying or excluding follow-up time during which the outcome or death could not occur by design. |
Misclassifying unexposed time between cohort entry and drug initiation as "exposed" time, creating a false protective drug effect. |
• Time-varying exposure technique • Landmark method
• Mantel-Byar approach
|
|
3. Primary Biases Linked to Data Sources |
|||
|
Misclassification Bias |
Errors in classifying study subjects regarding their exposure, outcome, or confounders. |
High nonadherence misclassified as continuous exposure, or differential outcome surveillance due to provider awareness of known side effects. |
• Quantitative / Probabilistic bias analysis • Simple / Bayesian bias analysis • Regression calibration / PS calibration |
|
Missing Data / Loss to Follow-up |
Unavailable information resulting from dropouts, missed visits, or unrecorded data. |
Differential loss to follow-up or database turnover between comparative drug treatment arms. |
• Multiple imputation • Inverse probability weighting (IPW) • Best-case / Worst-case sensitivity analysis |
Table.4 A Taxonomy of Pharmacoepidemiological Biases and Their Methodological Controls
Causal inference in pharmacoepidemiology:
Pharmacoepidemiology relies heavily on causal inference because many studies use observational data rather than randomized treatment allocation to determine the impact of a medicine on a clinical outcome. The primary methodological issue in this context is that patient features, disease severity, comorbidities, contraindications, physician preference, healthcare access, and prior treatment history all have an impact on treatment choices. variances between exposed and unexposed patients may not be due to the drug's effect, but rather to individual variances.(22)
In Modern pharmacoepidemiology uses advanced frameworks such as(23):
|
Method / Framework |
Primary Function |
Key Strengths & Biases Prevented |
Main Limitations / Risks |
|
Directed Acyclic Graphs (DAGs) |
Visually maps causal assumptions among variables |
Guides transparent variable selection; prevents adjusting for mediators or colliders |
Illustrates assumptions only; does not statistically prove causality |
|
Target Trial Emulation |
Emulates a hypothetical RCT protocol using observational data |
avoids temporal ambiguity, common user bias, and everlasting time bias. |
Requires precise timing data around baseline and treatment initiation |
|
Propensity Score Methods |
Balances measured baseline characteristics between treatment groups |
Equalizes comparison groups using matching, weighting (IPTW), or stratification |
Cannot adjust for unmeasured confounding; requires balance diagnostics |
|
Marginal Structural Models (MSMs)/ G-Methods |
accounts for confounders that change over time and are impacted by previous therapy. |
Resolves treatment-confounder feedback loops that bias standard regression |
Technically complex; relies heavily on model specification and positivity |
|
Instrumental Variables (IV) |
Uses external factors (e.g., doctor preference) as proxies for treatment |
Can account for unmeasured confounding when a valid instrument exists |
Assumptions are strong, non-verifiable, and require careful sensitivity analysis |
|
Sensitivity Analyses |
Tests study robustness under alternative assumptions and designs |
Identifies how strongly unmeasured bias or design choices affect findings |
Must be planned prior, does not replace good initial study design |
Table 5: Overview of Causal Inference Methods, Functions, and Analytical Risks
Future directions in pharmacoepidemiology:
AI and machine learning in drug safety
The proliferation of healthcare data has made it possible to improve medication safety surveillance through machine learning and artificial intelligence. In order to identify uncommon adverse medication responses, forecast patient characteristics, and enhance outcome prediction, these technologies make it possible to analyze sizable, complicated datasets. To find drug-drug interactions and maximize medicine utilization, machine learning algorithms—including natural language processing—are being used more frequently. The integration of digital health technologies, such as wearable devices and mobile health apps, enables ongoing data collecting and more real-time monitoring of medication safety and efficacy.(24)
Real-World Data Integration With RCT Evidence: Prospects, Challenges, & Applicability
Pharmacoepidemiology is essential for generating real-world evidence (RWE) to support randomized controlled trials (RCTs). This is particularly true for groups that are underrepresented in clinical trials, like patients with numerous diseases, elderly persons, pregnant women, and people taking many drugs. Combining RCT results with real-world data (RWD), such as electronic health records, claims data, sickness registries, and pharmacovigilance databases, can provide a more complete picture of drug efficacy and safety in normal clinical practice.(25)
RWD has several drawbacks that should be carefully considered. Because routinely collected healthcare data is primarily provided for clinical treatment, payment, or administrative purposes rather than research, data quality may vary among healthcare systems, organizations, and databases.(26)
Furthermore, the setting determines whether RWD-based pharmacoepidemiology is appropriate. Disjointed healthcare data systems, inadequate electronic health records, poor connectivity between prescription, dispensing, laboratory, and outcome data, inconsistent coding accuracy, and inadequate pharmacovigilance infrastructure can all limit pharmacoepidemiologic research in low- and middle-income countries (LMICs).
International cooperation for international research
In pharmacoepidemiology, international cooperation is becoming more and more crucial since it makes it possible to combine data from various populations and healthcare systems. These initiatives assist the creation of standardized data standards, make it easier to investigate uncommon outcomes, and improve the generalizability of findings. This tendency is demonstrated by a number of significant projects, including as the Sentinel Initiative (U.S. FDA), OHDSI (Observational Health Data Sciences and Informatics), DARWIN EU (Data Analysis and Real-World Interrogation Network), and data standards frameworks like open EHR.(27)
The role of regulatory science
Regulatory science is progressively impacting pharmacoepidemiology by guiding the use of RWE in drug approval, post-marketing surveillance, and risk management. Regulatory agencies are establishing new frameworks and standards to integrate pharmacoepidemiologic data into decision-making in order to guarantee that drug safety and efficacy are continuously evaluated throughout the product lifetime.(28)
Real-time pharmacovigilance
Due to advancements in data infrastructure and analytics, real-time pharmacovigilance—which uses continuously updated healthcare data to identify, track, and evaluate adverse drug occurrences more quickly—is becoming feasible.(29) Safety evaluations are accelerated through the integration of digital health technology, claims databases, and electronic health records to allow near real-time signal recognition and risk assessment. Furthermore, the use of existing data models and distributed data networks guarantees data privacy while facilitating scalable pharmacovigilance across various healthcare systems.(30)
REFERENCES

Priti More1*, Vasant Lokhande2, Advances In Pharmacoepidemiology and Drug Safety, Int. J. Sci. R. Tech., 2026, 3 (9), 518-531. https://doi.org/10.5281/zenodo.22958128
 10.5281/zenodo.22958128