

We use cookies to ensure our website works properly and to personalise your experience. Cookies policy
Department of Chemistry, V.S.B. Engineering College, Karur - 639111
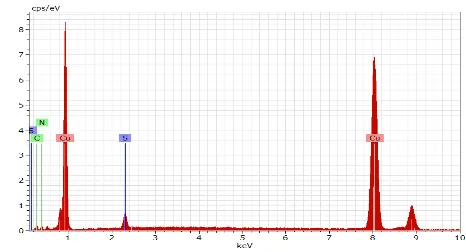
Self assembled monolayers (SAMs) are formed on copper using 5-amino-1,3,4,thiadiazole -2-thiol., under suitable conditions. Corrosion behaviour of copper is studied in neutral medium of 300 ppm aqueous sodium chloride solution using weight loss followed by electrochemical (impedance, potentiodynamic polarization), cyclic voltammetric studies. With the high charger transfer resistance, an efficiency of 82% is observed. The protective film formed on the surface is characterised by water contact angle measurements, FT-IR, SEM/EDX, XPS and AFM studies. Potentiodynamic polarization studies have shown that SAMs control both anodic and cathodic reactions, but cathodic reactions more predominantly and behave as a mixed inhibitor. The surface film formed is found to be stable. The presence of nitrogen and sulphur in the inhibitor molecules on the metal surface due to chemisorption is analysed using EDX.
The corrosion of copper and other metals occur usually when they get exposed to air. Copper is also exclusively used for piping and delivery of water for marine industries, which mainly contains sodium chloride salt. The high concentration of chloride ions severely leads to corrosion of copper. Various strategies have been applied to address the growing need for inhibition of copper corrosion. One of the most efficient approaches for protecting copper against aggressive attack is the formation of ultrathin films using SAMs.
Corrosion inhibition of copper can be achieved by modifying its surface to form self- assembled monolayers using suitable organic inhibitors that mainly contain nitrogen and sulphur atoms which can adhere easily to the metal surface. The strong chemical interaction between sulphur atoms and the metallic surface leads to the formation of chemisorbed organic films. Kondoh et al investigated, alkanethiolate monolayers on Cu (100) and found that sulphur atom in the thiolate occupied the 4-fold hollow site of the unreconstructed Cu (100) surface1. SAMs of organosulphur compounds are expected to function as a barrier to prevent the permeation of corrosion accelerants such as moisture and electrolyzed into the copper substrate, thereby improving the corrosion resistance of copper2-5.
The aim of the present study is to investigate the ability and nature of SAMs of 2-methyl-5-nitroimidazole on copper surface in sodium chloride environment in resisting corrosion using Gravimetry, Impedance, Potentiodynamic polarisation, CV, SEM/ EDX,Water contact angle measurements, AFM and XPS studies.
EXPERIMENTAL PROCEDURE
2.1. Chemical and Method
A 99.99% pure AR grade 2-methyl-5-nitroimidazole chemical is obtained from Sigma-Aldrich. (GR) grade ethanol is used as a solvent for preparing imidazole solution of required concentrations. The electrolyte solution is prepared using triple distilled water and analytical grade of (Merck) sodium chloride.
2.2. Sample preparation and SAM modification
The AR grade sigma-Aldrich make 99.99% pure chemical 5-amino-1,3,4-thiadiazole is used to modify copper surface, in the formation of self-assembled monolayers. According to the literature, very lowest concentration6,7 of the inhibitor substance is effective in modifying the surface and the compound used in organic medium enhances the adsorption of nitrogen and sulphur, well to the metal surface, Hence, 5-amino-1.3,4-thiadiazole-2-thiol in ethanol medium is used and the solution of suitable concentration of 15 ppm 5-amino-1.3,4-thiadiazole-2-thiol is used to modify the metal surface, in forming self-assembled monolayer. The copper specimens8 of 3 × 1.5 cms are used. The metal plates are etched with HNO3 and cleaned to mirror finish using emery sheets of grade 1 to 6 and then degreased with acetone9. The cleaned, degreased specimens are immersed in the inhibitor solution for about 24 hours, in room temperature. The specimens are weighed before and after immersion in the inhibitor solution. The surface modified specimens and pre-treated pure copper specimens are immersed in neutral aqueous medium of concentration of 300ppm sodium chloride for about 3 days and weighed for Gravimetry studies10. The surface protective film formed on the metal surface is visible for naked eye and the film remains the same even in neutral medium. The formation of SAMs is classified in two steps,
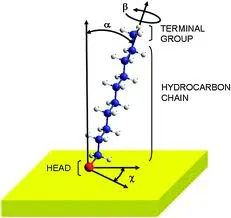
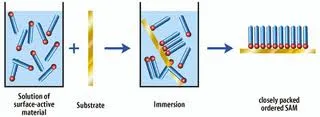
as discussed by Rondelez et al11, the first step is the fast adsorption of molecules on the metal substrate and the second one being the slow re-arrangement of molecules to form a dense monolayer. The aqueous solution for neutral medium is prepared using analytical grade reagent and triple distilled water.
2.3. Electrode Preparation
A copper rod of same 99.99% purity with cross-sectional area of 1cm2 embedded in epoxy resin leaving its square cross-section is used for electrochemical measurements. The copper electrode to be used is cleaned to mirror finish using various grade emery sheets and degreased with acetone. A dense and stable SAMs are formed from an immersion time of 24 hours with a lowest concentration of 10 ppm of 5-amino-1,3,4-thiadiazole-2-thiol inhibitor solution6,7.
RESULTS AND DISCUSSION
As discussed earlier, the formation of Self-Assembled Monolayers on the metal substrate follows a two step process, the first step being a fast adsorption step and the second being the rearrangement step. To obtain densely ordered SAMs, the metal substrate is pre-treated, using HNO3 for a few seconds, then polished to mirror finish using different grades of emery sheets and degreased with acetone at room temperature. As already discussed, ethanol is chosen as the solvent with an immersion time of 24 hrs. The optimum concentration of 5-amino-1,3,4-thiadiazole-2-thiol and the immersion period are confirmed through impedance studies.
3.1. Effect of concentration of thiol film:
As reported in the literature, well ordered dense SAMs are formed with an immersion period of more than 20 hours. The results of the present study show that an immersion period of 24 hours enhances the formation of the protective film. Hence an immersion period of 24 hours is chosen initially and amino thiol films are formed on the copper substrate at various concentrations of 5-amino-1,3,4-thiadiazole-2-thiol from 5 ppm to 20 ppm. Impedance studies carried out in aq. 300 ppm sodium chloride solution after an immersion of 24 hrs in the inhibitor solution & Nyquist plots are shown in figure 1.5. The equivalent circuits that fit best with the impedance plots are shown in figure 1.4. The Rct value for 15 ppm amino thiol concentration is found to be the maximum. Hence, amino thiol of 15 ppm concentration is chosen as the optimum concentration to form SAMs, show maximum inhibition efficiency in protecting the metal surface by preventing diffusion of chloride ions from the solution and the diffusion of Cu+ ions from the metal surface to the solution. The impedance parameters are shown in table 5. The charge transfer resistance value is found to be the maximum as 27.94 KΩ cm2, for inhibitor concentrations of 10 ppm, with much decrease in Cdl value as 0.00066 µF cm2 and ‘n’ value of 0.88, reveal the dense protective film formation on copper surface.
3.1.1. Effect of immersion period:
The corrosion mechanism of the copper electrode modified by SAMs in sodium chloride can be interpreted by the reaction models shown in figure 4 below. In sodium chloride solution, the electrochemical corrosion of copper substrate occurs when both oxygen molecules and chloride ions reach the bare copper surface through the defects within SAMs. As the oxygen concentration in the sodium chloride solution is low and comparatively its diffusion co-efficient is small, the diffusion of oxygen from the bulk solution to the bare copper surface is much lower than diffusion of chloride ions. Therefore, aminothiol SAMs are relatively stable and can strongly protect the copper substrate from corrosion in sodium chloride solution. The increase in Rct value after 1 hour to 4 hours is considerably higher and for 4 to 6 hours immersion, it is considerably less, hence the SAMs formed is found to be stable after 4 hours of immersion in sodium chloride solution.
3.2. Corrosion protection of SAMs film
3.2.1. Analysis of Gravimetric studies
The corrosion rates and the inhibition efficiencies of copper in neutral 300 ppm sodium chloride solution is studied in the presence and absence of inhibitor 5-amino -1,3,4-thiadiazole-2-thiol at various concentrations and the results are shown in table 1.1. & 1.2. It is found that for the inhibitor of 15 ppm concentration, the inhibition efficiency is maximum. The inhibition efficiency have been expressed in mg/dm2/day. The specimens are weighed before immersing it in the inhibitor solution and after the formation of SAMs on the specimen, i.e, after a period of 24 hours immersion, the specimens are taken out, rinsed with ethanol solution, dried and weighed. These weighed samples (after SAMs formation) and polished copper plates are immersed in neutral medium of 300 ppm aq. sodium chloride solution for a period of three days and then rinsed with ethanol, dried and weighed. The inhibition efficiencies of the SAMs covered specimens and polished copper specimens in neutral medium of 300 ppm sodium chloride solution have been calculated using I.E. = (ΔW-ΔW1) × 100 /ΔW, Where ΔW and ΔW1 are the decrease in weights of bare copper plate and SAMs covered copper plate. The inhibition efficiency is found to decrease with increase in inhibitor concentration and SAMs covered copper with 15 ppm inhibitor concentration is found to have the maximum inhibition efficiency. The same is verified with the wt.loss data for a period of 10 days immersion along with inhibitor solution of various concentrations with 300 ppm aqueous sodium chloride solution and the concerned corrosion rates and the inhibition efficiencies are tabulated in table 1.2. It is found that the inhibitor concentration of 15 ppm is found to have the maximum inhibition efficiency of 93.47%.
Table 1.1: Corrosion Rate from Weight Loss Studies for a Period of 3 Days Immersion
| S.No | Concentration (ppm) | C.Rate (mdd) |
IE (%) |
|---|---|---|---|
| 1. | 5 | 0.2398 | 99 |
| 2. | 10 | 0.5050 | 97 |
| 3. | 15 | 0.8617 | 94 |
| 4. | 20 | 0.2514 | 99 |
| 5. | 25 | 1.2121 | 93 |
| 6. | 30 | 1.2531 | 93 |
Table 1.2: Corrosion Rates from Weight Loss Studies for a Period of 10 Days Immersion
| S.No | Conc. (ppm) |
C.Rate (mdd) |
IE (%) |
|---|---|---|---|
| 1. | 5 | 5.6286 | 69 |
| 2. | 10 | 1.1161 | 94 |
| 3. | 15 | 1.4451 | 91 |
| 4. | 20 | 1.3828 | 92 |
| 5. | 25 | 1.3879 | 92 |
| 6. | 30 | 1.1834 | 93 |
The Corrosion rate was calculated using the formula below:
(Loss in wt.(mg))/(Surface areaof specimen (dm2)×period of imm.(days) )
Whereas the surface area in turn is calculated using,
SA (dm2) = 2 [(L x B + B x T + L x T) – 3.142R (R-T)] 0.01,
Where ‘L’ the length, ‘B’ the breadth, ‘T’ the thickness of the copper specimens and ‘R’ the radius of the hole in the specimens respectively.
The results obtained from weight-loss studies are in good agreement with the results obtained from impedance and polarization studies.
3.2.2. Potentiodynamic Polarization Studies
The potentiodynamic polarization curves for bare copper and SAMs covered copper with 5-amino-1,3,4-thiadiazole-2-thiol, for 24 hours immersion in neutral medium of concentration range of 100 – 300 ppm NaCl, for an immersion of half an hour are shown in figure 1.1.b1. The corrosion current densities (Icorr) have been determined from the polarization curves obtained by Tafel extrapolation method. SAMs formed on the surface of the copper act as a non-conductive barrier for the diffusion of corrosive elements like chlorine and oxygen to the cathodic sites. On comparing with bare copper in sodium chloride solution, lower Icorr values are obtained for SAMs covered copper in sodium chloride solution for all concentrations. The results are shown in table 1.3. The corrosion inhibition efficiency of SAMs covered copper is found to be 94.03%. These results are in good agreement with impedance studies and found good correlation with the results obtained from weight loss studies. The corrosion potential (Ecorr) for SAMs covered copper shifted more towards negative side. The corrosion potential for SAMs covered copper is found to be much lower than bare copper, which is shifted more to cathodic side, while the shift in anodic slope is very less. Thus, the SAMs formed act as mixed inhibitor as it controls both cathodic and anodic reactions and since the cathodic reactions to a much larger extent, it is predominantly cathodic. The inhibition efficiencies of SAMs covered copper are in the range of 90- 99 % within the concentration range studied. For e.g., for the inhibitor concentration of 15 ppm, the corrosion potential for bare copper is found to be +3 mV and SAMs covered copper is found to be -25 mV, which is shifted more to cathodic side. The corrosion current densities for bare copper and SAMs covered copper in 300 ppm sodium chloride solution is found to be 125.4 µA and 14.92 µA respectively. The anodic and cathodic tafel slopes for bare copper in 300 ppm sodium chloride is found to be 190.48 mV/decade and 169.92 mV/decade respectively. And for bare copper, it is found to be 192.38 mV/decade and 189.86 mV/decade respectively. This shows that SAMs control both anodic and cathodic reactions, but cathodic reaction to a larger extent. The anodic reaction is given by the dissolution of copper into Cucl and Cucl2- and the dissolution is determined by the rate of diffusion of soluble Cucl2- species.2 The presence of sulphur and nitrogen in the metal surface in SAMs suppress the formation of Cucl or in other words the diffusion of Cucl2- species from the electrode surface into the bulk solution is prevented, thus controlling the anodic reaction which is explained by the deviation in the anodic peak current and the deviation in the cathodic current peak explains the cathodic reduction of cuprous oxide. Thus, there is a huge decrease in corrosion current, which proves that the SAMs formed, inhibit copper from getting corroded, thus forming an anticorrosive layer. Even at the lowest concentration of sodium chloride of 100 ppm, where there is a possibility for pitting corrosion, SAMs formed offer a very high inhibition efficiency of 98% and protected copper from pitting corrosion also. And, the inhibition efficiency have been calculated using the formula,
I.E (%) = (icorr-i1corr) × 100 / icorr ,
Where icorrand i1corr are the corrosion current densities of bare copper specimen and SAMs covered copper specimen respectively and which is found to be 90% as said earlier above.
Table 1.3: Corrosion Parameters Obtained by Potentiodynamic Polarization Studies of Bare and SAMs (at)Covered Copper in Aq. 300 ppm Sodium Chloride Solution at Different Inhibitor Concentrations
| Inhibitor | Ecorr (mV) | Icorr (µA/cm2) | ba (mV/decade) | bc (mV/decade) | IE (%) |
|---|---|---|---|---|---|
| Bare copper | +3 | 125.4 | 192.38 | 189.86 | - |
| AT 5 ppm | -30 | 12.82 | 173.04 | 186.88 | 90 |
| 10 ppm | -34 | 16.15 | 177.30 | 184.09 | 87 |
| 15 ppm | -25 | 14.92 | 190.48 | 169.92 | 88 |
| 20 ppm | -3 | 21.68 | 199.64 | 199.88 | 83 |
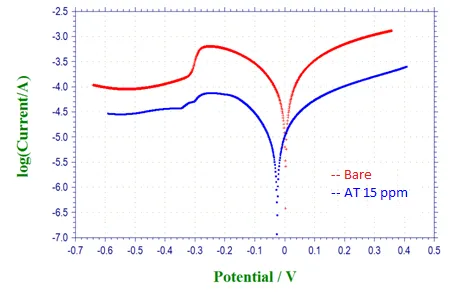
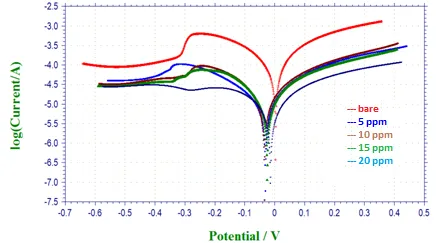
Figure 1.1: A. Fig. 1.1.B.
Figure 1.1: A. & B. Potentiodynamic Polarization Curves of Bare and SAMs (at) Covered Copper in Aq. 300 ppm Sodium Chloride Solution
Table 1.4: Corrosion Parameters Obtained from Potentiodynamic Polarization Studies of Bare and SAMs (at) Covered Copper at Different Immersion Periods in Aq. 300 ppm Chloride.
| Inhibitor | Ecorr(mv) | Icorr(µA/cm2) | ba(mV/decade) | bc(mV/decade) | IE (%) |
|---|---|---|---|---|---|
| Bare1 hr | -101 | 296 | 137.02 | 106.72 | - |
| AT | -11 | 8.136 | 167.73 | 185.15 | 97 |
| B 2 hr | -125 | 309.3 | 139.80 | 149.39 | - |
| AT | -7 | 8.041 | 164.74 | 156.32 | 97 |
| B 4 hr | -127 | 505.7 | 169.09 | 141.14 | - |
| AT | -8 | 8.127 | 162.89 | 150.58 | 98 |
| B 6 hr | -138 | 508.5 | 148.87 | 167.70 | - |
| AT | 77.86 | 159.36 | 248.7 | 85 |
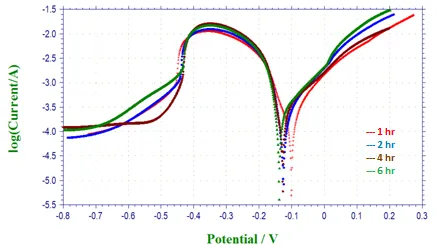
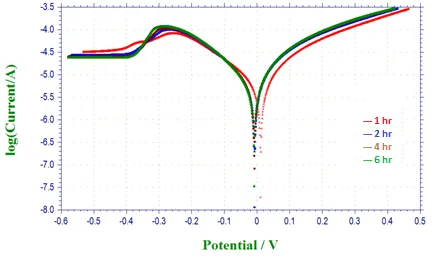
Figure 1.2: A. Fig. 1.2.B.
Figure 1.2: A. & B. Potetiondynamic Polarization Curves at Different Immersion Periods in Aq. 300 ppm Chloride a) Bare Copper B) SAMs (at) Covered Copper
Table 1.5: Corrosion Parameters Obtained from Potentiodynamic Polarization Studies of Bare and SAMs (at) Covered Copper of 5 ppm Inhibitor Concentration in Different Concentrations of Aq. Sodium Chloride Solution
| Inhibitor | Ecorr(mv) | Icorr(µA/cm2) | ba(mV/decade) | bc(mV/decade) | I.E.(%) |
|---|---|---|---|---|---|
| Bare 100ppm | -94 | 418.2 | 187.30 | 171.43 | - |
| AT | -22 | 8.208 | 172.32 | 209.25 | 98 |
| B 150ppm | -105 | 502.5 | 186.15 | 175.44 | - |
| AT | -7 | 3.485 | 160.46 | 175.16 | 99 |
| B 200ppm | -109 | 491.5 | 173.34 | 161.84 | - |
| AT | -6 | 3.332 | 157.70 | 163.26 | 99 |
| B 250 ppm | -138 | 183.3 | 175.31 | 158.77 | - |
| AT | -8 | 3.211 | 154.75 | 152.37 | 98 |
| B 300 ppm | +3 | 125.4 | 192.38 | 189.86 | - |
| AT | -25 | 14.92 | 190.48 | 169.92 | 88 |
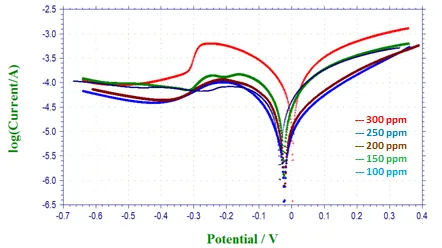
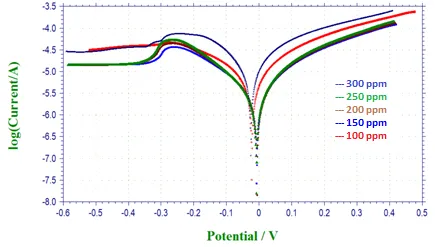
Figure 1.3: A. Fig. 1.3.B.
Figure 1.3: A. & B. Potentiodynamic Polarization Curves in Different Concentrations of Aq. Sodium Chloride Solution a) Bare Copper B) SAMs (at) Covered Copper
3.2.3. Electrochemical Impedence Studies
This is used to characterise the properties of SAM3-7. This study is based on the the measurement of the response to an alternating potential of small amplitude. Nquist plots of bare copper and SAMs covered copper electrodes are obtained in 300 ppm sodium chloride aqueous solution after half an hour equilibration as the open-circuit potentials of the electrodes became steady. Impedance parameters for the bare and SAMs covered copper electrodes are obtained using two different equivalent circuit models8,9 shown below.
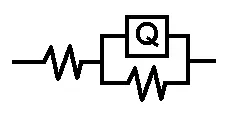

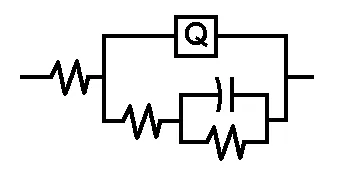
Figure 1.4: A. Fig. 1.4.B.
Figure 1.4: A. & B.
Bode plots also provide the much needed information than the Niquist plots. The phase angle is found to be the maximum for SAMs covered copper than bare copper. The Nquist plots for bare and SAMs covered copper in sodium chloride at different concentrations at a constant immersion period of half an hour, at a temperature of 300C are shown in figures 1.7.a. & b.. The impedance data for bare copper and SAMs covered copper are shown in table 1.4. For e.g.,
The Rct value for bare copper in 300 ppm sodium chloride is 2.56 KΩ cm2, which have increased enormously to 10.75 KΩ cm2 for copper covered with SAMs for the same environment. The CPE value at the copper interface is found to decrease from 0.044 to 0.00262 for bare copper to SAMs covered copper. This is because the water molecules in the electrical double layer are replaced to a very large extent by the organic molecules having a very low dielectric constant10. The value of n have increased from 0.35 to 0.78 for bare copper to SAMs covered copper resulting that the copper surface have become smoother due to the formation of dense, non-porous monolayer of 5-amino-1,3,4-thiadiazole-2-thiol. When the value of n drops to unity slowly, the behaviour of SAMs tend to be an ideal capacitor11.
The changes in the double layer capacitance and interfacial capacitance have been found to be correlated to SAMs formation. In addition, the polarization resistance, which corresponds to the charge transfer resistance of the monolayer increases as the coverage increases. Since the double layer capacitance is larger than the capacitance of SAMs, it will dominate the total capacitance as the SAMs coverage decreases. The high frequency EIS data is modelled with a Randle’s circuit modified with a constant phase element (CPE) in place of the capacitor as shown in Fig 1.4. The very same is observed, with varying immersion hours and with varying sodium chloride concentration, as no difference in Rct value have been observed after 2 and 4 hrs immersion. But after 6 hrs of SAMs formation there exists a considerable difference in Rct value, which might be due to the slight diffusion of chloride ions through the defective sites. The impedance of CPE depends on the frequency via the equation,
ZCPE = 1/C (jω)n
Where, C- the capacitance.
The studies of Nahir and Bowden12 have shown that electrons can penetrate SAMs even though they are defect free and more-over SAMs are found to contain molecule seized defects13-16. Zamborini and Crooks13 have proposed a corrosion reaction model for the electrode covered by SAMs with defects. In this model, the corrosive ions, such as halide ions, can penetrate through SAMs through defects and react with metal substrate, giving rise to the expansion of the defective sites and leading to further destruction of SAMs. But hydrocarbons containing nitrogen and sulphur within the SAMs can partially heal the defects. Hence, in such case, 5-amino-1,3,4-thiadiazole-2-thiol {C2H4N3S2} containing two nitrogen and two sulphur atoms, which bond tightly to the metal surface thus forming a very thick monolayer that prevents the diffusion of corroding chemicals and ions and offers a great protection for copper being corroded. And the inhibition efficiency is calculated using the formula,
I.E. = (R1t - Rt ) × 100 / R1t
Where, Rt the resistance of bare copper and R1t the resistance of SAMs covered copper. And the results found a very good correlation with polarization and weight-loss studies.
Thus, all the observations in the impedance studies indicate that there is the formation of non-porous, highly protective film (SAMs) on the metal surface, which effectively protect the metal from corrosion even in aggressive environment like sodium chloride and even in its lowest concentration, where there can be a possibility of pitting corrosion.
Table 1.6: Impedance Parameters of Bare and SAMs (at) Covered Copper in Aq. 300 ppm Sodium Chloride Solution at Different Inhibitor Concentrations
| Conc. (ppm) | Rct (KΩ cm2) | Cdl (µF cm2) | n | IE (%) |
|---|---|---|---|---|
| Bare copper | 2.56 | 0.044 | 0.35 | - |
| 5 | 1.74 | 0.0969 | 0.31 | - |
| 10 | 3.89 | 0.0198 | 0.29 | 34 |
| 15 | 10.75 | 0.00262 | 0.78 | 82 |
| 20 | 7.9 | 0.0049 | 0.59 | 68 |
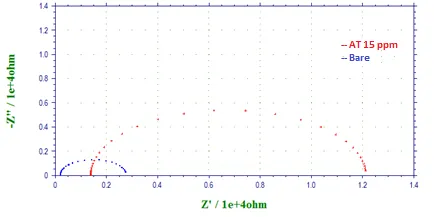
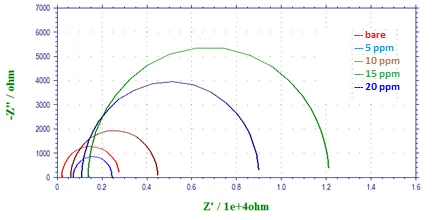
Figure 1.5: A. Fig. 1.5.B.
Figure 1.5: A. & B. Niquist Plots of Bare and SAMs (at) Covered Copper in Aq. 300 ppm Sodium Chloride Solution
Table 1.7: Impedance Parameters of Bare and SAMs (at) Covered Copper at Different Immersion Periods in Aq. 300 ppm Chloride
| Conc. (ppm) | Rct (KΩ cm2) | Cdl (µF cm2) | n | IE (%) |
|---|---|---|---|---|
| Bare 1 hr | 1.36 | 0.166 | 0.25 | - |
| AT | 1.9 | 0.0793 | 0.93 | 30 |
| B 2 hr | 0.222 | 6.264 | 0.15 | - |
| AT | 1.17 | 0.103 | 0.81 | 87 |
| B 4 hr | 0.198 | 7.804 | 0.15 | - |
| AT | 1.626 | 0.1134 | 0.82 | 88 |
| B 6 hr | 0.154 | 12.867 | 0.12 | - |
| AT | 2.367 | 0.0488 | 0.92 | 93 |
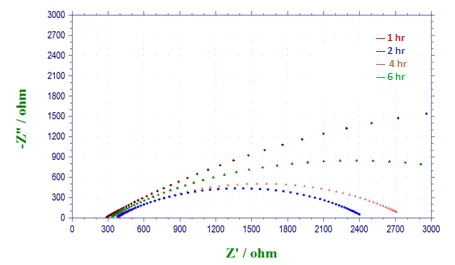
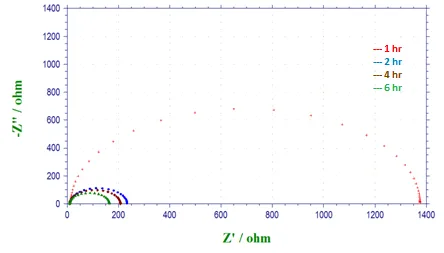
Figure 1.6: A. Fig. 1.6.B.
Figure 1.6: A. & B. Nyquist Plots at Different Immersion Periods in Aq. 300 ppm Chloride a) Bare Copper B) SAMs (at) Covered Copper
Table 1.8: Impedance Parameters of Bare and SAMs (at) Covered Copper of 15 ppm Inhibitor Concentration in Different Concentrations of Aq. Sodium Chloride Solution
| Conc. (ppm) | Rct (KΩ cm2) | Cdl (µF cm2) | n | IE (%) |
|---|---|---|---|---|
| Bare 100 | 0.843 | 0.4183 | 0.20 | - |
| AT | 0.979 | 0.3152 | 0.11 | 14 |
| B 150 | 0.728 | 0.5496 | 0.19 | - |
| AT | 7.003 | 0.00632 | 0.86 | 90 |
| B 200 | 0.680 | 0.6423 | 0.18 | - |
| AT | 6.762 | 0.00667 | 0.87 | 90 |
| B 250 | 0.375 | 2.050 | 0.16 | - |
| AT | 6.659 | 0.00691 | 0.92 | 94 |
| B 300 | 2.56 | 0.044 | 0.35 | - |
| AT | 10.75 | 0.00262 | 0.78 | 82 |
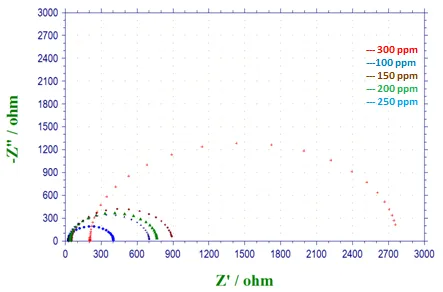
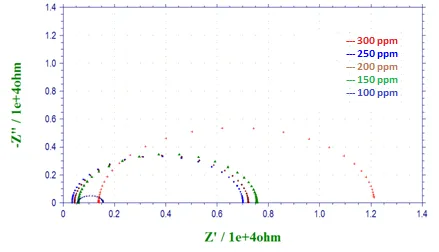
Figure 1.7: A. Fig. 1.7.B.
Figure 1.7: A. & B. Nyquist in Different Concentrations of Aq. Sodium Chloride Solution a) Bare Copper B) SAMs Covered Copper
These results are also in good agreement with the results obtained in the literature for different SAMs on copper17,18.
3.2.4. CV (Cyclic Voltammogram) studies
The cyclic voltammograms of bare and SAMs covered copper for 2 cycles at sweep rate of 100 mV/s are shown below. For bare copper there exists two oxidation peaks at 0.140 V and 0.180 V in the forward scan, first due to the formation of CuCl and the second due to the formation of soluble CuCl2- complex and a large reduction peak at -430 V in the reverse scan, which is due to the reduction of CuCl2-. The SAMs covered copper exhibit no oxidation peak and one reduction peak at -0.22 V in the reverse scan. Compared with bare copper, the anodic and cathodic peak currents of SAMs covered copper have decreased to the maximum from 4.6 × 10⁻³ A to 1.18 × 10⁻⁴ A for anodic, with a very slight change to 1.0 × 10⁻⁴ A after 15 cycles and from -4.8 × 10⁻³ A to -0.4 × 10⁻⁴ A, which have a very slight change to -0.42 × 10⁻⁴ A even after 15cycles, which is not very significant and the oxidation of Cu (0) to Cu (I) have inhibited strongly due to the formation of thiol film on the surface. These results infer the stability of thiol film on the copper surface, which provide the evidence for the protection of copper in corrosive sodium chloride environment.
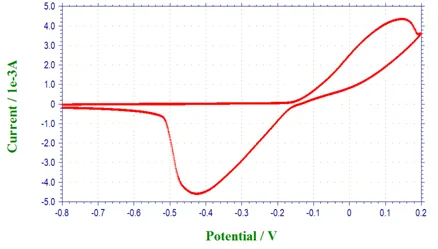
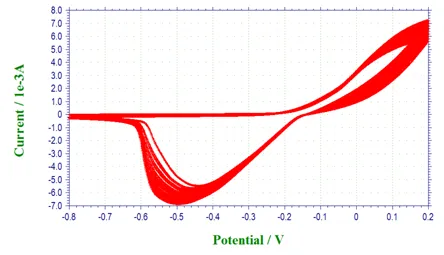
Figure 1.8: A. Fig. 1.8.B.
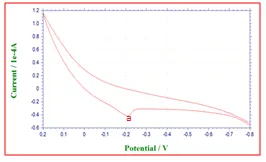
Figure 1.8: A. & B. CV for Bare Copper in Aq. 300 ppm Sodium Chloride at a Sweep Rate of a) 100 mv/S/Cycle B) 100 mv/S for 15 Cycles
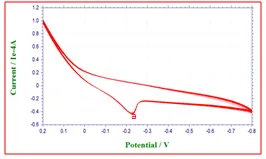
Figure 1.9: A. Fig. 1.9.B.
Figure 1.9: A. Cyclic Voltammograms of SAMs Covered Copper in Aq. 300 ppm Sodium Chloride Solution at a Sweep Rate of a)100 mv/S/Cycle B) 100 mv/S for 15 Cycles
3.2.5. FT-IR (Fourier Transform Infra Red Spectroscopy) studies
FT-IR spectra for pure thiol and SAMs covered copper are shown below. It shows the appearance of peak at1457cm-1, which corresponds to C = N, stretching respectively and C – S stretching at 796 cm-1.8,17 These peaks infer the presence of SAMs of 5-amino-1,3,4-thiadiazole-2-thiol on copper surface. The lowering of C = N stretching from 1600 cm-1 to 1457 cm-1 19 refer to the formation of complex between SAMs and copper surface through nitrogen atom. These peaks identified are found to be similar with the peaks of pure thiol which appeared at 1475 cm-1, 1609 cm-1 for C = N and C = C respectively. For bare copper, there appear at 445 cm-1 and at 489.5 cm-1, which is assigned to cuprous oxide formed on the surface of the copper metal (Yoshida and Ishida, 1995). Thus, the shift towards lower frequency range shows the adsorption of nitrogen, which prevents the attack of corrosive elements mainly like oxygen, and shows a very clear evidence for the presence of aliphatic hydrocarbon chain through SAMs formation, whereas for bare and corroded copper, the IR frequency range shifts towards the high frequency range, which proves that the copper metal gets corroded without the presence of nitrogen and sulphur which lead to the formation of SAMs and offer a very high inhibiting efficiency.
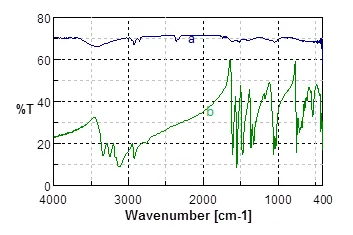
Figure 1.10:
3
FT-IR spectra of a) SAMs (AT) covered copper b) pure thiol
3.2.6. SEM (Scanning Electron Microscope) studies
SEM studies of polished bare and SAMs covered copper are studied in 300 ppm of neutral medium for three days. The SAMs covered copper plate after an immersion of 24 hours in the inhibitor solution in ethanol is immersed in 300 ppm sodium chloride solution for three days and pictures of SEM analysis in Fig.1.11.a. have showed that most of the area of the bare copper have been corroded due to the adsorption of chloride ions and the surface appears very rough due to the uneven formation of the corrosion products and in Fig 1.11.c., the SAMs coated copper plate has a smooth uniform coverage of 5-amino-1,3,4-thiadiazole-2-thiol molecule of 15 ppm concentration, without having any defective site and thus preventing the adsorption of chloride ions and inhibited corrosion with a very high inhibition efficiency. The figure of the SAMs covered copper plates differ from pure polished surface (with some defective sites) by forming a smooth uniform monolayer throughout.
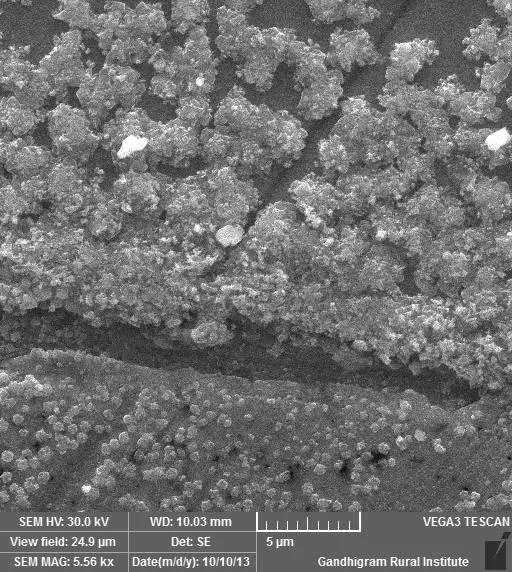
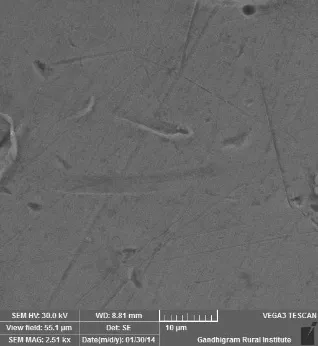
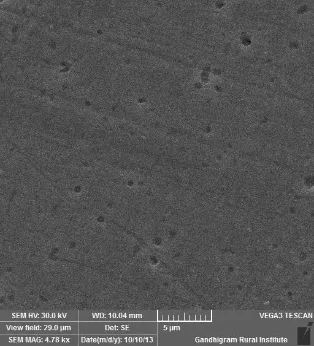
Figure 1.11: A. Fig. 1.11. B. Fig. 1.11. C.
Figure 1.11: A. & B. SEM Images of Copper and SAMs (at) Covered Copper in 300 ppm Sodium Chloride Solution C. SEM Image of Pure Copper
3.2.7. EDX (Energy Dispersve X-ray analysis) studies
The figures below in 1.12.a, b, c, d show the surface morphology for the elemental identification of bare and SAMs covered copper in aqueous 300 ppm have been studied through EDX studies and it clearly shows the presence of chloride in bare copper specimen and the adsorption of nitrogen, sulphur, in SAMs coated copper specimen, which cover the whole surface forming a uniform protective layer and the absence of corroding elements like chlorine & oxygen prove the dense formation of monolayer offer a very higher inhibition efficiency, which prevented the diffusion of corroding elements and isolated copper from corroding environment.
[Figure - see the formatted PDF]
Figure 1.12: A. Fig. 1.12.B.
a) EDXanalysis of SAMs (AT) covered copper in 300 ppm sodium chloride solution b) EDX analysis of pure copper
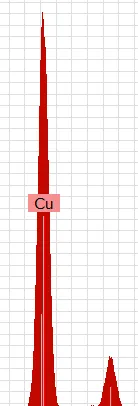


Figure 1.12: C. a Magnified View of the Adsorption Peaks (S, N) of SAMs (at) on Copper Surface
[Figure - see the formatted PDF]
Figure 1.12: D. EDX Analysis of Pure Copper in 300 ppm Sodium Chloride Solution
3.2.8. AFM (Atomic Force Microscopy) studies
Atomic force microscopy (AFM) or scanning force microscopy (SFM) is considered to be one of the most powerful methods to investigate surface morphology of SAMs on copper surface. . It is a powerful technique to investigate the surface morphology at nano- to micro-scale20. The topography of the surfaces recorded in 2D and 3D images are examined and surface roughness, root-mean-square roughness (Rms), mean roughness factor (Ra) are determined from the respective images. Table 1.9 shows various AFM parameters obtained for SAMs covered copper surface. Figures 1.13. show the AFM images and cross section analysis of polished copper surface, with an Ra value of 0.9504µm, Rms value of 1.404µm and indicated the absence of SAMs. A severely corroded surface morphology (Figures 1.15.) is observed after immersion in 300 ppm aqueous sodium chloride solution, with an increased Ra value of 2.435µm, Rms value of 2.463 µm indicate the adsorption of chloride ions and the formation of corrosion products. The root-mean-square (RMS) roughness is found to be 2.463µm, which clearly indicate the roughness of the corroded surface. The microstructure of the surface shows several smaller and larger corrosion product deposits. Figures 1.14. showed the AFM images and cross section analysis of SAMs covered copper surface. The decrease in roughness of the SAMs covered copper surface shows the dense, uniform adsorption of thiol on the metal surface.
Table 1.9: AFM Parameters
| Environment | Ra (µm) | Rms (µm) | |
|---|---|---|---|
| Polished Cu metal | 0.9504 | 1.404 | |
| Polished Cu metal in 300 ppm Cl- | 2.435 | 2.463 | |
| SAM covered metal surface | 1.425 | 1.881 | |
The decrease in RMS roughness from 2.463µm from bare to 1.881µm for SAMs covered copper clearly infer the greater smoothness and homogeneity of the surface film produced by the inhibitor and the absence of any corrosion product deposits, which offer a protective layer thereby, forming a barrier against the attack of aggressive ions from the corrosive environment.
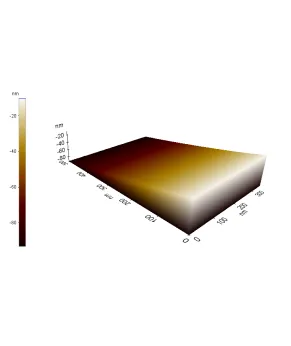
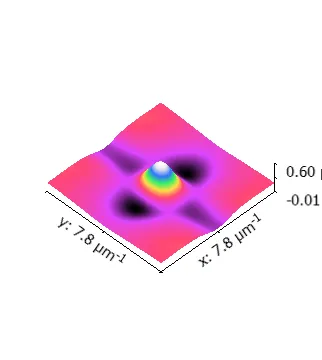
Figure 1.13: A. Fig.1.13.B.
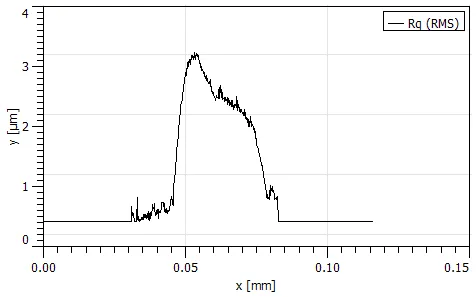
Figure 1.13: C
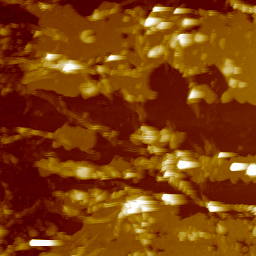
Figure 1.13: A,B,C Refer to the AFM Images and Cross Section Analysis of Polished Copper.
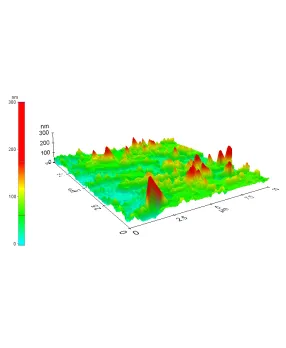
Figure 1.14: A. Fig. 1.14.B.
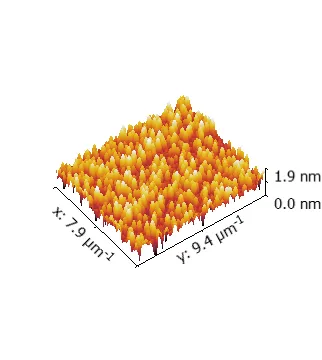
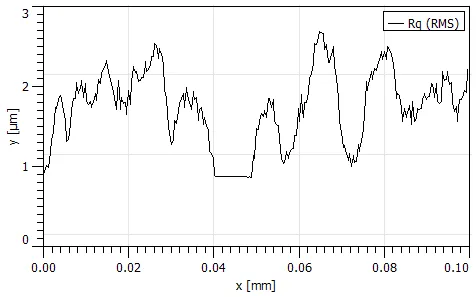
Figure 1.14: C. Fig. 1.14.D
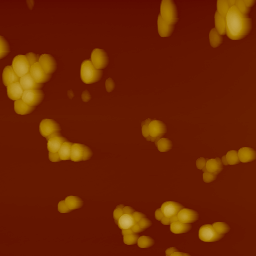
Figure 1.14: A,B,C,D Refer to the AFM Images and Cross Section Analysis of SAMs (at) Covered Copper Specimen
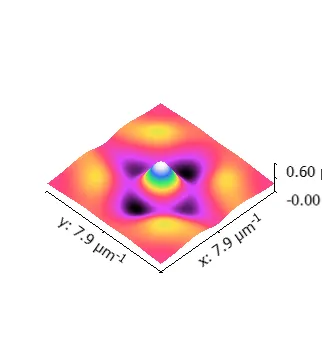
Figure 1.15: A. Fig. 1.15.B.
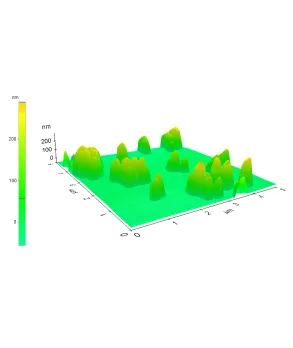
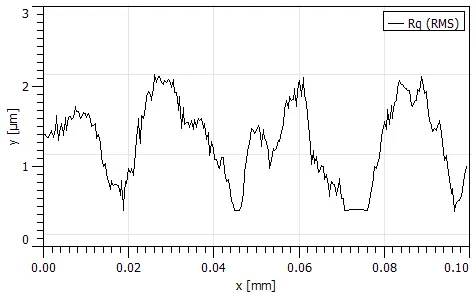
Figure 1.15: C. Fig. 1.15.D.
Figure 1.15: A,B,C,D Refer to the AFM Images and Cross Section Analysis of Polished Copper in 300 ppm Sodium Chloride Solution
3.2.9. Contact angle measurements
Fig. 1.16.a and b show the images of sessile water drop on SAMs covered copper and bare copper surfaces respectively, which prove the hydrophobicity of SAMs covered copper due to the strong adsorption of nitrogen and sulphur on the copper substrate over bare copper by preventing the diffusion of corroding ions in protecting the copper substrate from corrosion. The contact angles are found to be 116.70 and 76.00 respectively for SAMs covered and bare copper, in which the non-polar interaction between the alkyl chains of the molecules due to van der waals’ forces are responsible for protective quality of the SAMs film. The hydrophobicity of the film formed is found to be a little higher with the hydrophobic film of 5-methyl-1,3,4-thiadiazole-2-thiol which offer a very high inhibition efficiency.
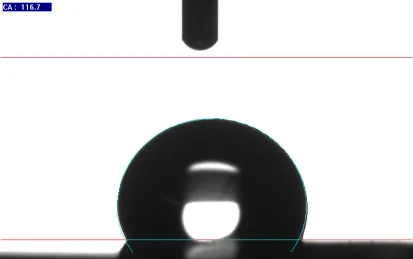
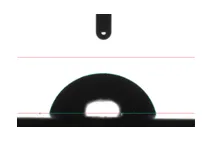
Figure 1.16: A. & B. Contact Angle Images of SAMs (at) Covered and Bare Copper
3.2.10. XPS (X-ray Photo electron Spectroscopy) studies
The peaks due to Cu 2p, C 1s and O 1s electrons are detected in the XPS survey spectrum of bare copper and the corresponding computer deconvoluted spectra are shown in Fig.1.18.a-c. respectively. The Cu 2p3/2 at a binding energy of 932.5 eV can be attributed to Cu (I) and the binding energy at 286 eV correspons to C 1s electron. The O 1s peak at 533 eV can be due to the formation of Cu2O at the initital stages. The XPS survey spectrum of bare copper after the immersion in 300 ppm sodium chloride solution for a period of three days are shown in Fig. 1.19.a. Cu 2p3/2, Cu 2p1/2 and O ls peaks are detected along with the peak of Cl 2p at 200.2 eV. The peaks due to copper and oxygen are similar to those of the peaks obtained for bare copper, which shows the presence of Cu (II) species and the presence of Cl 2p peak of bare copper in Nacl might be due to the formation of Cucl2 on copper surface and the corresponding deconvolution spectra have been shown in Fig. 1.19.b – 1.19.d. The XPS survey spectrum of copper covered with SAMs show peaks due to Cu 2p, O 1s, C 1s, N 1s and S 2s and the corresponding computer deconvoluted spectra are shown in Fig. 1.17.a -1.17.g.. The Cu 2p3/2 peak at 937.5 eV shows the presence of cuprous copper and C 1s peak at 289.5 eV is due to the presence of carbon atoms in the alkyl chain of amino thiol. The O 1s peak at 536 eV might be due to the oxidation of copper while SAMs formation. The N 1s peak at 401.5 eV shows the presence of nitrogen in the third position in thiol molecule, which can be explained as nitrogen in the third position can donate the electron pair easily to form a bond with copper. Therefore, the electron density on this nitrogen is reduced and and the binding energy is shifted to a higher value of 401.5 eV from 398 eV21and the 2s peak for sulphur appears at 221.4 eV and the Cu LMM peak at 575 eV show the line of Auger electron. Thus the shift in the elemental binding energies of N 1s and S 2p revealed that both nitrogen and sulphur atoms present in amino thiol were involved in the complex formation by chelation with copper through cuprous ions.
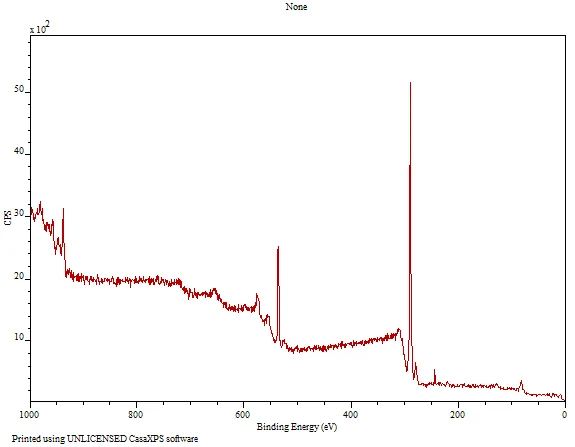
Figure 1.17: A.
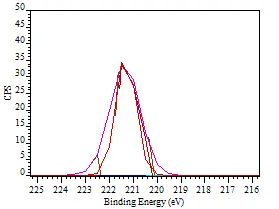
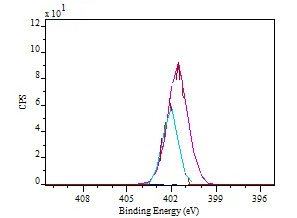
Figure 1.17: B. Fig. 1.17.C.
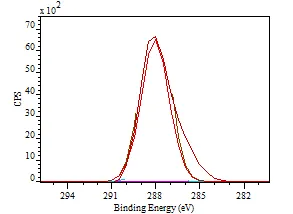
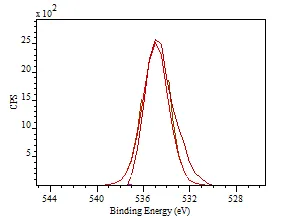
Figure 1.17: D. Fig. 1.17.E.
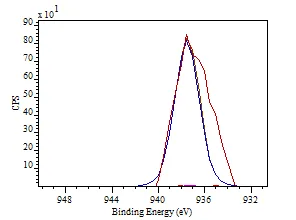
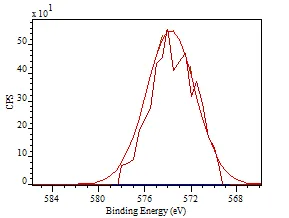
Figure 1.17: F. Fig. 1.17.G.
Figure 1.17: A,B,C,D,E,F,G Represents the XPS Survey Spectrum and Computer Deconvoluted Spectra of S 2P, N 1S, C 1S, O 1S, Cu 2P, Auger Line of SAMs Covered Copper.
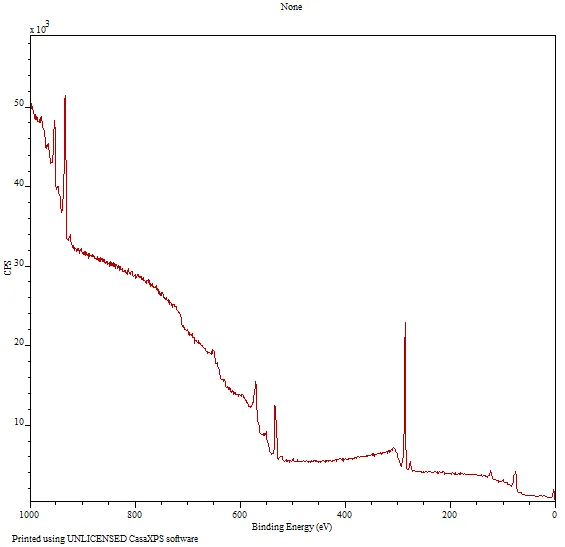
Figure 1.18: A.
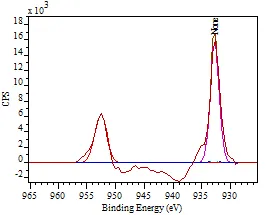
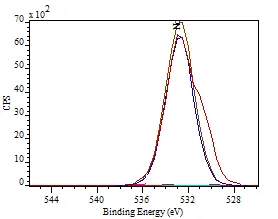
Figure 1.18: B. Fig. 1.18.C.
Figure 1.18: A,B,C Represents the XPS Survey Spectrum and Computer Deconvoluted Spectra of O 1S, Cu 2P of Polished Copper.
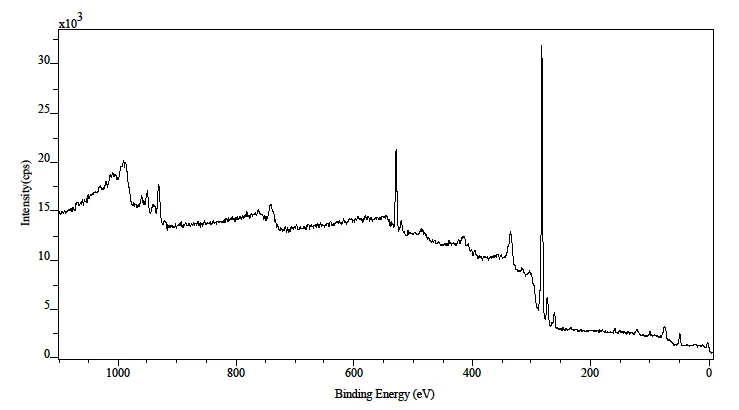
Figure 1.19: A.
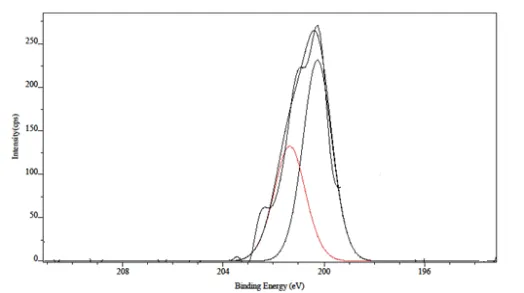
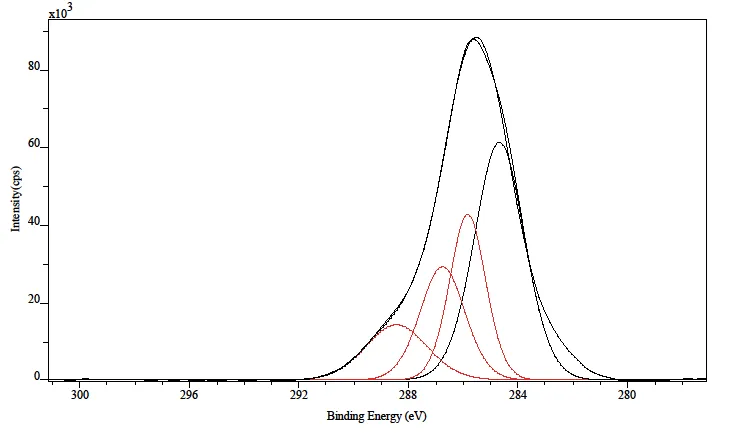
Figure 1.19: B. Fig. 1.19.C.
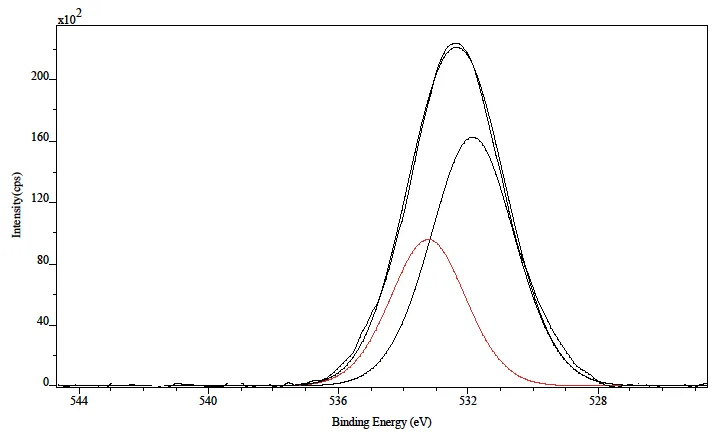
Figure 1.19: D.
Figure 1.19: A,B,C,D Represents the XPS Survey Spectrum and Computer Deconvoluted Spectra of Cl 2P, C 1S, O 1S of Copper in 300 ppm Aq.Sodium Chloride.
3.3. Mechanism
It is known that the corrosion process of copper in aerated sodium chloride solution comprised the anodic dissolution of copper and cathodic reduction of oxygen22-24. The anodic dissolution of copper is shown as,
Cu + Cl- à CuCl + e-
CuCl + Cl- à CuCl2-
And the cathodic reduction of oxygen is given by,
O2 + 4e- + H2O à 4OH-
The mechanism involved the formation of a non-porous, dense, protective film on copper surface. Relatively higher contact angle value (116.70) of thiol film than bare copper of 76.00 revealed the hydrophobic nature, which is due to the orientation of alkyl chain. All these results indicated the formation of a dense and defect free film on copper surface, which is highly protective in nature.
CONCLUSION
Therefore it can be concluded that under these optimum conditions, i) polishing to mirror finish using 1-6 emery grade sheets, ii) degreasing with acetone, iii) ethanol solvent, iv) 15ppm thiol solution, v) 24 hours immersion, the formation of self-assembled monolayers on copper surface occur using 5-amino-1,3,4-thiadiazole-2-thiol and it offers excellent corrosion protection to copper in sodium chloride environment. And the SAMs molecules get chemisorbed on the copper metal surface and form complex through the chelation of nitrogen and sulphur atom. The inhibition efficiencies obtained from Polarization, Impedance and Weight-loss studies, offer a very good correlation with each other and the CV results, the stability of SAMs. Hence the protective monolayer formed on the copper surface played a very vital role in corrosion inhibition of copper.
REFERENCES

Dr. A. Rajalakshmi Devi, Corrosion Protection of Copper in Neutral Media Using 5-Amino-1,3,4-Thiadiazole-2-Thiol SAMs, Int. J. Sci. R. Tech., 2026, 3 (11), 745-763. https://doi.org/10.5281/zenodo.24278612
 10.5281/zenodo.24278612