

We use cookies to ensure our website works properly and to personalise your experience. Cookies policy
Department of Chemistry, V.S.B. Engineering College, Karur – 639 111.
Self assembled monolayers (SAMs) are formed on copper using Thiols, Imidazoles and Aminoacids under suitable conditions. Corrosion behaviour of copper is studied in neutral medium of 300 ppm aqueous sodium chloride solution using weight loss followed by electrochemical (impedance, potentiodynamic polarization), cyclic voltammetric studies. With the high charger transfer resistance, an efficiency of 94-99% is observed. The protective film formed on the surface is characterised by water contact angle measurements, FT-IR, SEM/EDX, XPS and AFM studies.. The surface film formed is found to be stable. The presence of nitrogen and sulphur in the inhibitor molecules on the metal surface due to chemisorption is analysed using EDX.
The corrosion of copper and other metals occur usually when they get exposed to air. Copper is also exclusively used for piping and delivery of water for marine industries, which mainly contains sodium chloride salt. The high concentration of chloride ions severely leads to corrosion of copper. Various strategies have been applied to address the growing need for inhibition of copper corrosion. One of the most efficient approaches for protecting copper against aggressive attack is the formation of ultrathin films using SAMs.
Corrosion inhibition of copper can be achieved by modifying its surface to form self- assembled monolayers using suitable organic inhibitors that mainly contain nitrogen and sulphur atoms which can adhere easily to the metal surface. The strong chemical interaction between sulphur atoms and the metallic surface leads to the formation of chemisorbed organic films. Kondoh et al investigated, alkanethiolate monolayers on Cu (100) and found that sulphur atom in the thiolate occupied the 4-fold hollow site of the unreconstructed Cu (100) surface [1]. SAMs of organosulphur compounds are expected to function as a barrier to prevent the permeation of corrosion accelerants such as moisture and electrolyzed into the copper substrate, thereby improving the corrosion resistance of copper [2-5].
In this paper we had compared the surface characterisation studies in the formation of self-assembled monolayers on copper (using thiols, imidazoles and aminoacids) and observed that, the presence of Carbon, Nitrogen, Hydrogen, Sulphur peaks in the Self-assembled Monolayers on Copper substrate offer highest inhibition efficiency in corrosion protection. And the variation in the efficiency of protection is due to the adsorption peaks at various energy levels has thus been proved with the following findings.
1.1Atomic Force Microscopic studies (AFM)
Atomic force microscopy (AFM) or scanning force microscopy (SFM) is a very high resolution type of scanning probe and it is considered to be one of the most powerful methods to investigate surface morphology of SAMs on copper surface. It is a powerful technique to investigate the surface morphology at nano- to micro-scale [6]. The topography of the surfaces recorded in 2D and 3D images are examined and surface roughness, root-mean-square roughness (Rms), mean roughness factor (Ra) are determined from the respective images. Table 1.1 shows various AFM parameters obtained for SAMs covered copper surface. Fig. 1.1. show the AFM images and cross section analysis of polished metal surface, with an Ra value of 0.9504 µm, Rms value of 1.404 µm indicate the absence of SAMs. A severely corroded surface morphology (Fig. 1.1.) is observed after immersion in 300 ppm aqueous sodium chloride solution, with an increased Ra value of 2.435 µm, Rms value of 2.463 µm indicate the adsorption of chloride ions and the formation of corrosion products. The root-mean-square (RMS) roughness is found to be 2.463 µm, which clearly indicates the roughness of the corroded surface. The microstructure of the surface shows several smaller and larger corrosion product deposits. Whereas Fig. 1.1. to 1.3. indicate the decrease in roughness of the SAMs covered copper surface which shows the dense, uniform adsorption of thiol on the metal surface.
Table 1.1: AFM Parameters
| Environment | Ra (µm) | Rms (µm) |
|---|---|---|
| Polished Cu metal | 0.9504 | 1.404 |
| Polished Cu metal in 300 ppm Cl- | 2.435 | 2.463 |
| SAMs covered metal surface Thiols MT AT TT Imidazoles MNI 2-M Mm HDI Amino-acids ACDA CC |
2.106 1.425 1.741 1.480 1.429 1.129 1.567 1.834 1.005 |
2.279 1.881 2.078 1.498 1.886 1.744 1.973 2.133 1.512 |
The decrease in RMS roughness from 2.463 µm from bare to 2.279 µm,1.881 µm ,2.078 µm
1.498 µm ,1.886 µm, 1.744 µm , 1.973 µm and 2.133 µm, 1.512 µm for SAMs covered copper clearly infer the greater smoothness and homogeneity of the surface film produced by the inhibitor and the absence of any corrosion product deposits, which offer a protective layer thereby, forming a barrier against the attack of aggressive ions from the corrosive environment.
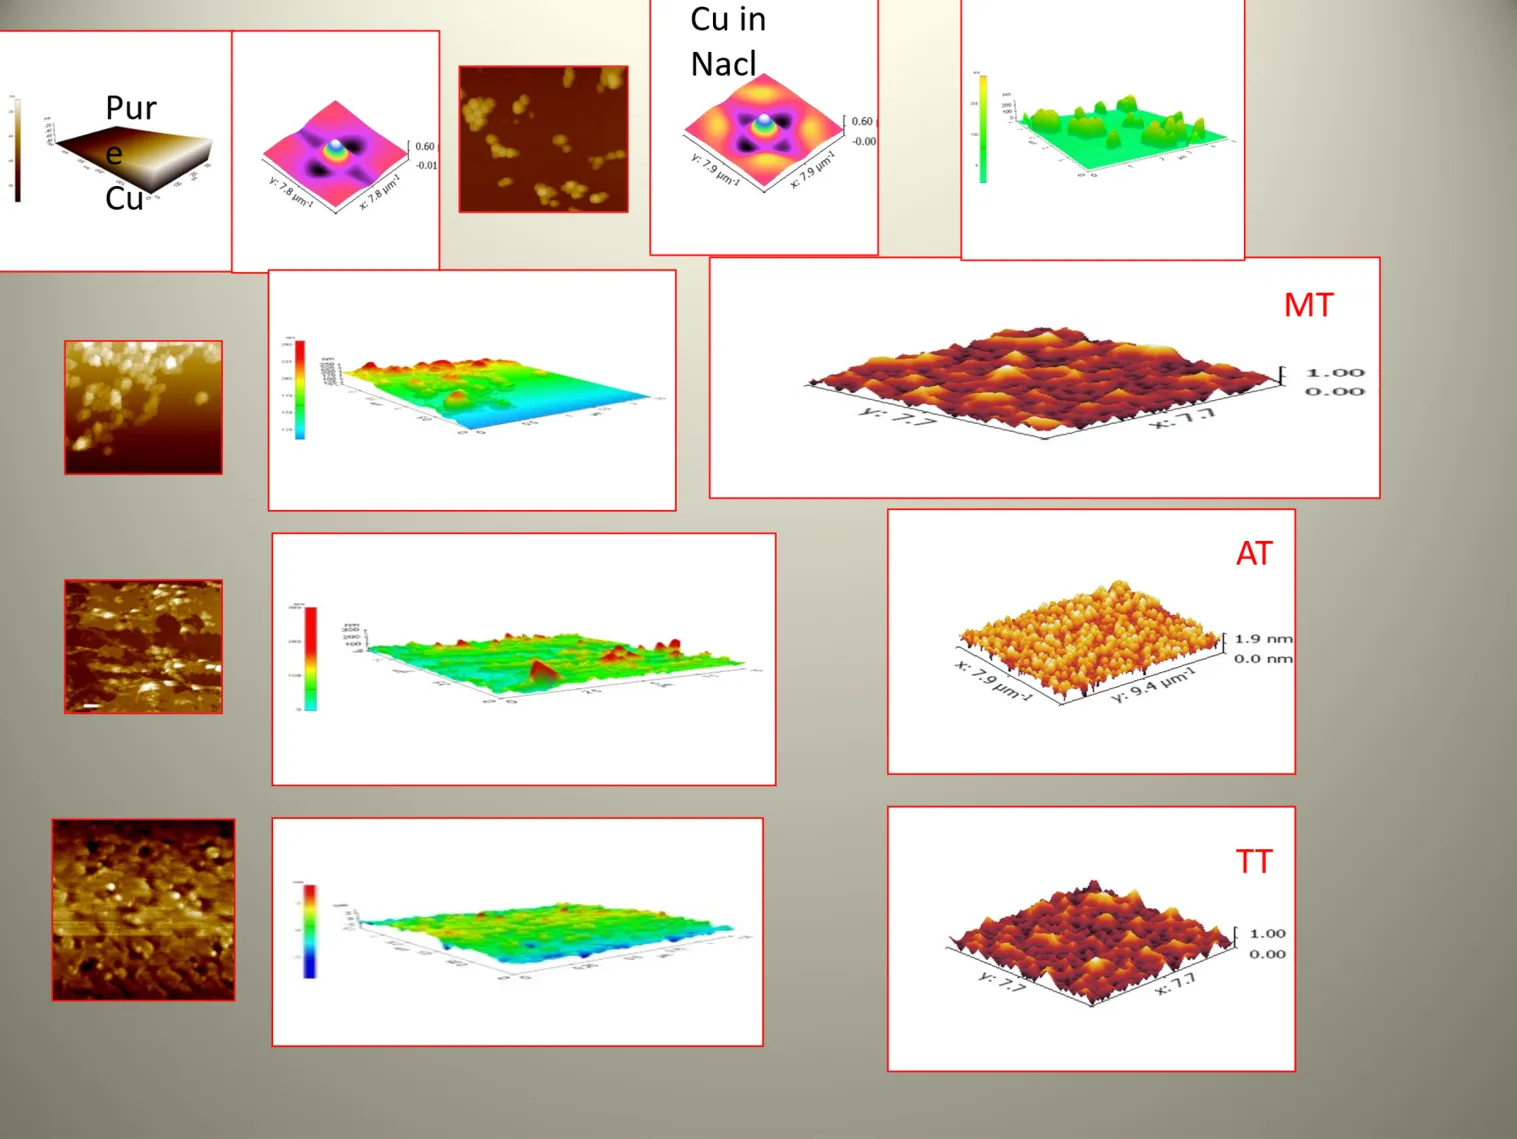
Figure 1.1:
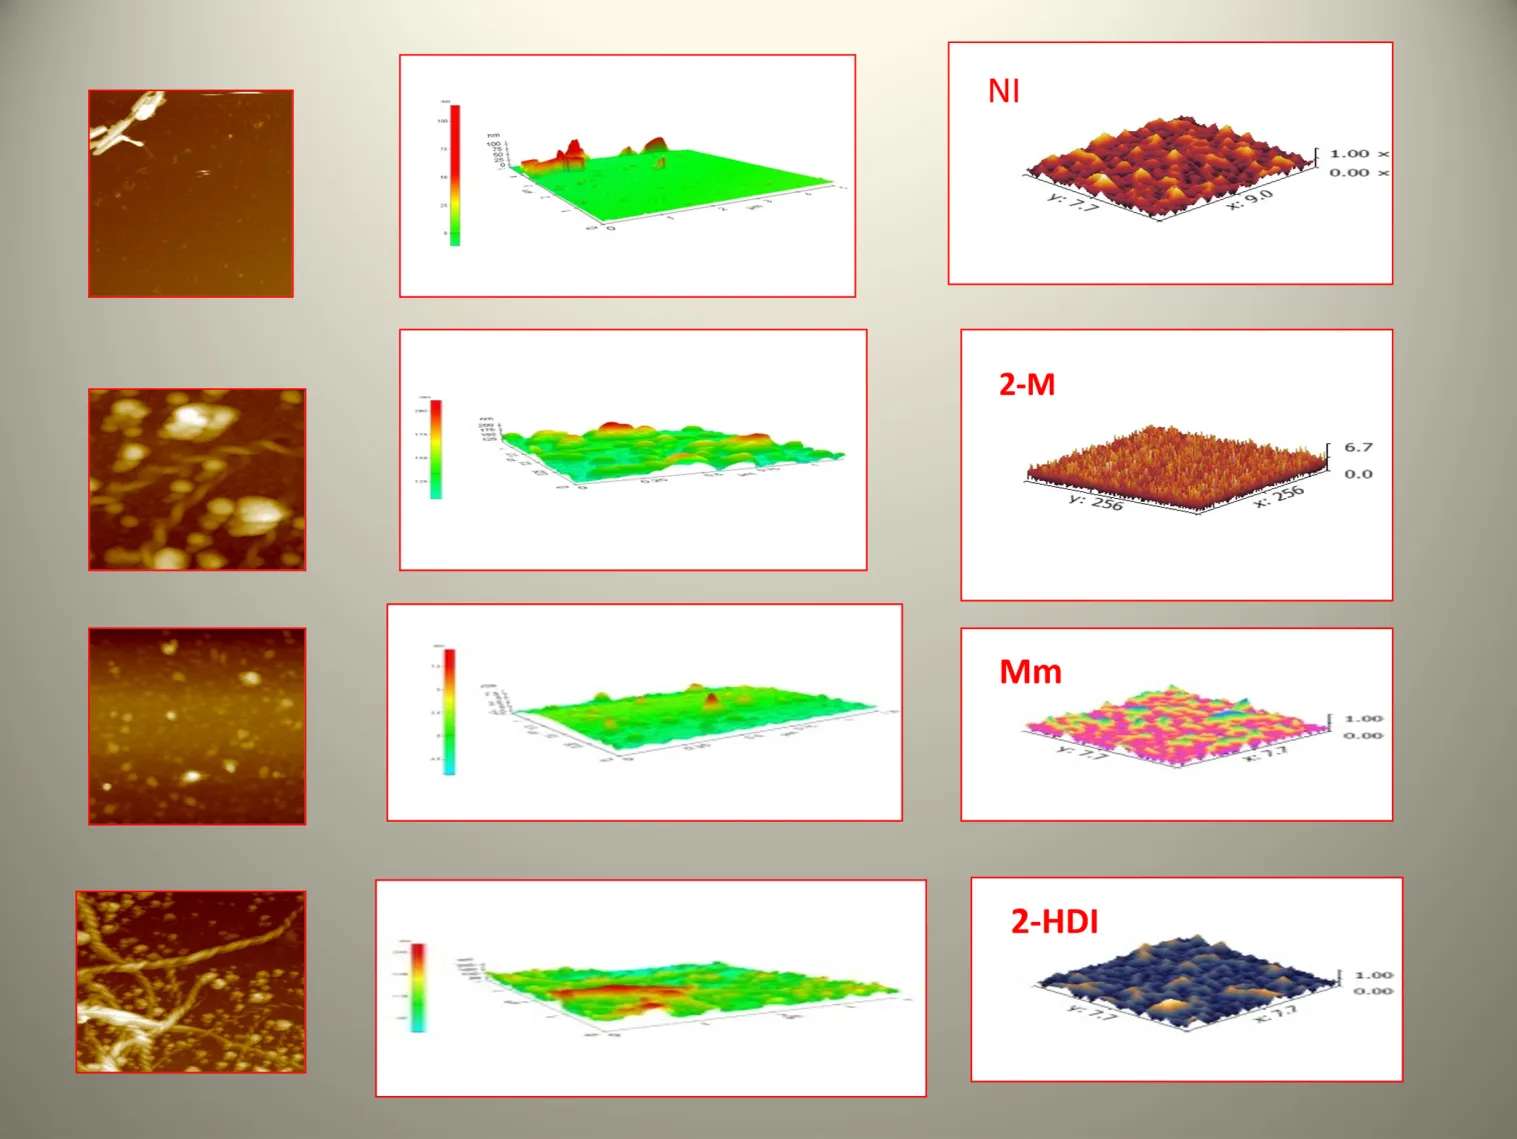
Figure 1.2:
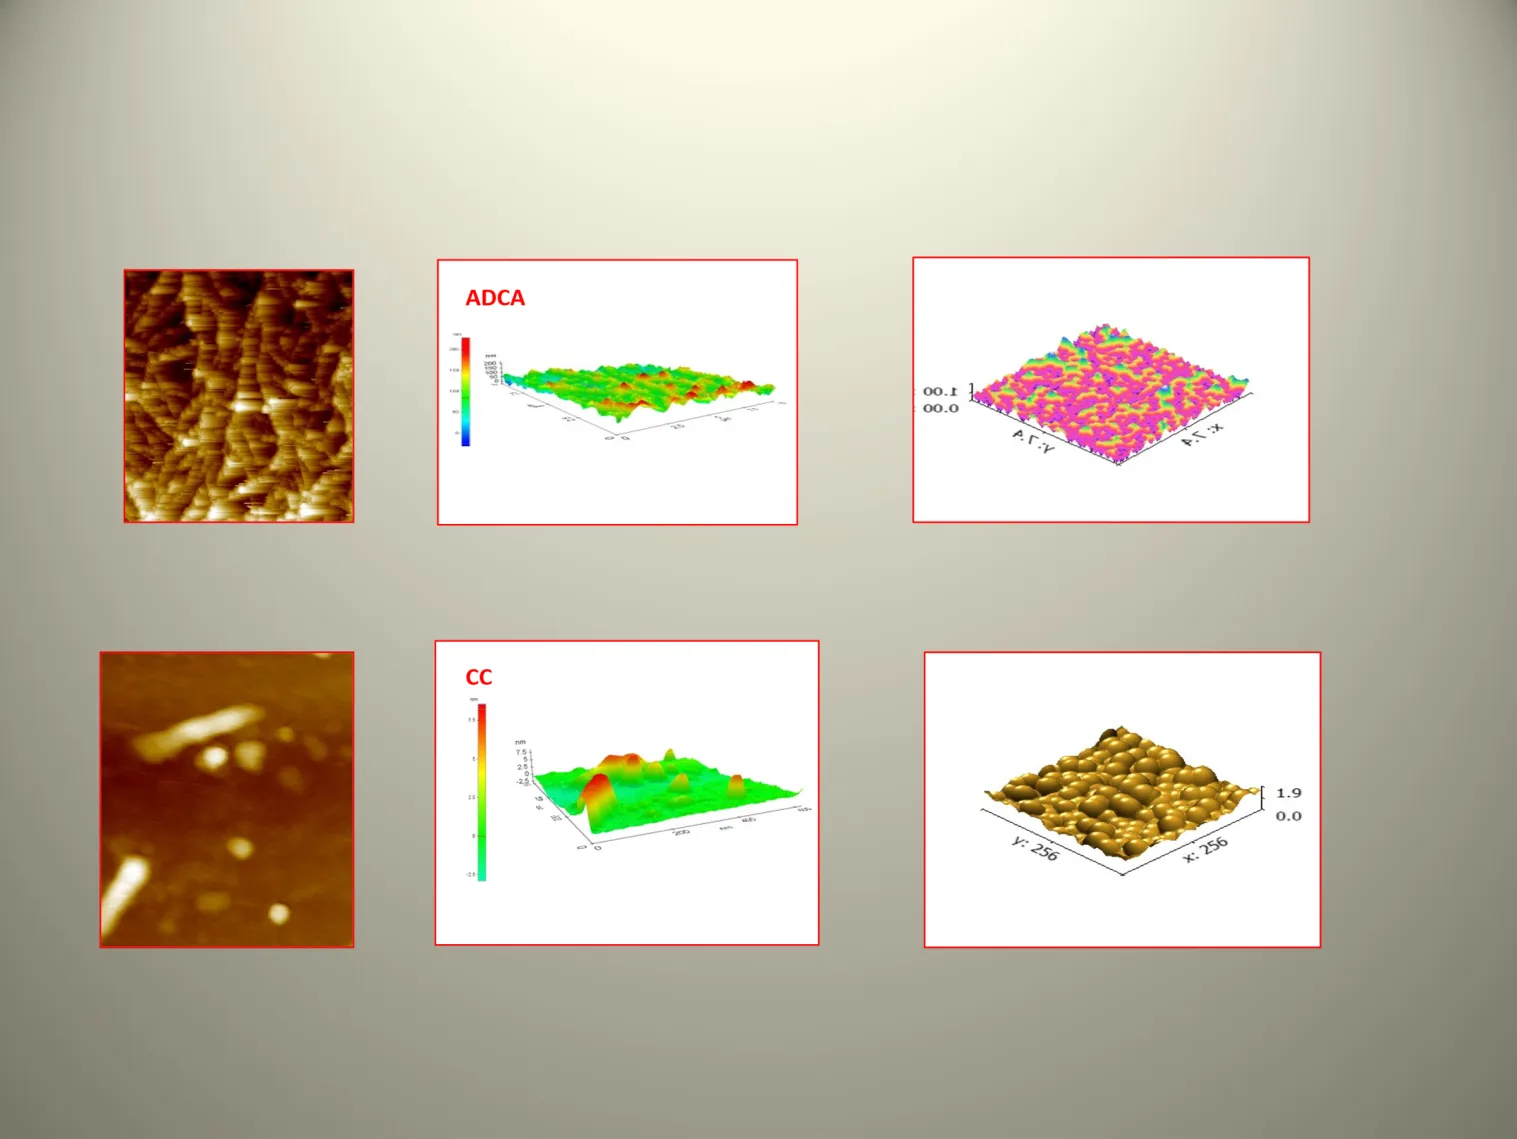
Figure 1.3:
Figure 1.1: , 1.2., 1.3., Refer to the AFM Images and Cross Section
analysis of polished copper, pure copper in 300 ppm Nacl, and of various SAMS covered copper respectively in 300 ppm Nacl
1.2. Contact angle Measurements
Fig. 1.2.1. show the images of sessile water drop on SAMs covered copper and bare copper surfaces respectively, which prove the hydrophobicity of SAMs covered copper due to the strong adsorption of nitrogen and sulphur on the copper substrate over bare copper by preventing the diffusion of corroding ions in protecting the copper substrate from corrosion. The contact angles are found to be 76.00 and 104.60 , 116.70,134.90, 84.30, 105.60, 108.40, 131.30, 97.30, 99.20 respectively for bare copper and for SAMs covered copper [for MT, AT, TT, MNI, 2-M, Mm, 2-HDI, ACDA. CC of concentrations of MT – 5ppm, AT – 15ppm, TT – 5ppm, MNI – 10ppm, 2M- 20ppm, Mm – 15ppm, HDI 10ppm, ACDA – 20ppm,CC – 5ppm] in which the non-polar interaction between the alkyl chains of the molecules due to van der waals’ forces are responsible for protective quality of the SAMs film. The hydrophobicity of the film formed is found to be equal with the hydrophobic film of amino thiol which offers very high inhibition efficiency.
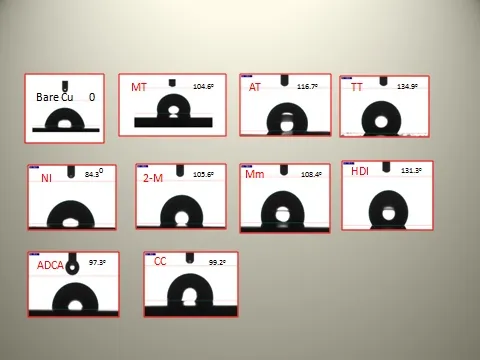
Figure 1.2: 1. Contact Angle Images of Bare Copper and Various SAMs Covered Copper Respectively
1.3. Scanning Electron Microscopic Studies (SEM)
SEM studies of polished bare and SAMs covered copper are studied in 300 ppm of neutral medium for an immersion period of three days. The SAMs covered copper plate after an immersion of 24 hours in the inhibitor solution in ethanol is immersed in 300 ppm sodium chloride solution for three days and pictures of SEM analysis in Fig. 1.3.1. have showed that most of the area of the bare copper have been corroded due to the adsorption of chloride ions and the surface appears very rough due to the uneven formation of the corrosion products and also in Fig. 1.3.1., the SAMs coated copper plate has a smooth uniform coverage of various inhibitors molecules (SAMs) on Cu like 5-methyl-1, 3, 4-thiadiazole molecule of 5 ppm, AT of 15ppm, Thiazoline-2-thiol of 5ppm, MNI of 10ppm, 2-M of 20ppm, Mm of 15ppm, HDI of 10ppm, ADCA of 20ppm and Carboxy cysteine of 5ppm concentration, and without any defective site, and thus preventing the adsorption of corroding elements like chlorine & oxygen, prove the dense formation of monolayer inhibiting corrosion with a very high inhibition efficiency of above 94 to 99.99% and isolate copper from the corroding environment. The figures of the SAMs covered copper plates differ from pure polished surface (with some defective sites) by forming a smooth uniform monolayer throughout.
[Figure - see the formatted PDF]
Figure 1.3: 1.SEM Images of Bare Copper, SEM Image of Pure Copper and Various SAMs Covered Copper in 300 ppm Sodium Chloride
1.4. Energy Dispersive X-ray analysis (EDX)
The Figures 1.4.1. and 1.4.2., show the surface morphology for the elemental identification of bare and SAMs covered copper in aqueous 300 ppm sodium chloride, which have been studied through EDX and it clearly shows the presence of chloride in bare copper specimen and the adsorption of nitrogen, sulphur, in SAMs coated copper specimen, which covers the whole surface forming a uniform protective layer and the absence of corroding elements like chlorine & oxygen prove the dense formation of monolayer offering very high inhibition efficiency, thus protecting copper from the corroding environment by preventing the diffusion of corroding elements.
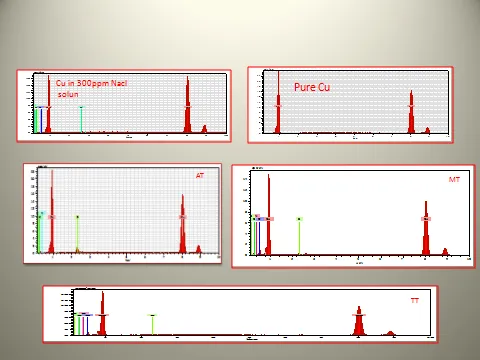
Figure 1.4: 1. EDX Analysis of Copper in 300ppm Sodium Chloride Solution, Pure Copper and SAMs Covered Copper in Aq. 300 ppm Sodium Chloride
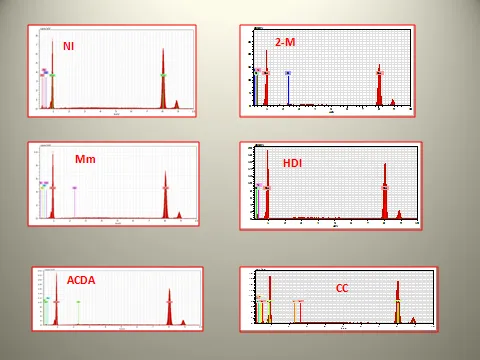
Figure 1.4: 2. EDX Analysis SAMs Covered Copper in Aq. 300 ppm Sodium Chloride
1.5. X-ray Photoelectron Spectroscopyic studies (XPS)
[Figure - see the formatted PDF]
Figure 1.5: 1.XPS Computer Deconvoluted Spectra of, O 1S and Cu 2P of Polished Copper.
[Figure - see the formatted PDF]
Figure 1.5: 2.XPS Computer Deconvoluted Spectra of Cl 2P, C 1S, O 1S of Copper in 300 ppm Aq.Sodium Chloride.
[Figure - see the formatted PDF]
Figure 1.5: 3. XPS Deconvolution Spectra of N 1S, C 1S, Cu 2P, S 2P and Auger Line of (Thiols) SAMs Covered Copper Respectively
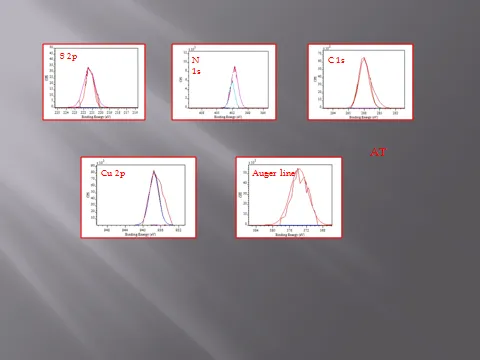
Figure 1.5: 4. XPS Deconvolution Spectra of N 1S, C 1S, Cu 2P, S 2P and Auger Line of (Thiols) SAMs Covered Copper Respectively
[Figure - see the formatted PDF]
Figure 1.5: 5. XPS Deconvolution Spectra of N 1S, C 1S, Cu 2P, S 2P and Auger Line of (Imidazoles) SAMs Covered Copper Respectively
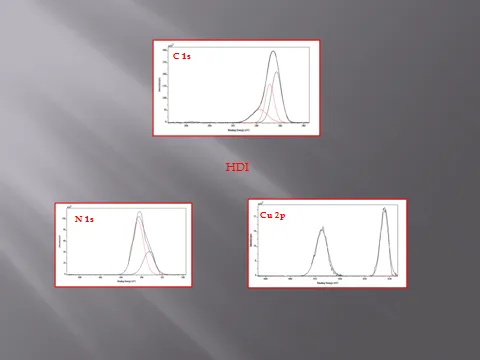
Figure 1.5: 6. XPS Deconvolution Spectra of N 1S, C 1S, Cu 2P, S 2P and Auger Line of (Imidazoles) SAMs Covered Copper Respectively
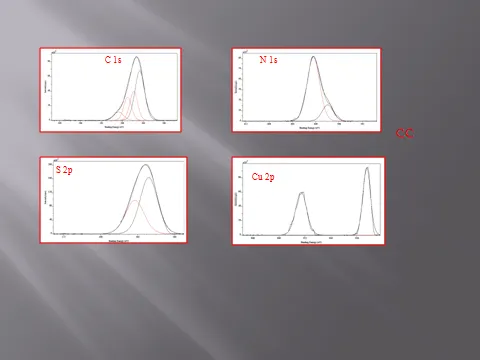
Figure 1.5: 7. XPS Deconvolution Spectra of N 1S, C 1S, Cu 2P, S 2P and Auger Line of (Aminoacids) SAMs Covered Copper Respectively
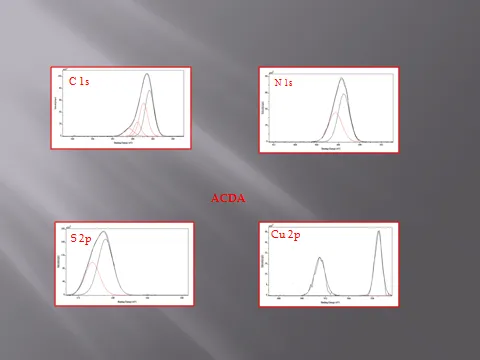
Figure 1.5: 8. XPS Deconvolution Spectra of N 1S, C 1S, Cu 2P, S 2P and Auger Line of (Aminoacids) SAMs Covered Copper Respectively
The computer deconvolution spectra for the peaks due to Cu 2p, C 1s and O 1s electrons are shown in Fig. 1.5.1. respectively. The Cu 2p3/2 at a binding energy of 932.5 eV and can be attributed to Cu (I) or metallic copper. Since there appears another Cu 2p1/2 peak at 952.5 eV and O 1s peak at 533 eV, it is confirmed that the Cu 2p peak is of Cu (I) species, which is due to the formation of Cu2O and not of metallic copper. The C 1s peak may be due to contaminated carbon. The XPS survey spectrum of bare copper after the immersion in 300 ppm sodium chloride solution for a period of three days is shown in Fig. 1.5.2. Cu 2p3/2, Cu 2p1/2 and O ls peaks are detected along with the peak of Cl 2p at 200.2 eV. The peaks due to copper, carbon and oxygen are similar to those of the peaks obtained for bare copper and the presence of Cl 2p peak of bare copper in 300 ppm sodium chloride might be due to the formation of Cucl2 on copper surface.
The XPS survey spectrum of copper covered with SAMs of MT, show peaks due to Cu 2p, O 1s, C 1s, N 1s and S 2p and the corresponding computer deconvolution spectra are shown in Fig. 1.5.3. The Cu 2p3/2 peak at 932.5 eV confirms the presence of cuprous copper due to Cu2S, which shows the cleavage of S-H bond in thiol and sulphur in thol molecule is involved in complex formation with copper (I) ions and C 1s peak at 284 eV is due to the presence of carbon atoms in the alkyl chain of methyl thiol. The N 1s peak at 400 eV and S 2p peak at 164 eV show the presence of nitrogen and sulphur. And nitrogen in the third position of thiol can donate the electron pair easily to form a bond with copper. Therefore, the electron density on this nitrogen is reduced and and the binding energy is shifted to a higher value of 400 eV from 398 eV [7]. Both nitrogen and sulphur form complex with copper (I) ions through chelation. And the formation of this thin inhibitor film is in agreement with the SEM observations. And the appearance of O 1s peak may be due to the formation of cuprous oxide in the intial stages of SAMs formation.
The XPS survey spectrum of copper covered with SAMs of AT, show peaks due to Cu 2p, O 1s, C 1s, N 1s and S 2s and the corresponding computer deconvoluted spectra are shown in Fig. 1.5.3. The Cu 2p3/2 peak at 937.5 eV shows the presence of cuprous copper and C 1s peak at 289.5 eV is due to the presence of carbon atoms in the alkyl chain of amino thiol. The O 1s peak at 536 eV might be due to the oxidation of copper while SAMs formation. The N 1s peak at 401.5 eV shows the presence of nitrogen in the third position in thiol molecule, which can be explained as nitrogen in the third position can donate the electron pair easily to form a bond with copper. Therefore, the electron density on this nitrogen is reduced and and the binding energy is shifted to a higher value of 401.5 eV from 398 eV21and the 2s peak for sulphur appears at 221.4 eV and the Cu LMM peak at 575 eV show the line of Auger electron. Thus the shift in the elemental binding energies of N 1s and S 2p revealed that both nitrogen and sulphur atoms present in amino thiol were involved in the complex formation by chelation with copper through cuprous ions.
The XPS survey spectrum of copper covered with SAMs of TT, show peaks due to Cu 2p, O 1s, C 1s, N 1s and S 2p and the corresponding computer deconvolution spectra are shown in Fig. 1.5.4. The Cu 2p3/2 peak at 938 eV and Cu 2p1/2 peak at 958 eV with the shift of +2 eV can be attributed to cuprous copper due to Cu2S, which shows the cleavage of S-H bond in thiol and sulphur in thol molecule is involved in complex formation with copper (I) ions and C 1s peak at 289 eV is due to the presence of carbon atoms in the alkyl chain of thiol. The O 1s peak at 537 eV might be due to the oxidation of copper while SAMs formation. The S 2s peak at 164.16 eV shows the presence of sulphur in the first position in thiol molecule, which can be explained as sulphur in the first position have donated an electron pair to form a bond with copper. The presence of Cu LMM peak at 573 eV shows the presence of the line of Auger electron, which confirms the presence of Cu (I) species. Thus the shift in the elemental binding energies of S 2s reveal that the sulphur atoms present in thiazoline thiol are involved in the complex formation with copper through cuprous ions.
The XPS survey spectrum of copper covered with SAMs of MNI, show peaks due to Cu 2p, O 1s, C 1s, N 1s and the corresponding computer deconvolution spectra are shown in Fig. 1.1.5. The Cu 2p3/2 peak at 937 eV and Cu 2p1/2 peak at 957 eV show the presence of cuprous copper and not of cupric copper as no peak around 940 to 942 eV has appeared. And the absence of satellite peak confirms the absence of cupric copper and C 1s peak at 290 eV is due to the presence of carbon atoms in the alkyl chain of methyl thiol. The O 1s peak at 537 eVwith the shift of +1 eV shows the presence of oxygen in the imidazole molecule itself. The N 1s peak at 400 eV and 410 eV shows the presence of nitrogen in the first and third position in the imidazole molecule, which can be explained as nitrogen in the third position can donate the electron pair easily to form a bond with copper. Therefore, the electron density on this nitrogen is reduced and and the binding energy is shifted to a higher value from 398 eV [7]. Thus the shift in the elemental binding energies of N 1s reveal that the nitrogen atoms present in 2-methyl-5-nitroimidazole are involved in the complex formation with copper through cuprous ions.
The XPS survey spectrum of copper covered with SAMs of 2-M, showed peaks due to Cu 2p, O 1s, C 1s, N 1s and S 2p and the corresponding computer deconvolution spectra are shown in Fig. 1.1.5. The Cu 2p3/2 peak at 933 eV with the shift of + 0.5 eV shows the presence of cuprous copper and not of metallic copper, which is confirmed by the presence of another Cu 2p1/2 peak at 953 with the shift of +0.5 eV and C 1s peak at 286 eV is due to the presence of carbon atoms in the alkyl chain of 2-mercapto-5-methylthio-1,3,4-thiadiazole. The O 1s peak at 533 eV might be due to the oxidation of copper during SAMs formation. The presence of S 2p and 2s peak at 164.5 eV with the shift of + 0.5 eV and the peak at 229 eV show the presence of sulphur in the molecule at two different chemical compositions. The N 1s peak at 400 eV shows the presence of nitrogen in the third position in azole molecule, the electron density on this nitrogen is reduced and and the binding energy is shifted to a higher value of 400 eV from 398 eV [7]. The presence of Cu LMM peak at 566.7 eV shows the line of Auger electron, which also confirms the presence of Cu (I). Eventhough, the mercaptants are bulkier compounds, the SAMs formed is dense and both nitrogen and sulphur present on the metal surface are involved in the complex formation with copper through Cu (I) by chelation.
The XPS survey spectrum of copper covered with SAMs of Mm, show peaks due to Cu 2p, O 1s, C 1s, N 1s and S 2p and the corresponding computer deconvolution spectra are shown in Fig. 1.1.5. The Cu 2p3/2 peak at 937 eV and Cu 2p1/2 peak at 957 eV with the shifts of +1 eV show the presence of Cu (I). And another Cu 2p peak around 943-947 eV is attributed to Cu (II) species and there is a possibility for the presence of both Cu (I) and Cu (II) species. As the peak around 943-947 eV is smaller when compared to the peak of Cu (I) species, Cu (II) might be present in smaller amount and even though Cu (II) is found to be stable on comparison with Cu (I), as the SAMs formed is found to be very dense, it reduces Cu (II) to Cu (I). C 1s peak at 289.5 eV is due to the presence of carbon atoms in the alkyl chain of methimazole. The O 1s peak at 536 eV may be due to the formation of Cu2O during SAMs formation. The N 1s peak at 402 eV and S 2s peak at 243 eV show the presence of nitrogen and sulphur of methimazole molecule in SAMs, which can be explained as nitrogen in the third position can donate the electron pair easily to form a bond with copper. Therefore, the electron density on this nitrogen is reduced and and the binding energy is shifted to a higher value of 402 eV from 398 eV [7]. Thus the shift in the elemental binding energies of N 1s and S 2s reveal that the nitrogen atoms and sulphur atoms present in methimazole are involved in the complex formation with copper through cuprous ions by chelation. The Cu LMM peak at 575 eV shows the line of Auger electron, which also confirms the presence of Cu (I) ions in the complex.
The XPS survey spectrum of copper covered with SAMs of HDI, shows peaks due to Cu 2p, O 1s, C 1s, N 1s and the corresponding computer deconvolution spectra is shown in Fig. 1.1.6. The Cu 2p3/2 peak at 930 eV and a small Cu 2p1/2 peak at 950 eV with the shifts of +2.5 eV show the presence of cuprous copper and C 1s peak at 284.6 eV is due to the presence of carbon atoms in the alkyl chain of 2-heptadecyl imidazole and the remaining two peaks at 285.76 eV and 287.48 eV may be due to contaminated carbon. The O 1s peak at 527.9 eV may be due to the initial oxidation of copper while SAMs formation. The two N1s peaks at 394.64 eV and 396.69 eV with the shifts of -3.4 eV and -1.3 eV show the presence of nitrogen in the 1st and 3rd third position in imidazole molecule. The absence of satellite peak confirms the presence of Cu (I) ions. Thus the shift in the elemental binding energies of N 1s reveal that the nitrogen atoms present in heptadecyl imidazole are involved in the complex formation with copper through cuprous ions.
The XPS survey spectrum of copper covered with SAMs of ACDA, showed peaks due to Cu 2p, O 1s, C 1s, N 1s and S 2p and the corresponding computer deconvolution spectra are shown in Fig. 1.1.7. The Cu 2p3/2 peak at 934 eV and another peak at 954 eV with the deviation of +1 eV and +2 eV show the presence of cuprous copper and C 1s peak at 286.64 eV is due to the presence of carbon atoms in the alkyl chain of and the other peaks at 285.86 eV, and 287.06 eV with a shift of -0.8 eV & +2.1 eV may be due to the presence of impure carbon. The O 1s peak at 532 eV with a shift of +1eV can be due to the adsorption of oxygen at the initital stages. The N 1s peaks at 399.00 eV and at 400.51 eV with the shift from the elemental binding energy of nitrogen at 398 eV, confirms the presence of nitrogen in the complex and S 2p peaks at 168.8 eV and 170.4 eV of 2p3/2 and 2p1/2 with the shift of +4.8eV & +6.4 eV, with a separation of 0.6 eV, explains the presence of sulphur at different chemical situations and confirm the presence of thiolates on copper surface, where sulphur in the inhibitor molecule is being bonded with copper and the peak is due to the presence of Cu2s. The absence of shake-up satellite peaks in the spectrum confirms the absence of Cu (II) species of copper which may be due to the formation of thick SAMs and the SAMs formed might be sandwiched between the copper oxides, which prevent the further penetration and oxidation. Thus the shift in the elemental binding energies of N 1s and S 2p reveal that nitrogen and sulphur atoms present in azepane-1-carbo dithioic acid are involved in the complex formation through chelation with copper through cuprous ions.
The XPS survey spectrum of copper covered with SAMs of CC, show peaks due to Cu 2p, O 1s, C 1s, N 1s and S 2p and the corresponding computer deconvolution spectra are shown in Fig.1.1.8. The Cu 2p3/2 peak at 933 eV and Cu 2p1/2 peak at 953.16 eV show the presence of cuprous copper and C 1s peak at 284.67 eV is due to the presence of carbon atoms in the alkyl chain of amino acid and the other peaks at 285.83 eV, 288.73eV and 287.02 eV may be due to the presence of impure carbon. The O 1s peak at 531.69 eV shows the presence of oxygen in the molecule itself. The N 1s peaks at 397.98 eV and 400.19 eV with the shift from elemental binding energy of nitrogen at 398 eV confirm the presence of nitrogen in the complex and S 2p peaks at 162.8 eV and 164.32 eV of 2p3/2 and 2p1/2 with a separation of 1.52 eV, explains the presence of sulphur and confirms the formation of thiolates, where sulphur in the inhibitor molecule is bonded with copper as Cu2S and the peak is due to the presence of Cu2S. But, the absence of shake-up satellite peaks in the spectrum confirm the absence of Cu (II) species of copper which might be due to the formation of thick SAMs which prevents the further penetration and oxidation. Since amino acid SAMs formed is very dense, it can reduce the formation of Cu (II) ions to Cu (I). Thus the shift in the elemental binding energies of N 1s and S 2p reveal that nitrogen and sulphur atoms present in Carbocysteine are involved in the complex formation by chelation with copper through cuprous ions. And the formation of thick inhibitor film due to the formation of SAMs is in agreement with SEM observations.
CONCLUSION
Therefore it can be concluded that under these optimum conditions, the SAMs molecules get chemisorbed on the copper metal surface and form complex through the chelation of nitrogen and sulphur atom. The inhibition efficiencies obtained, offer a very good correlation with each other prove the stability of SAMs. Hence the protective monolayer formed on the copper surface played a very vital role in corrosion inhibition of copper. Thus, with the above findings, it has proved that the variation in the efficiency of the monolayers (i.e., the inhibitor molecules) is due to the variation in the adsorption peaks at various energy levels, which depends upon the thickness of the monolayers formed.
REFERENCES

Dr. A. Rajalakshmi Devi, Confirmation and Comaparison of Surface Characterisation Studies in the Formation of Self-Assembled Monolayers on Copper Using Thiols, Imidazoles and Aminoacids., Int. J. Sci. R. Tech., 2026, 3 (11), 764-779. https://doi.org/10.5281/zenodo.24278669
 10.5281/zenodo.24278669