

We use cookies to ensure our website works properly and to personalise your experience. Cookies policy
Columbia College of Physiotherapy, Bangalore, Karnataka, India.
INTRODUCTION: Q angle is a plane of line connected by ASIS to centre of patella and by the centre of patella to tibial tubercle. An elevated Q angle is linked to misalignment of the extensor mechanism, which may result in various patellofemoral issues, including pain, instability, and cartilage deterioration. Concurrently, artificial intelligence is rapidly advancing the evaluation of healthcare by providing tools that facilitate quicker and more precise diagnoses. This study aims to evaluate the criterion validity of the KINOVEA application, a video annotation tool in measuring the Q angle. MATERIALS AND METHODOLOGY: Thirty males, ages 18 to 26, participated in the study. Each participant had a picture taken for the evaluation in KINOVEA, and the anatomical features required for the Q angle measurements were marked. The Q angle was also manually measured using a goniometer. RESULTS: The Bland-Altman analysis indicates that 93.3% of the data points fall within the limits of agreement (LOA) for both right and left Q-angle measurements. This suggests a high level of agreement between the KINOVEA SOFTWARE (a video annotation tool) and the manual goniometer measurements in measuring the Q angle. CONCLUSION: The results suggest that KINOVEA, a free video annotation tool produces valid data, providing an adequate level of accuracy in Q angle measurements and highlights the need of using such trustworthy measurement tools in practical situations and offers useful information on calculating Q angle. CLINICAL RELEVANCE: The use of artificial intelligence (AI) in the medical field has resulted in accurate evaluations being carried out automatically, which has decreased physical therapist’s workload, shortened diagnosis times and errors, and enhanced performance in disease prediction and detection often outperforming traditional methods.
The quadriceps angle (Q-angle) is defined as the angle formed between an imaginary line extending from the anterior superior iliac spine (ASIS) to the centre of the patella and another line extending from the tibial tubercle to the centre of the patella. It is a widely accepted clinical measurement used to evaluate the alignment of the quadriceps muscle relative to the bony structures of the pelvis, femur, and tibia. The Q-angle plays a significant role in assessing patellofemoral joint biomechanics and lower limb alignment, making it an important parameter in orthopedic and physiotherapy practice. Clinicians frequently use this measurement to assess knee function, identify biomechanical abnormalities, and guide treatment planning for musculoskeletal disorders.¹
The concept of the Q-angle has evolved over time. Brattstrom first described it in 1964 as the angle formed between the patellar ligament and the line representing the resultant force of the quadriceps muscle, with the apex located at the patella.2
Subsequently, Insall and colleagues modified the measurement technique by using the anterior superior iliac spine (ASIS) as the proximal anatomical landmark, thereby standardizing the clinical method that is commonly used today.3 According to this method, the Q-angle depends on the relative positions of three anatomical landmarks: the ASIS, the centre of the patella, and the tibial tubercle. These landmarks determine the alignment of the quadriceps mechanism and provide valuable information regarding lower limb biomechanics.4,5
A normal Q-angle is essential for maintaining appropriate patellofemoral tracking and efficient knee joint function. An increase beyond the normal range is considered an indicator of extensor mechanism malalignment and has been associated with several musculoskeletal conditions, including patellofemoral pain syndrome, patellar instability, generalized knee hypermobility, and altered lower extremity biomechanics. Previous studies have also demonstrated the importance of Q-angle assessment in identifying the risk of lower limb injuries among athletes and military personnel, where repetitive physical activities place greater mechanical stress on the knee joint.² Therefore, accurate measurement of the Q-angle is fundamental for clinical assessment, rehabilitation planning, injury prevention, and biomechanical research.6,7,8
Conventionally, the Q-angle is measured using a universal goniometer, which is regarded as the gold-standard clinical instrument because of its simplicity, affordability, and ease of use.9 However, manual measurement is susceptible to examiner-related variability, inaccurate identification of anatomical landmarks, and inconsistencies in patient positioning. These limitations have encouraged researchers to investigate digital technologies that may improve measurement accuracy and reproducibility.10
Kinovea is a free, open-source two-dimensional (2D) motion analysis software designed primarily for sports professionals, biomechanists, clinicians, and researchers. The software enables frame-by-frame video analysis and measurement of kinematic parameters from digital images and videos, providing an economical alternative to expensive motion analysis systems. One of its notable features is its ability to account for camera perspective while measuring an object or individual moving within the recorded field. Although Kinovea has demonstrated validity in assessing several time-related variables and has shown acceptable reliability across different recording perspectives, only a limited number of studies have evaluated its criterion validity against established gold-standard measurement techniques for musculoskeletal assessment.11,12,13
With the rapid integration of artificial intelligence and digital technologies into healthcare, there is an increasing demand for validated tools that provide accurate, objective, and efficient clinical assessments. Numerous software applications are currently available for biomechanical evaluation; however, their clinical usefulness depends on rigorous validation before routine implementation. Establishing the criterion validity of Kinovea for Q-angle measurement may support its use as a reliable, cost-effective alternative to conventional methods in both clinical physiotherapy practice and sports biomechanics. Therefore, the present study aims to evaluate the criterion validity of Kinovea software in measuring the Q-angle in young males by comparing its measurements with those obtained using the gold-standard universal goniometer. This article reports the findings of that comparison and examines the validity of Kinovea as a digital tool for Q-angle assessment.11,14
METHODOLOGY
Study Design
A cross-sectional criterion validity study was conducted to evaluate the validity of Kinovea software in measuring the quadriceps (Q) angle by comparing its measurements with those obtained using a universal goniometer (gold-standard method). A total of 30 participants were included in the study.
Participants
Thirty healthy young males aged 18–26 years from in and around Bangalore were recruited using convenience sampling. Participants with no history of lower limb injury, surgery, musculoskeletal disorders, severe cognitive deficits, or psychological disorders were included. All participants provided written informed consent before participation.
Instruments
The study utilized Kinovea software (version 0.9.5 or later) for digital Q-angle measurement and a universal goniometer as the gold-standard instrument. A smartphone (minimum 1080p resolution), a tripod, a skin-safe marker, and a structured data collection sheet were also used.
Data Collection
The anterior superior iliac spine (ASIS), centre of the patella, and tibial tuberosity were identified and marked using a skin-safe marker. Participants stood barefoot in a relaxed position with feet shoulder-width apart. The Q-angle was first measured manually using a universal goniometer. Standardized anterior-view photographs were then captured using a smartphone mounted on a tripod positioned 2–3 metres from the participant at knee level. The images were imported into Kinovea software, where the Q-angle was measured by drawing lines from the ASIS to the centre of the patella and from the tibial tuberosity to the centre of the patella. Measurements from both methods were recorded for analysis.
Statistical Analysis
Descriptive statistics were expressed as mean ± SD(standard deviation). Karl Pearson's correlation coefficient was used to assess the relationship between Q-angle measurements obtained using the universal goniometer and Kinovea software. Agreement between the two methods was evaluated using Bland–Altman analysis. A p-value of <0.05 was considered statistically significant.
RESULTS
Statistical analysis of the data was performed using SPSS 23.0. The Categorical variables were presented as frequency and percentage. Continuous variables were presented as mean ± SD. Comparison between Correlation was found using Karl-Pearson’s coefficient of correlation. Agreement was tested graphically using Bland Altman method. A p value <0.05 was considered statistically significant
|
|
KINOVEA(AI APP) MEASURED Q-ANGLE |
|
|
MANUALLY MEASURED Q- ANGLE (GONIOMETER) |
r value |
.859** |
|
p value |
p<0.001 |
|
|
N |
30 |
|
Table 1: Correlation between MANUALLY MEASURED Q-ANGLE (GONIOMETER) and KINOVEA (AI APP) MEASURED Q-ANGLE (right)
The agreement between the Q-angle measured using the Kinovea AI app and the manually measured Q-angle using a goniometer on the right side was assessed. A strong and statistically significant correlation was observed (r=0.859,p<0.001) based on a sample of 30 participants, indicating a high level of agreement between the two measurement methods.
|
|
KINOVEA(AIAPP) MEASUREDQ ANGLE |
|
|
MANUALLY MEASURED Q- ANGLE (GONIOMETER) |
r value |
.822** |
|
p value |
p<0.001 |
|
|
N |
30 |
|
Table 2: Correlation between MANUALLY MEASURED Q-ANGLE (GONIOMETER) and KINOVEA (AI APP) MEASURED Q ANGLE (Left )
The agreement between the Q-angle measured using the Kinovea AI app and the manually measured Q-angle using a goniometer on the left side was assessed. A strong and statistically significant correlation was observed(r=0.822, p<0.001) based on a sample of 30 participants, indicating a high level of agreement between the two measurement methods.
|
right |
|
|
Upper LOA: |
7.0023 |
|
Lower LOA: |
-4.4157 |
|
Mean |
1.2933 |
Table 3: Limit of agreement for Q-angle measurements (right)
The Bland-Altman analysis for the right-side Q-angle measurements shows a mean difference of 1.2933 between the Kinovea AI app and the manually measured goniometer values. The limits of agreement (LOA) range from -4.4157 (Lower LOA) to 7.0023 (Upper LOA).
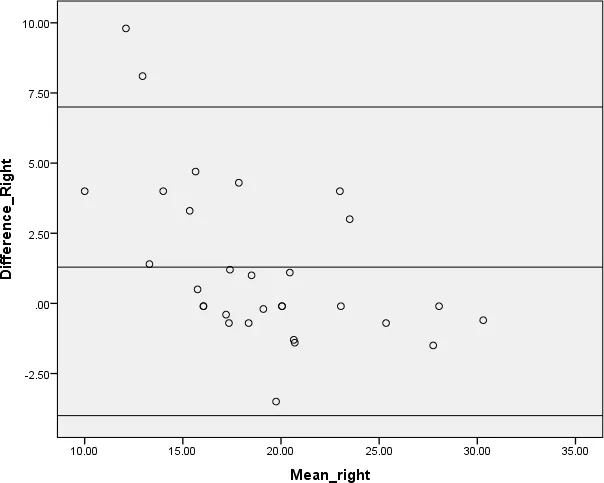
Figure1: Bland Altman plot for right side
|
Left |
|
|
Upper LOA: |
7.652 |
|
Lower LOA: |
-5.0727 |
|
Mean |
1.2900 |
Table 4: limits of agreement for Q-angle measurements (left)
The Bland-Altman analysis for the left-side Q-angle measurements shows a mean difference of 1.2900 between the Kinovea AI app and the manually measured (goniometer) values. The limits of agreement (LOA) range from -5.0727 (Lower LOA) to 7.652 (Upper LOA), indicating the variation between the two measurement methods.
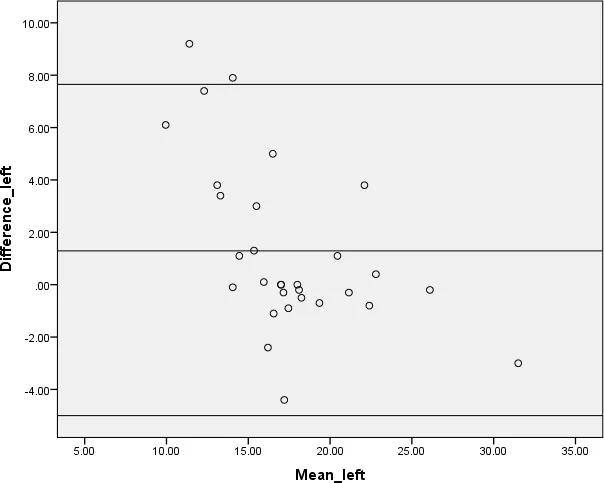
Figure 2: Bland Altman plot for Left side
The Bland-Altman analysis indicates that 93.3% of the data points fall within the limits of agreement (LOA) for both right and left Q-angle measurements. This suggests a high level of agreement between the Kinovea AI app and the manual goniometer measurements, with only a small proportion of points lying outside the LOA, indicating minimal discrepancies between the two methods.
DISCUSSION
The present study aims to evaluate the criterion validity of the Kinovea software in measuring the Q-angle by comparing it to manual goniometric measurements in young male participants. The findings demonstrate a strong and statistically significant correlation between Kinovea and goniometer-derived Q-angle values for both right and left lower limbs (r = 0.859and r = 0.822, respectively; p < 0.001). These results suggest that Kinovea can serve as a valid and reliable tool for assessing the Q-angle in clinical and research settings.
The high correlation coefficients observed in this study are consistent with previous research, which has demonstrated the accuracy and practicality of Kinovea for two-dimensional motion analysis in sports biomechanics and clinical applications. The strength of association between the two methods supports the assumption that Kinovea can closely replicate traditional goniometric measurements, offering an alternative that is non-invasive, cost-effective, and user-friendly.
In addition to correlation analysis, Bland-Altman plots were used to assess agreement between the two measurement methods. For both right and left Q-angle measurements, the mean differences were minimal (1.2933 and 1.2900, respectively), and over 93% of the data points fell within the limits of agreement (LOA). This further confirms the good agreement between the Kinovea software and manual methods, with only a small number of values lying outside the LOA, indicating minimal measurement bias.
It is important to note that while a perfect agreement is ideal, small systematic differences are acceptable, especially when using different modalities of measurement. The observed limits of agreement (approximately±5 to 7 degrees) are within clinically acceptable ranges, particularly given the variability inherent in manual goniometric assessments. The use of digital tools like Kinovea may help reduce inter- and intra-rater variability associated with manual measurements.
Another notable aspect is the ease of implementation of Kinovea in practical settings. Given that it is free and open-source, it provides an accessible solution for institutions with limited resources. Its application can potentially enhance the efficiency and objectivity of lower limb kinematic assessments, especially in large-scale screenings or field-based evaluations.
However, this study is not without limitations. The sample size was relatively small (n=30), and all participants were young males, which may limit the generalizability of the findings to other age groups and females. Additionally, Kinovea provides two-dimensional analysis, which may not fully capture the complexity of three- dimensional joint movements. Future studies should consider larger, more diverse populations and explore comparisons with advanced 3D motion capture systems.
CONCLUSION
In summary, the results of this study demonstrate that Kinovea software shows excellent validity in comparison to the manual goniometer for measuring the Q-angle in young males. Its strong correlation, minimal bias, and high agreement levels support its use as a viable alternative in clinical and field-based assessments. With continued technological integration into healthcare, such tools can play a critical role in improving biomechanical assessments and injury prevention strategies.
Competing Interests : None declared.
Funding: None
REFERENCES
https://www.cureus.com/articles/128069-a-systematic-review-on-quadriceps-angle-in-relation-to-kneeabnormalities#
https://www.cureus.com/articles/128069-a-systematic-review-on-quadriceps-angle-in-relation-to-kneeabnormalities#

Abhijith Subhash, Anita Prem*, Criterion Validity Of Kinovea Software In The Measurement Of Q-Angle In Young Males, Int. J. Sci. R. Tech., 2026, 3 (8), 344-350. https://doi.org/10.5281/zenodo.21872703
 10.5281/zenodo.21872703