

We use cookies to ensure our website works properly and to personalise your experience. Cookies policy
R.M.D Engineering College, R.S.M. Nagar, Kavaraipettai, Gummidipoondi Taluk, Tiruvallur District, Tamil Nadu (Pin: 601 206)
Parkinson's disease (PD) is a progressive neurodegenerative disorder whose early and objective assessment remains a significant clinical challenge. Voice and acoustic biomarkers offer a non-invasive, low-cost avenue for both detecting PD and quantifying its severity. This work presents a comprehensive machine-learning analysis built on two complementary voice-based experimental tracks: (1) a regression pipeline predicting total UPDRS (Unified Parkinson's Disease Rating Scale) severity scores from telemonitoring voice measurements using XGBoost, Random Forest and Support Vector Regression, and (2) a binary classification pipeline distinguishing Parkinson's patients from healthy controls using nine baseline models together with CatBoost, LightGBM and XGBoost, extended through SMOTE-based class balancing, threshold optimization, a four-model stacking ensemble, repeated stratified cross-validation, SHAP-based explainability, nested cross-validation, and bootstrap confidence intervals. The classification pipeline achieves a nested cross-validation ROC-AUC of 0.9683 and an F1-score of 0.9492, while the regression pipeline achieves a single-split R² of 0.9897 that falls to a more realistic 0.7280 under 5-fold cross-validation. The paper documents the full experimental architecture, the acoustic feature space (jitter, shimmer, NHR/HNR, and nonlinear dynamical features), statistical validation via the Mann-Whitney U test, and multiple feature-importance techniques, and it discusses the methodological safeguards — particularly nested cross-validation — that are needed to report credible generalization performance.
Parkinson's disease is the second most common neurodegenerative disorder after Alzheimer's disease, and it progressively impairs motor control, including the fine motor coordination required for speech production. Because vocal-fold vibration and articulation depend on precise neuromuscular control, PD frequently produces measurable acoustic changes — reduced pitch variability, increased frequency and amplitude perturbation, and altered voice quality — well before some motor symptoms become clinically obvious. This has motivated a large body of research into voice-based screening and severity-tracking tools that are non-invasive, inexpensive, and suitable for remote or repeated monitoring.
This work is built on three related but methodologically distinct experimental pipelines: voice-based severity prediction using UPDRS regression, voice-based binary classification using acoustic features, and a handwriting/drawing-based classification pipeline using CNN, EfficientNet, handcrafted features, feature fusion and ensemble learning. These pipelines are separate experimental tracks operating on different modalities and different datasets, and this paper reports them as such rather than presenting them as a single, patient-level fused multimodal model, since no mathematically integrated fusion at the patient level was performed.
2. OVERALL RESEARCH ARCHITECTURE
The overall study can be organized into a voice-based severity track and a voice-based classification track, each with its own preprocessing, modeling and validation pipeline, as summarized in Figure 1.
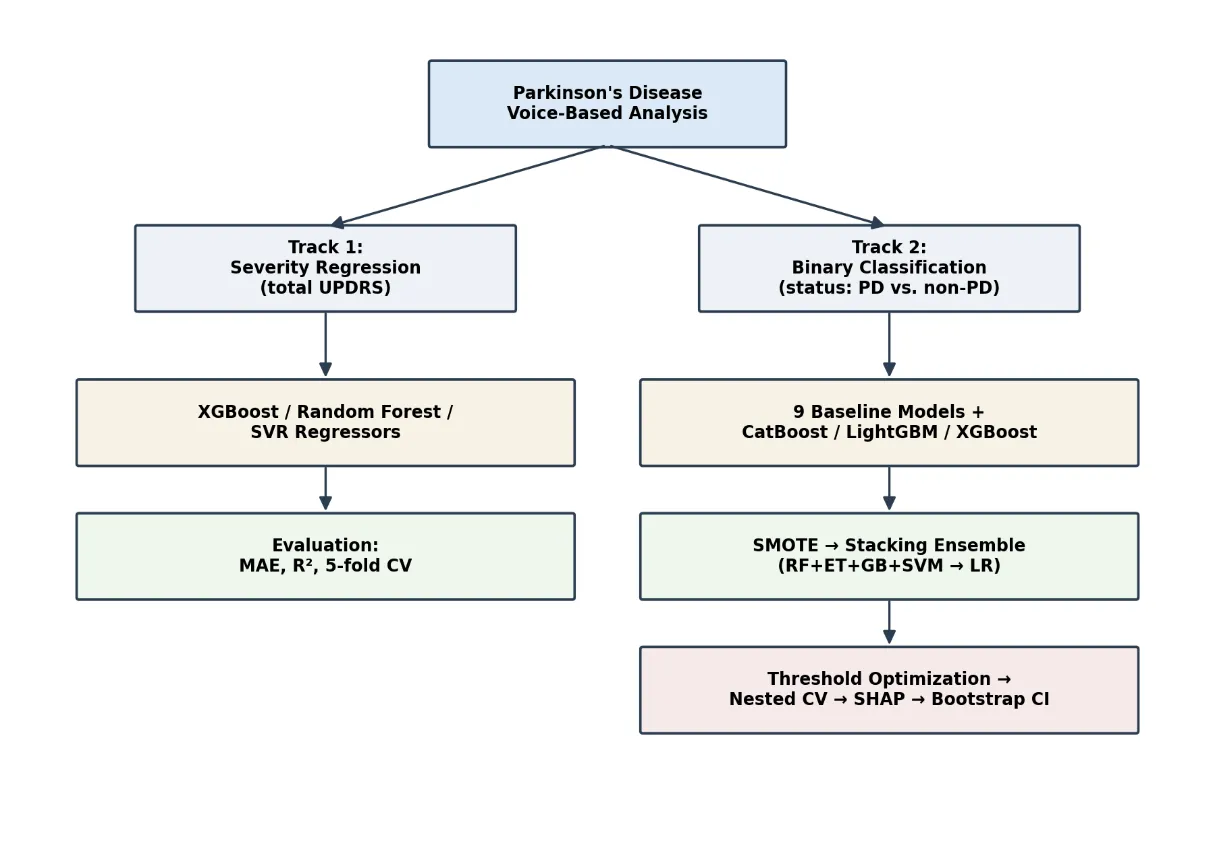
Figure 1: Overall Research Architecture
This architecture reflects multimodal research — studying Parkinson's disease from more than one observable biomarker — rather than a single combined model. Each branch is evaluated with its own metrics and its own validation safeguards, described in the following sections.
3. DATASET DESCRIPTION
3.1 Parkinson's Telemonitoring Dataset (Regression Track)
The regression experiment uses a telemonitoring dataset of 5,875 observations across 22 columns, including a subject identifier, age, sex, test time, motor and total UPDRS scores, and a range of voice/acoustic measurements. The subject identifier and test_time columns are removed prior to modeling, leaving 19 predictors used to estimate the continuous target, total_UPDRS. Removing the subject identifier is reasonable because it is not a biological predictor; removing test_time is a more consequential choice, since it could carry longitudinal information relevant to progression modeling, and this trade-off is worth stating explicitly for a cross-sectional versus longitudinal framing of the task.
3.2 Voice Classification Dataset
The classification experiment uses a dataset of 195 observations and 24 columns — a name identifier, 22 numerical acoustic features, and the binary target status (1 = Parkinson's, 0 = non-Parkinson's). The dataset contains 147 positive and 48 negative samples (approximately 75.4% positive, 24.6% negative), making this an imbalanced binary classification problem. Data-quality checks found 0 missing values and 0 duplicate rows across the 195 × 24 dataset.
4. ACOUSTIC FEATURE SPACE
The predictors in both tracks are derived from established categories of vocal acoustic analysis, described below.
4.1 Jitter Features
Jitter measures cycle-to-cycle instability in the fundamental frequency of vocal-fold vibration. The feature set includes Jitter(%) (relative cycle-to-cycle frequency variation), Jitter(Abs) (absolute frequency variation), RAP (Relative Average Perturbation, capturing short-term variability across neighboring pitch periods), PPQ5 (Pitch Period Perturbation Quotient over five periods), and DDP (Difference of Differences of Periods). Because these measures are mathematically related, substantial correlation among them is expected.
4.2 Shimmer Features
Shimmer measures amplitude variation across successive vocal cycles, complementing jitter's frequency-domain perspective. The dataset includes MDVP:Shimmer, MDVP:Shimmer(dB), Shimmer:APQ3, Shimmer:APQ5, MDVP:APQ, and Shimmer:DDA. Conceptually, a stable voice exhibits consistent frequency and amplitude and therefore lower perturbation, while a disordered voice shows greater irregularity and higher perturbation.
4.3 NHR and HNR
NHR (Noise-to-Harmonics Ratio) represents the relative amount of noise compared with harmonic vocal components, where higher noise can indicate degraded periodicity. HNR (Harmonics-to-Noise Ratio) is the complementary measure, where a higher value generally indicates a more harmonic voice signal. Together these describe voice quality and periodicity.
4.4 Nonlinear Dynamical Features
Beyond simple frequency and amplitude measures, the dataset includes nonlinear characterizations: RPDE (Recurrence Period Density Entropy), capturing complexity and recurrence structure; DFA (Detrended Fluctuation Analysis), measuring long-range correlation/scaling behavior; D2, a correlation-dimension-based complexity measure; and PPE (Pitch Period Entropy), measuring irregularity in pitch-period behavior. These nonlinear features consistently rank among the strongest predictors in the feature-importance analysis (Section 8).
5. METHODOLOGY — SEVERITY REGRESSION TRACK
The regression experiment addresses whether acoustic and demographic characteristics can predict the continuous severity of Parkinson's disease as represented by total UPDRS. Unlike the binary classification target, total UPDRS is a continuous score, making this a regression rather than classification problem.
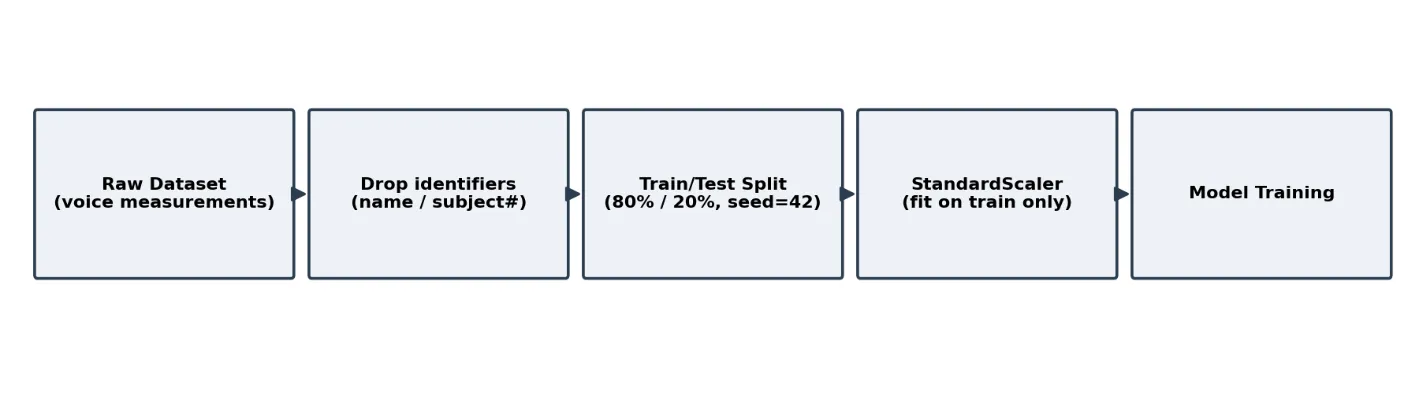
Figure 2: Preprocessing and Modeling Pipeline
5.1 Standardization
Features are standardized using StandardScaler, computing z = (x − μ) / σ, where μ and σ are the training-set mean and standard deviation. The scaler is fitted only on the training data and then applied to the test data, which is the correct procedure for avoiding information leakage from test to train.
5.2 XGBoost Regression
The primary regressor is XGBRegressor with n_estimators=300, learning_rate=0.05, max_depth=4, subsample=0.8 and colsample_bytree=0.8. XGBoost builds an additive ensemble of decision trees, where each new tree is trained to correct the residual errors of the current ensemble; the final prediction is the sum of all tree outputs. A smaller learning rate (0.05) means each tree contributes a small correction and generally requires more trees to converge; max_depth=4 limits individual tree complexity; and the subsample/colsample settings introduce randomness that helps reduce overfitting.
5.3 Regression Results and the Importance of Cross-Validation
On a single 80/20 test split, XGBoost achieves MAE = 0.8139 and R² = 0.9897 — meaning the average absolute prediction error is about 0.81 UPDRS units and roughly 98.97% of test-set variance is explained under that particular split. However, 5-fold cross-validation produces R² values of 0.8588, 0.5493, 0.8266, 0.4781 and 0.9271, with a mean of only 0.7280. This large gap between the single-split result and the cross-validated mean is scientifically important: the high single-split R² should not be presented as the definitive generalization performance, and both figures should be reported together.
|
Model |
R² (single test split) |
|
Random Forest |
0.9946 |
|
XGBoost |
0.9897 |
|
SVR |
0.9273 |
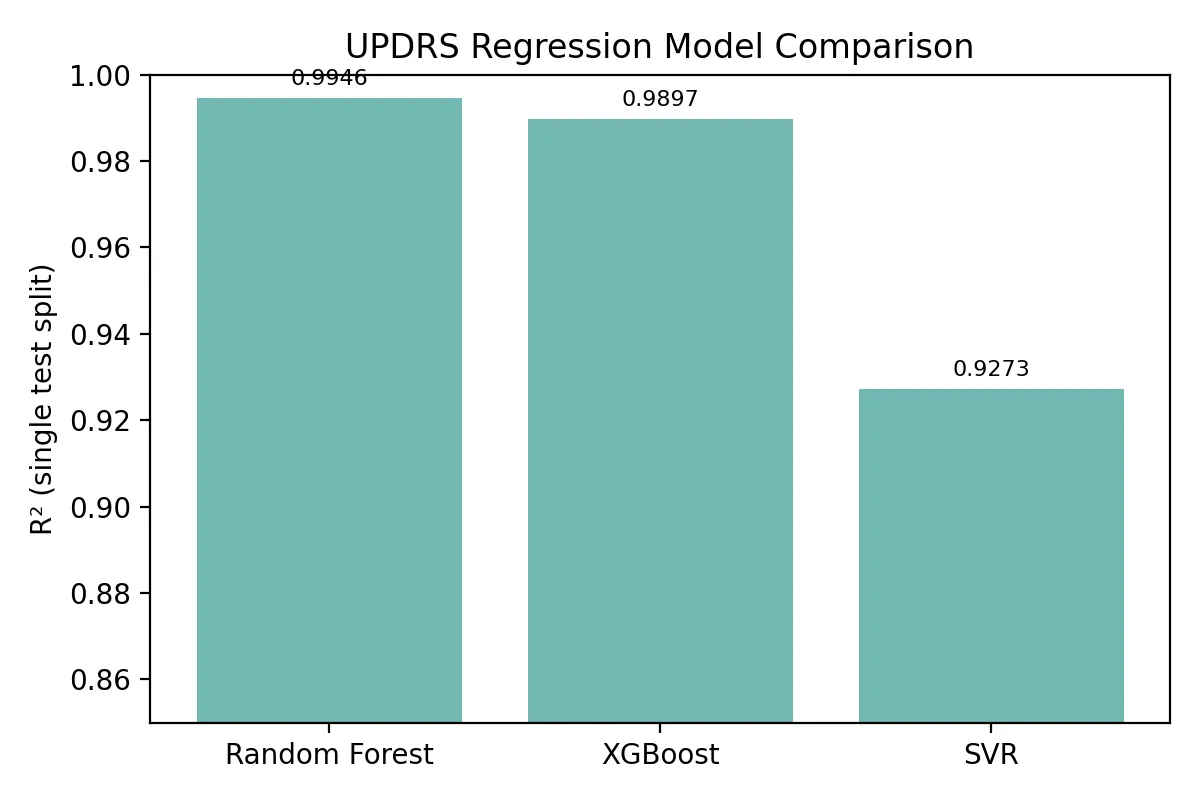
Figure 3: UPDRS Regression Model Comparison (Single-Split R²)
Random Forest obtains the highest single-split R², but because all three values come from the same holdout split, they should be interpreted as holdout performance rather than proof of population-level superiority.
6. METHODOLOGY — BINARY CLASSIFICATION TRACK
6.1 Statistical Feature Analysis
Before modeling, every one of the 22 acoustic features is compared between status = 0 and status = 1 using the Mann-Whitney U test, testing the null hypothesis that both groups come from the same distribution. All 22 features are found significant at p < 0.05, with PPE, spread1, MDVP:APQ, spread2 and MDVP:Jitter(Abs) ranking among the most strongly separated features. Statistical significance here indicates distributional separation within this dataset; it does not by itself establish independent causal or clinical diagnostic value.
6.2 Baseline Models
Nine baseline classifiers are evaluated: Logistic Regression, SVM, KNN, Decision Tree, Random Forest, Extra Trees, Gradient Boosting, AdaBoost and Naive Bayes, using pipelines with median imputation, appropriate scaling, and class balancing. Evaluating multiple model families avoids arbitrarily committing to a single algorithm.
6.3 Ten-Fold Stratified Cross-Validation
Because a trivial majority-class classifier would already score about 75.4% accuracy on this imbalanced dataset, the evaluation emphasizes ROC-AUC alongside precision, sensitivity, specificity, F1, PR-AUC, MCC, balanced accuracy and Brier score. Ten-fold stratified cross-validation, which preserves the class ratio in every fold, gives a more reliable comparison than a single test split.
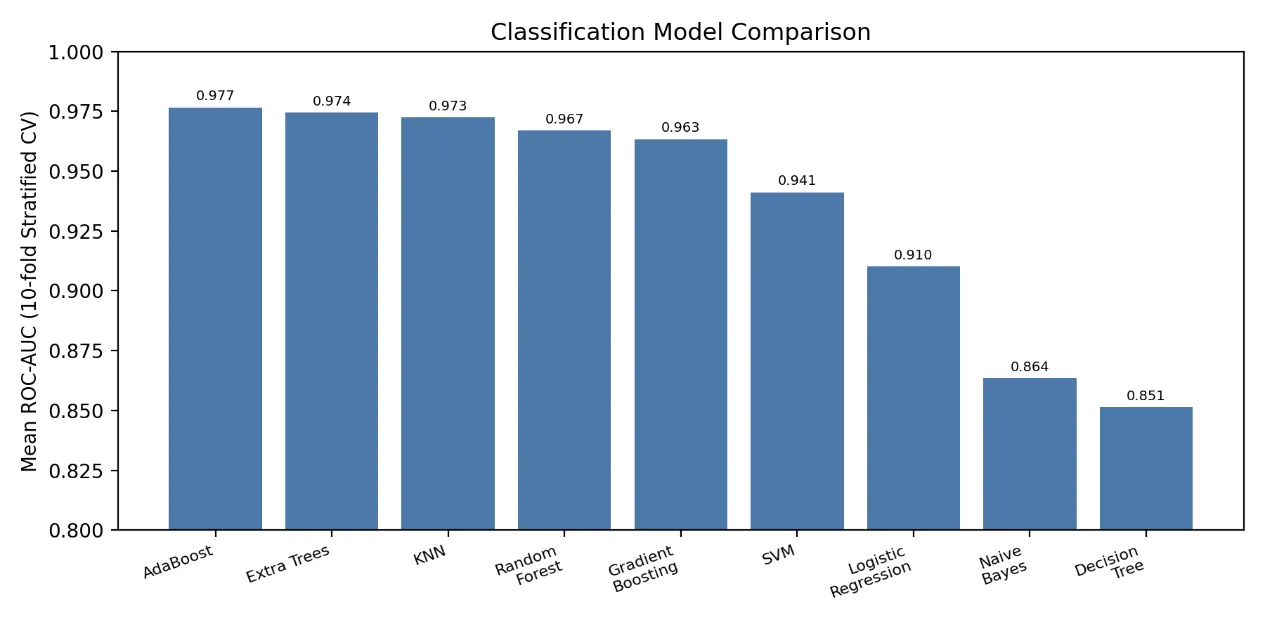
Figure 4: Ten-Fold Stratified Cross-Validation — Mean ROC-AUC by Model
|
Model |
Mean Accuracy |
Mean ROC-AUC |
|
AdaBoost |
0.9276 |
0.9766 |
|
Extra Trees |
0.9276 |
0.9744 |
|
KNN |
0.9184 |
0.9725 |
|
Random Forest |
0.9116 |
0.9670 |
|
Gradient Boosting |
0.9171 |
0.9634 |
|
SVM |
0.8308 |
0.9412 |
|
Logistic Regression |
0.7839 |
0.9102 |
|
Naive Bayes |
0.7132 |
0.8635 |
|
Decision Tree |
0.8868 |
0.8514 |
6.4 Advanced Boosting Models
Beyond the baseline set, CatBoost (iterations=500, depth=5, learning_rate=0.03) reaches Accuracy = 0.9487, F1 = 0.9655 and ROC-AUC = 0.9828; LightGBM reaches Accuracy = 0.8974, F1 = 0.9310 and ROC-AUC = 0.9724; and a tuned XGBoost (500 estimators, max_depth=4, learning_rate=0.03, subsample=0.85, colsample_bytree=0.85, reg_alpha=0.1, reg_lambda=1.0) reaches a single-split ROC-AUC of 0.989655 in the master comparison.
6.5 Class Imbalance Handling with SMOTE
SMOTE (Synthetic Minority Over-sampling Technique) generates synthetic minority-class points along line segments between existing minority observations, x_new = x_i + λ(x_j − x_i) with 0 < λ < 1, rather than simply duplicating them. Applied before Extra Trees, SMOTE yields one of the strongest single-split results: Accuracy = 0.9487, F1 = 0.9655, ROC-AUC = 0.9931 and MCC = 0.8655.
6.6 SVM Hyperparameter Optimization
A grid search over C ∈ {0.01, 0.1, 1, 10, 100}, gamma ∈ {scale, 0.001, 0.01, 0.1, 1} and kernel ∈ {RBF, linear} identifies C=10, gamma=0.1, kernel=RBF as the best configuration, reaching a cross-validated ROC-AUC of 0.97815 — a clear improvement over the default SVM configuration.
7. ENSEMBLE STACKING
A stacking ensemble combines Random Forest, Extra Trees, Gradient Boosting and SVM as base learners, whose probability outputs feed into a Logistic Regression meta-learner (Figure 5). The reasoning is that different base models make different kinds of errors — Random Forest captures nonlinear feature interactions, Extra Trees adds further randomness, Gradient Boosting learns sequential corrections, and SVM contributes a margin-based nonlinear boundary — and the meta-learner attempts to combine their complementary strengths.
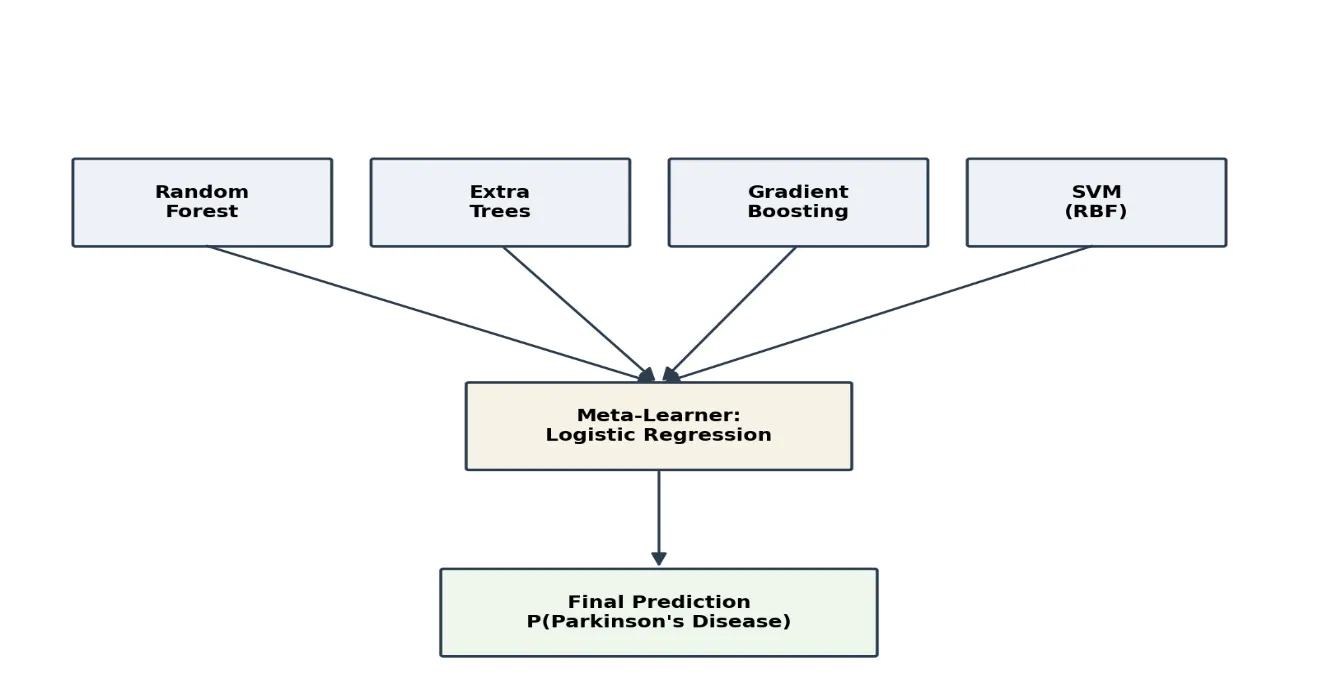
Figure 5: Stacking Ensemble Architecture
On a single test split the stacking ensemble reaches Accuracy = 0.9487, F1 = 0.9655, ROC-AUC = 0.9862 and MCC = 0.8655. Repeated stratified cross-validation (10 folds × 10 repeats) across five models gives a more stable picture: Extra Trees attains the strongest mean ROC-AUC (0.9752 ± 0.0356), while XGBoost attains slightly higher mean accuracy (0.9231).
|
Model |
Accuracy |
F1 |
ROC-AUC |
|
XGBoost |
0.9231 |
0.9503 |
0.9665 |
|
Extra Trees |
0.9219 |
0.9499 |
0.9752 |
|
Gradient Boosting |
0.9184 |
0.9471 |
0.9705 |
|
Random Forest |
0.9117 |
0.9439 |
0.9630 |
|
SVM |
0.8250 |
0.8714 |
0.9308 |
8. FEATURE IMPORTANCE AND EXPLAINABILITY
Rather than relying on one feature-importance technique, the analysis combines Random Forest importance, permutation importance (n_repeats=20, for stability), mutual information, ANOVA F-statistics, and SHAP (SHapley Additive exPlanations). Random Forest importance reflects impurity reduction across trees but can be distorted by correlated variables, which is why permutation importance and SHAP are used alongside it. Mutual information, I(X;Y) = Σ p(x,y) log[p(x,y)/(p(x)p(y))], can capture nonlinear dependence that a linear correlation coefficient would miss.
8.1 SHAP Analysis
SHAP decomposes each prediction as f(x) = Ï•â‚€ + Σâ±¼ Ï•â±¼, where Ï•â‚€ is the baseline prediction and Ï•â±¼ is feature j's contribution. Ranked by mean absolute SHAP value, the top features are PPE, spread2, MDVP:Fhi(Hz), MDVP:Fo(Hz), spread1, D2, MDVP:RAP, DFA, NHR and MDVP:Shimmer(dB), shown in Figure 6.
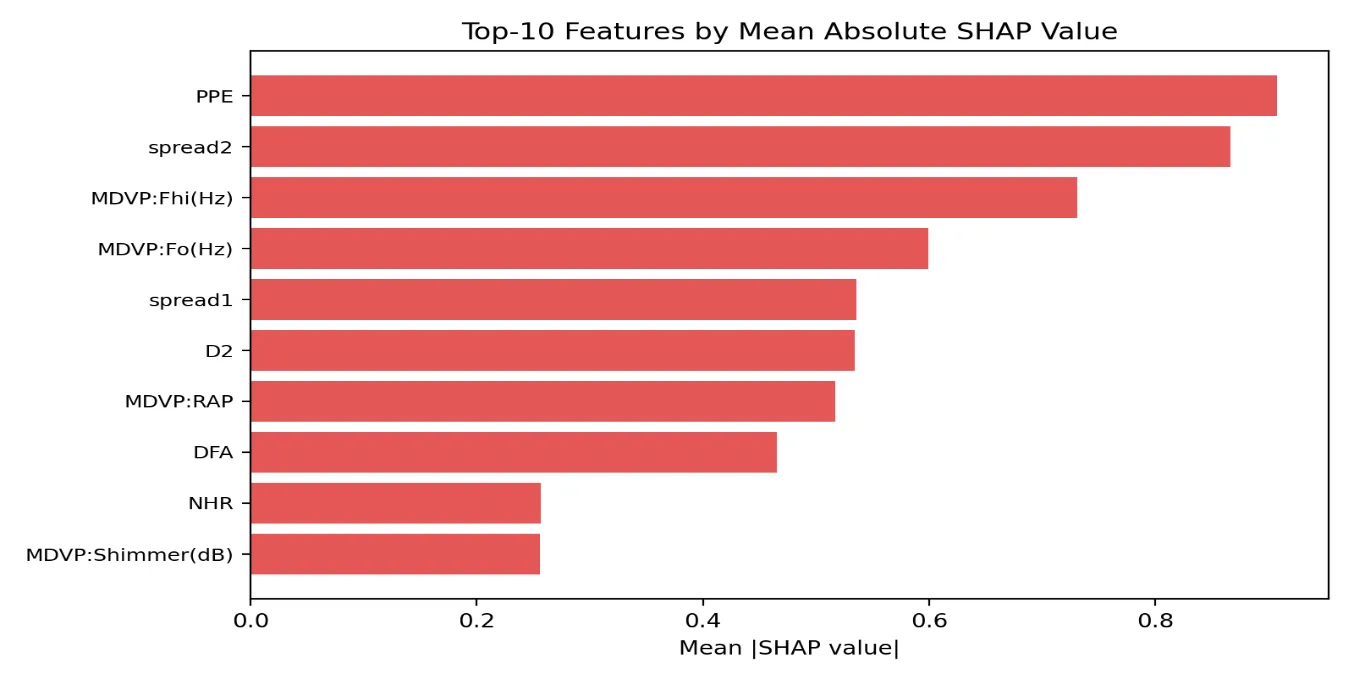
Figure 6: Top-10 Features by Mean Absolute SHAP Value
SHAP values indicate a feature's average contribution to model predictions; they do not establish biological causality. It is appropriate to state that PPE has the largest average contribution to model predictions — it is not appropriate to state that PPE causes Parkinson's disease.
8.2 Principal Component Analysis
PCA transforms the original features into orthogonal components, Z = WX, each capturing a direction of maximum variance, and is useful for dimensionality reduction, visualization, and detecting redundancy. Because PCA maximizes variance rather than class discrimination, a component that explains substantial variance is not automatically the most diagnostically useful component.
9. THRESHOLD OPTIMIZATION AND ERROR ANALYSIS
Rather than using the default 0.5 decision threshold, thresholds from 0.10 to 0.90 (step 0.01) are evaluated, and 0.55 is selected as the value maximizing F1 and MCC, giving Accuracy = 0.9385, Precision = 0.9412, Sensitivity = 0.9796, F1 = 0.9600 and MCC = 0.8300. Raising the threshold generally reduces false positives but can increase false negatives; lowering it generally increases sensitivity but can increase false positives. For a screening application, high sensitivity is particularly valuable, and the optimized threshold misses only 3 of 147 positive cases in the out-of-fold (OOF) evaluation.
The OOF confusion matrix at threshold 0.55 is TN = 39, FP = 9, FN = 3, TP = 144, giving Sensitivity = 144/147 = 97.96%, Specificity = 39/48 = 81.25%, Precision = 144/153 = 94.12%, F1 = 0.9600, MCC = 0.8300, Balanced Accuracy = 0.8960, ROC-AUC (OOF) = 0.9690, PR-AUC = 0.9900, and Brier score = 0.0776. The overall OOF error rate is 12/195 = 6.15%.
10. NESTED CROSS-VALIDATION
Selecting the 0.55 threshold using OOF predictions and then evaluating on those same predictions introduces optimization bias, because the threshold was chosen after seeing the predictions it is later evaluated against. Nested cross-validation addresses this directly, with the explicit goals of preventing threshold-selection leakage, estimating true generalization performance, optimizing the threshold only inside training folds, and evaluating only on unseen validation folds.
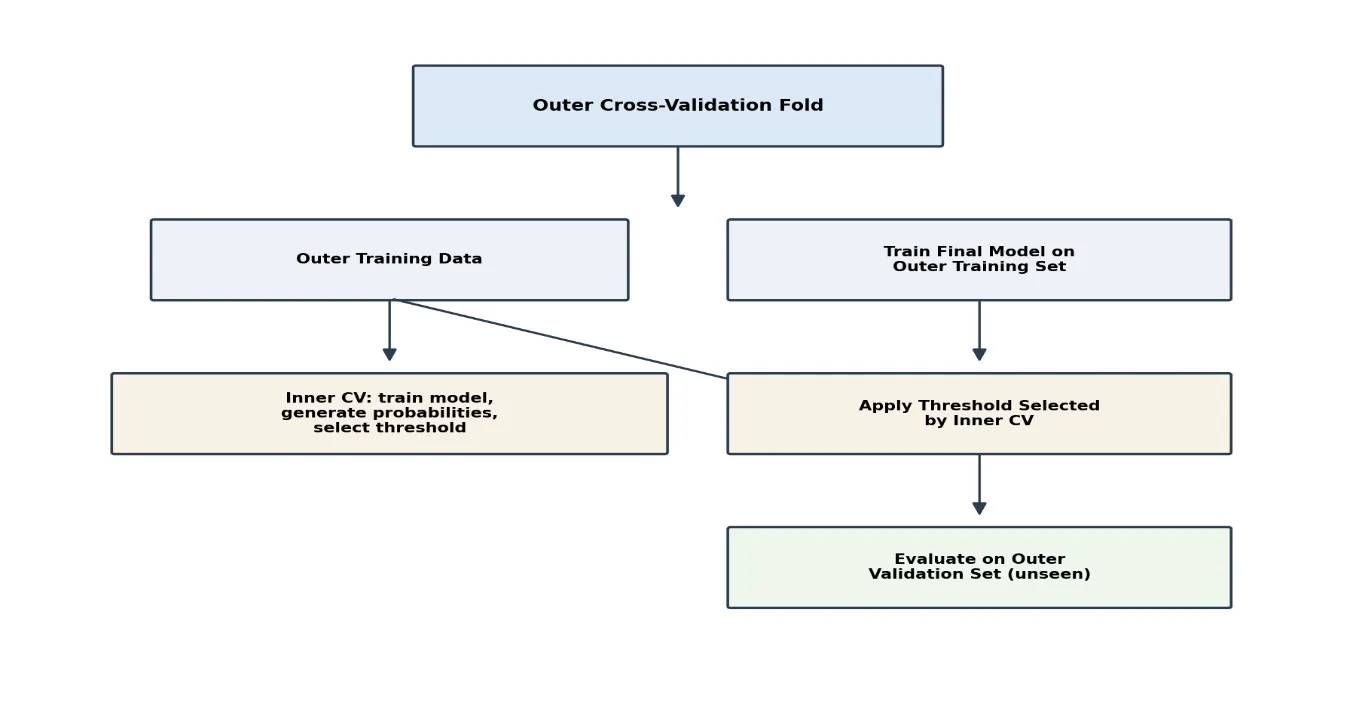
Figure 7: Nested Cross-Validation Architecture
The nested evaluation reports ROC-AUC = 0.9683, PR-AUC = 0.9898, Accuracy = 0.9231, Precision = 0.9459, Sensitivity = 0.9524, Specificity = 0.8333, F1 = 0.9492, MCC = 0.7913, Balanced Accuracy = 0.8929 and Brier = 0.0785, with confusion matrix TN = 40, FP = 8, FN = 7, TP = 140.
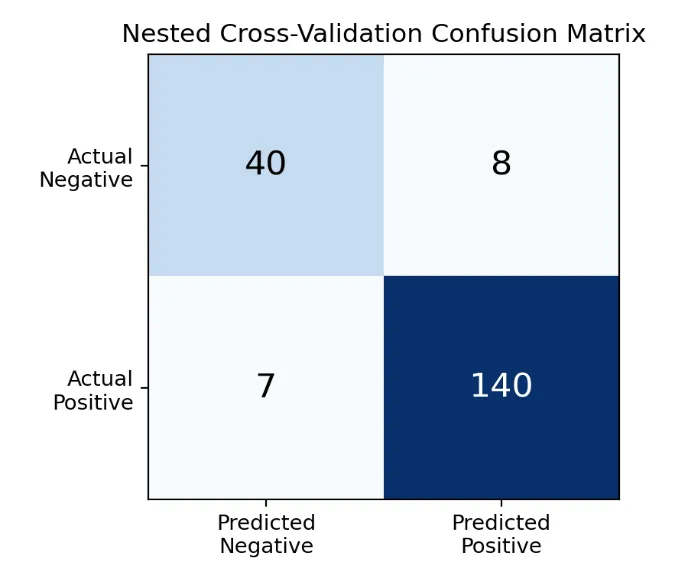
Figure 8: Nested Cross-Validation Confusion Matrix
Comparing the OOF accuracy (93.85%) with the nested accuracy (92.31%) shows a modest drop, while ROC-AUC barely moves (0.9690 → 0.9683). This pattern — stable ranking ability alongside a small accuracy reduction — indicates that most of the difference comes from stricter, leakage-resistant threshold selection rather than a change in the model's underlying discriminative ability, which makes the nested result the more credible figure for the main results.
11. UNCERTAINTY QUANTIFICATION
2,000 bootstrap resamples of the OOF evaluation give 95% confidence intervals alongside each point estimate: Accuracy 0.9381 [0.9026, 0.9692], Precision 0.9408 [0.9000, 0.9753], Sensitivity 0.9793 [0.9536, 1.0000], F1 0.9600 [0.9365, 0.9805], MCC 0.8288 [0.7316, 0.9149], and Balanced Accuracy 0.8954 [0.8379, 0.9473]. Reporting intervals rather than point estimates alone communicates the precision of the estimates given the dataset size.
12. FULL MODEL COMPARISON
|
Rank |
Model |
Accuracy |
ROC-AUC |
|
1 |
XGBoost |
92.31% |
98.97% |
|
2 |
Extra Trees |
92.31% |
98.62% |
|
3 |
CatBoost |
94.87% |
98.28% |
|
4 |
Gradient Boosting |
92.31% |
97.93% |
|
5 |
AdaBoost |
89.74% |
97.59% |
|
6 |
LightGBM |
89.74% |
97.24% |
|
7 |
Random Forest |
92.31% |
97.24% |
|
8 |
Stacking |
93.85% |
96.90% |
|
9 |
KNN |
92.31% |
96.38% |
|
10 |
Voting |
89.74% |
95.17% |
|
11 |
SVM |
79.49% |
94.48% |
|
12 |
Logistic Regression |
76.92% |
92.76% |
|
13 |
Naive Bayes |
66.67% |
86.90% |
|
14 |
Decision Tree |
76.92% |
74.48% |
This single-split ranking is provided for completeness, but the repeated cross-validation and nested cross-validation results in Sections 6.3, 7 and 10 should be treated as the more trustworthy performance estimates.
13. APPLICATIONS OF VOICE-BASED PARKINSON'S ANALYSIS
1. Low-cost, non-invasive early screening for Parkinson's disease using short voice recordings, suitable for primary-care or telehealth settings.
2. Remote and longitudinal severity monitoring via predicted UPDRS scores, reducing the need for frequent in-clinic motor assessments.
3. Objective, quantitative tracking of disease progression and treatment response alongside clinician-administered rating scales.
4. Population-level screening tools that flag at-risk individuals for confirmatory clinical evaluation, using high-sensitivity operating thresholds.
5. Research applications in identifying which acoustic biomarkers (e.g., PPE, spread1/2, nonlinear dynamical features) are most informative for future feature-efficient screening devices.
CONCLUSION
This work presents a methodologically thorough machine-learning analysis of voice-based Parkinson's disease detection and severity prediction, spanning acoustic feature engineering, nine-plus baseline and boosted classifiers, class-imbalance handling with SMOTE, a four-model stacking ensemble, multi-technique feature importance and SHAP explainability, threshold optimization, nested cross-validation, and bootstrap uncertainty quantification. The central methodological lesson is that single-split performance figures — R² = 0.9897 for UPDRS regression or 93.85% OOF accuracy for classification — substantially overstate generalization performance relative to properly cross-validated and nested estimates (R² = 0.7280 under 5-fold CV; Accuracy = 92.31% and ROC-AUC = 0.9683 under nested CV). The stability of ROC-AUC across evaluation schemes suggests the underlying models retain strong ranking ability, while accuracy and threshold-dependent metrics are more sensitive to how rigorously leakage is controlled. Future work should pursue a genuine patient-level fusion of voice and handwriting/drawing modalities, external validation on independent cohorts, and prospective evaluation in real screening settings.
REFERENCES

M. Nivetha*, Machine Learning Approaches For Parkinson's Disease Detection And Severity Prediction Using Voice Biomarkers: A Comprehensive Analysis, Int. J. Sci. R. Tech., 2026, 3 (8), 1144-1153. https://doi.org/10.5281/zenodo.22207962
 10.5281/zenodo.22207962