
We use cookies to ensure our website works properly and to personalise your experience. Cookies policy
R.G Sapkal College of Pharmacy, Sapkal Knowledge Hub, Kalyani Hills, Anjaneri, Trimbakeshwar Rd, Nashik, 422213, Maharashtra, India.
A new simple, sensitive, suitable, precise, and robust reversed-phase high- performance liquid chromatography (RP-HPLC) method was developed and validated for the determination of Metformin and Empagliflozin in it’s bulk and tablet dosage form. The separation was carried on an HPLC system with LC Solution software and HPLC Column C18 column (250 mm x 4.6mm; 5?m). The detection was carried out at 216 nm. In the developed RP-HPLC method, Phosphate buffer : Acetonitrile in the ratio (60:40) v/v was used as mobile phase, at a flow rate of 1.0 mL/min and the retention time was found to be 3.3 min. The results of the analysis in the method were validated in terms of linearity, accuracy, precision, specificity, robustness . The linearity of the developed method was confirmed with a correlation coefficient (r2) of 0.9977. The RSD for the precision of the method were found less than 2.0 %. The percentage recoveries Metformin and Empagliflozin were found to be 100.09 %. The proposed method showed good predictability and robustness. The proposed method showed good predictability and robustness.
Metformin is a first-line oral antihyperglycemic agent widely used in the management of type 2 diabetes mellitus. It belongs to the biguanide class and is recommended as initial pharmacotherapy alongside lifestyle modifications such as diet and exercise. Metformin effectively lowers blood glucose levels without causing significant hypoglycemia, making it a cornerstone in diabetes care [1‑2] The primary mechanism of action of metformin involves the reduction of hepatic glucose production (gluconeogenesis) and improvement of insulin sensitivity in peripheral tissues, particularly skeletal muscle. [3]
Empagliflozin is an oral antihyperglycemic agent belonging to the class of sodium–glucose co-transporter 2 (SGLT2) inhibitors, used in the management of type 2 diabetes mellitus. It improves glycemic control by reducing renal glucose reabsorption in the proximal convoluted tubules, thereby promoting urinary glucose excretion and lowering plasma glucose levels independently of insulin secretion or action[4,5]
Pharmacokinetically, empagliflozin is rapidly absorbed after oral administration, exhibits dose-proportional exposure, and is primarily eliminated via renal and hepatic pathways. It is generally well tolerated, with common adverse effects including genital mycotic infections, urinary tract infections, and increased urination. Rare but serious risks include diabetic ketoacidosis and volume depletion[6,7]
Literature review reveled that determination has been carried out for drug using HPLC.
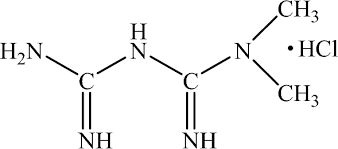
Fig 1: Chemical structure of Metformin
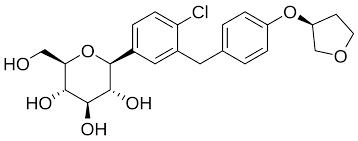
Fig 2: Chemical structure of Empagliflozin
EXPERIMENTAL METHOD:
Materials:
Metformin and Empagliflozin were obtained samples from Arni Analytical Laboratory. Nashik. HPLC-grade solvents like Acetonitrile, Methanol, and HPLC system were obtained from Shimadzu (LC-2010CHT)
Instrumentation :
The HPLC Shimadzu LC-2010CHT with LC software and Agilent Zorbax C18 column (150 mm × 4.6 mm, 5 μm) was used for method development and validation. Design -Expert software version 11.0 was used to design the CCD model.
Preparation of Mobile Phase:
Preparation of Buffer:
Prepare 0.01M Potassium dihydrogen orthophosphate in water.
Preparation of Mobile Phase:
Prepare buffer and Acetonitrile in the ratio (60:40) v/v
Preparation of standard solutions:
Weigh 20 mg Metformin and 20mg of Empagliflozin in 50 ml of volumetric flask sonicate and dissolve and dilute to volume with Mobile Phase. Further dilute 5.0ml of standard to 50 ml with Mobile Phase.
Preparation of sample solutions:
Determine average weight. Crush tablets into fine powder. Weigh accurately the powder equivalent to average weight. Transfer powder to a 50 mL dry volumetric flask, add 30 ml of Mobile Phase sonicate for 10 minute with intermittentant shaking. Cool and dilute upto the volume with Mobile Phase. Further dilute 5.0ml of above sample solution to 50 ml with Mobile Phase.
|
Parameters |
Description |
|
Program |
Isocratic |
|
Mobile phase |
Phosphate buffer: CAN (60:40 v/v) |
|
Wavelength |
216 nm |
|
Injection volume |
20 µL |
|
Flow rate |
1 mL/min |
Table 3: Experimental results and optimized conditions
Method validation :
The method was validated in accordance with the International Conference on Harmonization (ICH) requirements (Q2R2), which involved system suitability, linearity, DL, QL, accuracy, precision, and robustness. [14]
Specificity
Specificity is the ability to access the analyte in the presence of components that may be expected to be present. Analytical process (method) was evaluated for specificity through comparison of the HPLC peaks of the pure active ingredients and the peaks of the samples prepared from the marketed dosage forms with blank and placebo.
Precision
Precision is a measurement of degree of Reproducibility of analytical method and it will be expressed in terms of % relative standard for the area and retention time of Solution prepared. The precision of an analytical procedure expresses the closeness of agreement (degree of scatter) between a series of measurements obtained from multiple sampling of the same homogeneous sample under the prescribed conditions.
Intermediate precision:
Precision under analysis repeatability conditions i.e. conditions where independent test results were obtained with the same method on identical test items in the same laboratory by the same operator using the same equipment within short intervals of time.
Accuracy
The accuracy of the analytical technique expresses the closeness of test results obtained by that method to the true value. Accuracy was determined as % recovery and it carried out at 3 different levels 80 % , 100%, 120%.
Linearity
The linearity of the method was assessed at five concentrations within the range 80 to 120 %. To construct the calibration curves the peak areas were plotted against concentrations.
Detection limit and Quantitation limit
DL is lowest concentration which can be detected not quantified other hand QL is lowest concentration that can be quantified.
Solution Stability:
The solution stability of Metformin and Empagliflozin in the assay method was carried out by leaving the working standard in tightly capped volumetric flasks at room temperature for 24 hrs. The assay sample is also prepared and kept for stability up to 24 hours.
RESULT AND DISCUSSION:
Specificity
There were no extra or co-eluting peaks noticed in the chromatograms at observed retention time of the analytes. Thus, the peaks were considered to be pure, and this proves the specificity of the method. There was no interference observed in Standard & Sample due to Blank.
|
Sr.No. |
Parameter |
Metformin Retention Time |
Empagliflozin Retention Time |
|
1 |
Blank |
0.000 |
0.000 |
|
2 |
Standard Solution |
2.054 |
4.534 |
|
3 |
Sample Solution |
2.058 |
4.543 |
Table 5 : Specificity result for Metformin and Empagliflozin
Precision
1.System Precision : The assay values of three preparation of 20 mg of Metformin and Empagliflozin is having % assay is 100.32 and 100.48 respectively, which is NLT 90.0% and NMT 110.0% so the method for assay of 20 mg of Metformin and Empagliflozin tablet is precise.
2.Intermediate Precision : The assay values of three preparation of 20 mg of Metformin and Empagliflozin is having % Assay is 100.62 and 100.42 respectively, which is NLT 90.0% and NMT 110.0% So the method for assay of 20 mg of Metformin and Empagliflozin and tablet is precise
Accuracy
The % recovery of the Metformin for each injection of each concentration is 100.57 %, 100.05%, 100.75 % and Mean recovery is 100.46 %. The % recovery of the Empagliflozin for each injection of each concentration is 99.28 %, 100.33%, 100.56% and Mean recovery is 100.06 % . which is within the acceptance criteria, hence the method for % assay determination of Metformin and Empagliflozin is accurate.
|
Sr.No. |
Level |
mg of drug spiked |
Metformin Area |
mg of drug Recovered |
% Recovery |
|
1 |
80% |
0.032000 |
2310414 |
0.032183 |
100.57 |
|
2 |
100% |
0.040000 |
2872960 |
0.040019 |
100.05 |
|
3 |
120% |
0.048000 |
3471806 |
0.048360 |
100.75 |
|
Average |
|
|
|
Average |
100.46 |
|
Std.dev |
|
|
|
Std.dev |
0.37 |
|
%RSD |
|
|
|
%RSD |
0.36 |
|
Sr.No. |
Level |
mg of drug spiked |
Empagliflozin Area |
mg of drug Recovered |
% Recovery |
|
1 |
80% |
0.032000 |
1169746 |
0.031770 |
99.28 |
|
2 |
100% |
0.040000 |
1477589 |
0.040131 |
100.33 |
|
3 |
120% |
0.048000 |
1777161 |
0.048268 |
100.56 |
|
Average |
|
|
|
Average |
100.06 |
|
Std.dev |
|
|
|
Std.dev |
0.67993 |
|
%RSD |
|
|
|
%RSD |
0.68 |
Table 6 : Accuracy result for Metformin and Empagliflozin
Linearity
The calibration curves were determined by 5 injections and were found to be linear in the ranges of 80 to 120 %. The obtained results are within the range and coefficient of correlation for the standard curve is 0.9995, hence the method is linear within given range.
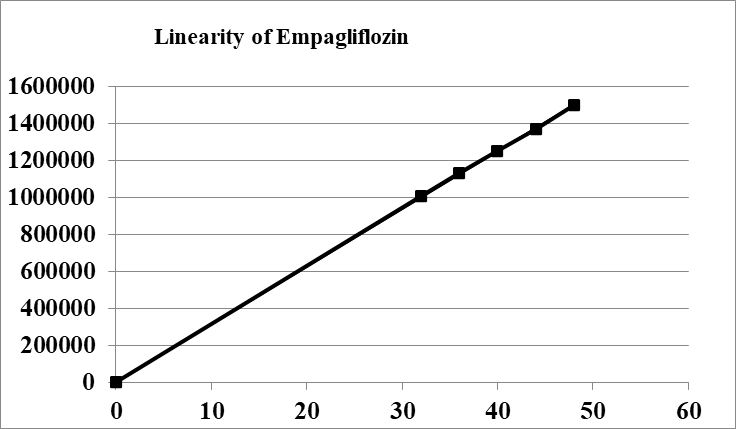
Fig 4: Calibration curve for Metformin
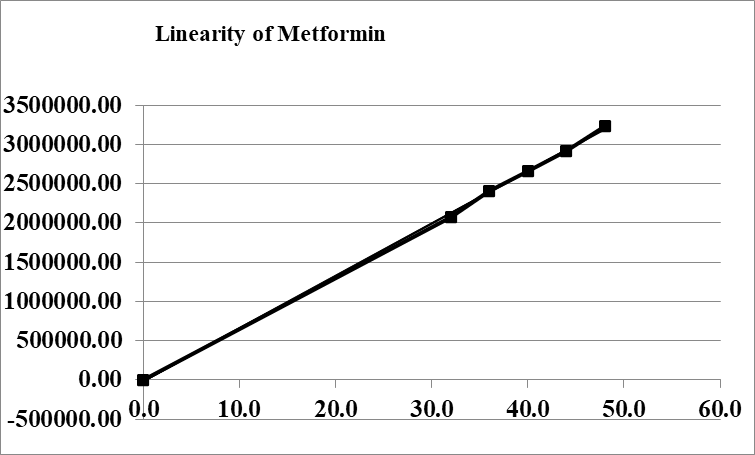
Fig 5: Calibration curve for Empagliflozin
|
Sr.No. |
Concentration in ppm |
Concentration of Solution |
Diluted to |
Metformin Area |
Empagliflozin Area |
|
1 |
32 |
80 |
50 |
2080201 |
1007538 |
|
2 |
36 |
90 |
50 |
2403645 |
1136680 |
|
3 |
40 |
100 |
50 |
2666941 |
1254864 |
|
4 |
44 |
110 |
50 |
2923189 |
1370347 |
|
5 |
48 |
120 |
50 |
3240549 |
1499636 |
Table 7: Linearity result for Metformin and Empagliflozin
Solution Stability
% RSD was found to be less than 2 hence the sample solutions of Metformin and Empagliflozin 20 mg are stable up to 24 hours at room temperature.
|
Sr. No. |
Hours |
Area |
% Assay |
%Assay Difference |
|||
|
Metformin |
Empagliflozin |
Metformin |
Empagliflozin |
Metformin |
Empagliflozin |
||
|
1 |
Initial |
2850825 |
1447584 |
100.32 |
100.48 |
----- |
----- |
|
2 |
4 Hour |
2849810 |
1452361 |
99.96 |
100.33 |
0.36 |
0.15 |
|
3 |
24 Hour |
2834877 |
1445797 |
99.44 |
99.88 |
0.88 |
0.60 |
Table 8: Solution stability result for Metformin and Empagliflozin
Robustness
The robustness of an analytical procedure is the characteristic of its stability with respect to small variations of the system parameters possible under real conditions. This stability is usually evaluated in terms of RSD of the results of analyses compared to analogous data obtained using strictly observed conditions according to the validation analytical procedure.
|
Sr. No |
Precision |
Flow rate |
Compo-1 |
Compo-2 |
|
|
0.9 ml/min |
1.1 ml/min |
||||
|
Std |
2737446 |
5073200 |
3796351 |
3942466 |
4322278 |
|
Sample |
2746142 |
5063579 |
3795454 |
3931361 |
4321617 |
|
% Assay |
100.32 |
99.81 |
99.98 |
99.72 |
99.98 |
|
Difference |
|
0.51 |
0.34 |
0.60 |
0.33 |
|
Sr. No |
Precision |
Flow rate |
Compo-1 |
Compo-2 |
|
|
0.9ml/min |
1.1 ml/min |
||||
|
Std |
1468127 |
8465352 |
6277556 |
7328043 |
6331340 |
|
Sample |
1475208 |
8459297 |
6289235 |
7324258 |
6327948 |
|
% Assay |
100.48 |
99.93 |
100.19 |
99.95 |
99.95 |
|
Difference |
|
0.55 |
0.30 |
0.53 |
0.54 |
Table 9 : Robustness data of Metformin and Empagliflozin
|
Parameters |
Metformin |
Empagliflozin |
|
Specificity |
There was no interference observed in Standard & Sample due to Blank |
There was no interference observed in Standard & Sample due to Blank |
|
Linearity |
||
|
Range ( µg/mL) |
80-120 % |
80-120 % |
|
Y-Intercept |
0.9981 |
0.9999 |
|
Slope |
-177335.0000 |
3209.8214 |
|
Correlation coefficient |
71006.0000 |
31249.0304 |
|
Accuracy |
||
|
% recovery |
100.46 |
100.06 |
|
Precision |
||
|
System Precision |
RSD - 0.25 % |
RSD - 0.81 % |
|
Method Precision |
% Assay – 100.32 |
% Assay – 100.48 |
|
Intermediate precision |
% Assay – 100.62 |
% Assay – 100.42 |
|
Stability of solution |
RSD < 2% |
RSD < 2% |
|
Forced Degradation |
Between 1-9 % |
Between 1-9 % |
Table 10: Validation results of Metformin and Empagliflozin
CONCLUSION
The developed method was found to be simple, robust, accurate, and precise, demonstrating satisfactory performance across all validation parameters. Therefore, the method can be successfully applied for the routine quantitative analysis of Metformin and Empagliflozin in pharmaceutical formulations.
REFERENCES

Nikhil A. Bawane*, Sachin S. Shinde, Nidhi U. Kalamkar, Vanita S. Sawant, Pallavi D Borse, Development And Validation Of RP-HPLC Method For Simultaneous Estimation Of Metformin And Empagliflozin, Int. J. Sci. R. Tech., 2026, 3 (6), 1743-1750. https://doi.org/10.5281/zenodo.21060794
 10.5281/zenodo.21060794