

We use cookies to ensure our website works properly and to personalise your experience. Cookies policy
Department of Pharmaceutical Quality Assurance, Dr. Vedprakash Patil Pharmacy College, Chha. Sambhaji Nagar, Maharashtra, India.
Background: Psoriasis is an inflammatory skin disease that affects millions of people across the globe. There is a need for the lifelong treatment in case of psoriasis. Topical preparations are recommended for the treatment of mild to moderate cases of psoriasis as a result of local application and fewer side effects. Proper analytical techniques are required for the assessment of quality, safety, efficacy, and stability of topical pharmaceutical products. There is a need for stability indicating analytical technique for the assessment of the degradation behavior of the active ingredient under the conditions of storage and use. Objectives: This study was conducted for the development and validation of a simple, rapid, precise, accurate, and stability indicating RP-HPLC method for the quantification of APD in cream formulation. Methods: The chromatographic separation was performed using a well-optimized reverse phase HPLC under the suitable chromatographic conditions. The developed method was validated as per the ICH Q2(R1) guidelines for specificity, linearity, accuracy, precision, robustness, limit of detection, limit of quantification, and system suitability. After validation, the method was used for the routine analysis and stability testing of the APD cream formulation under different storage conditions. Results: The developed method showed good chromatographic resolution with well-resolved peaks and satisfactory retention factors. The method validation results indicated excellent linearity within the chosen range of concentrations with a correlation coefficient higher than 0.999. The percentage recoveries were within the acceptable range, which means that the method is highly accurate. Low relative standard deviations obtained from the precision study indicate the reproducibility of the method. The method also showed good robustness towards the changes in chromatographic conditions. Conclusion: The proposed RP-HPLC method was observed to be simple, sensitive, precise, accurate, and stability indicating. This technique can be used for quality control analysis, quantification, and stability testing of APD cream formulation in the pharmaceutical industry.
Psoriasis is an auto-immune condition that is characterized by hyperproliferation and mal-differentiation of keratinocytes, giving rise to erythematous patches covered with silvery scales. Psoriasis afflicts about two to three percent of the global population and has a considerable effect on the overall wellbeing of the afflicted individual. While the precise cause of psoriasis is not known, genetic predisposition, environmental conditions, and dysregulated immunity are key aspects of the disease process. Research in the field of dermatology has facilitated several modes of treatment of the disease such as topical application, oral medication, light therapy, and biological therapies. In terms of treatment options for psoriasis, topical therapy holds importance because it is the initial mode of treatment for cases of mild and moderate psoriasis [1,2].
APD is an effective anti psoriasis drug that has found extensive use in topical preparations as a remedy for inflammatory diseases of the skin. The effectiveness of APD depends upon its concentration, stability, and distribution in the formulation. For this reason, reliable analytical techniques are needed for quantification of APD in pharmaceutical preparations. With rising demands for quality control and regulatory compliance, there is need for validated analytical methods that will give reliable and reproducible results [3].
Method development is an organized process of selecting and optimizing the conditions of the chromatographic system in order to achieve adequate separation and quantification of pharmaceutical components. High Performance Liquid Chromatography is one of the most commonly used analytical methods in pharmaceutical industries owing to its high sensitivity, specificity, reproducibility and flexibility. This technique is extensively used for assay, impurities profiling, dissolution, bioanalysis and stability study of pharmaceutical drugs. It provides good resolution and accurate quantitation of active pharmaceutical ingredient in pharmaceutical formulations with more than one excipient [4,5].
High Performance Liquid Chromatography includes several critical components such as solvent delivery system, pump, injection system, chromatographic column, detector, data collection and autosampler. The separation process in chromatography is done by different levels of interaction of the analyte molecules with the stationary phase in the column. Reverse phase chromatography is the most used technique in pharmaceutical analysis owing to its versatility and excellent separation efficiency of polar substances. The choice of right chromatographic parameters such as mobile phase, flow rate, detector wavelength affects the efficiency of the analytical method [6].
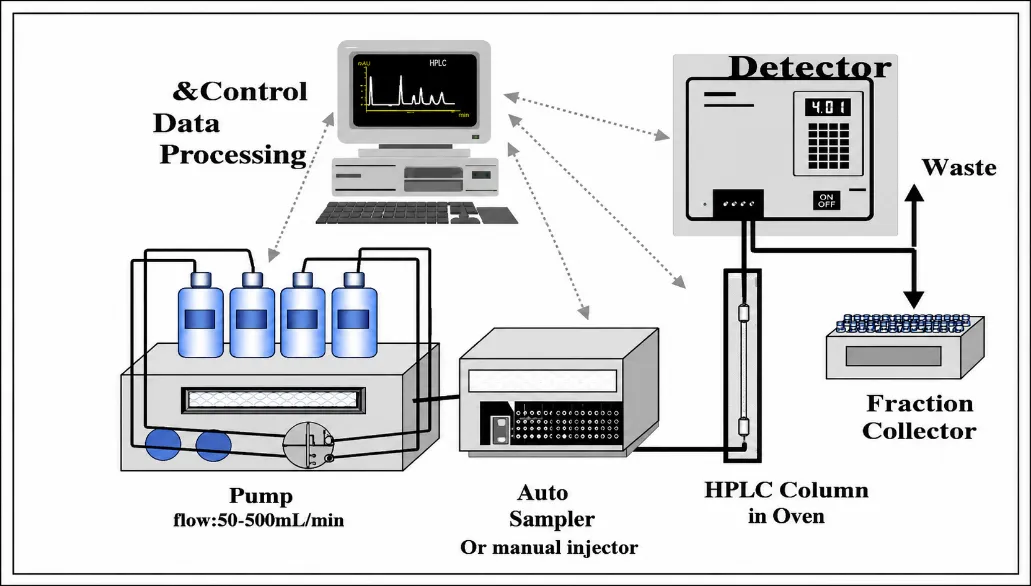
Figure 1: Systematic Diagram of HPLC
Method validation is an important part of pharmaceutical analytical research since it is a documentation of proof that the analytical procedure gives accurate results for its intended use. Analytical methods need to be validated prior to being used in quality control laboratories according to international regulatory authorities such as ICH, USP, and FDA. Parameters for validation may include selectivity, linearity, accuracy, precision, robustness, limit of detection, limit of quantitation, and system suitability. Validation ensures the accuracy of data generated from analysis. A stability indicating analytical method is specifically designed to accurately measure the active pharmaceutical ingredient in the presence of its degradation products, process impurities, and formulation excipients. Such methods are crucial for evaluating the stability profile of pharmaceutical formulations and predicting product shelf life. According to ICH guidelines, stability studies are essential for determining the impact of environmental factors such as temperature, humidity, and light exposure on drug products. A validated stability indicating method facilitates the detection of degradation products and ensures the maintenance of product quality throughout its storage period [8].
Several analytical methods have been reported for the estimation of anti psoriasis drugs including Tapinarof, Calcipotriol, Betamethasone Dipropionate, Halobetasol, Tazarotene, Methoxsalen, and Roflumilast using chromatographic and spectrophotometric techniques. Although these methods have demonstrated satisfactory analytical performance, limited information is available regarding a validated stability indicating RP HPLC method for the quantitative estimation of APD in cream formulation. Therefore, the present investigation was undertaken to develop and validate a simple, precise, accurate, and stability indicating RP HPLC method for APD in cream formulation according to ICH Q2(R1) guidelines and to evaluate its applicability for routine quality control and stability assessment.[9,15].
2. MATERIALS AND METHODS
2.1 Materials
APD working standard was obtained from a certified pharmaceutical manufacturer and was used as received without further purification. The marketed cream formulation containing 0.3% APD was procured from the local market and utilized for analytical investigations. HPLC grade methanol, acetonitrile, orthophosphoric acid, and water were employed throughout the study. All chemicals and reagents used during the experimental work were of analytical reagent grade and complied with pharmaceutical analytical standards.
|
Sr. No. |
Chemical/Reagent |
Grade |
Purpose |
|
1 |
APD Working Standard |
Reference Standard |
Calibration and Assay |
|
2 |
Methanol |
HPLC Grade |
Mobile Phase Preparation |
|
3 |
Acetonitrile |
HPLC Grade |
Mobile Phase Preparation |
|
4 |
Orthophosphoric Acid |
AR Grade |
pH Adjustment |
|
5 |
Water |
HPLC Grade |
Diluent and Mobile Phase |
|
6 |
APD Cream Formulation |
Commercial Product |
Sample Analysis |
Table 1: Chemicals and Reagents Used in the Study
2.2 Instrumentation
Chromatographic analysis was performed using a High Performance Liquid Chromatography system equipped with a quaternary solvent delivery pump, manual injector, ultraviolet visible detector, and computerized data acquisition software. Chromatographic separation was accomplished by means of the reverse phase C18 analytical column at optimal operational conditions. The analytical weightings were carried out by the calibrated digital analytical balance with sensitivity up to 0.1 mg. The ultrasonic sonication was used as the method of degassing of the mobile phase and for the purpose of the dissolution of the drug substance. All the equipment utilized within the course of the study was calibrated and qualified according to the laboratory quality assurance protocols.
The HPLC system included a solvent reservoir, a high pressure pump, an injector, a chromatographic column, a detector, and a data collecting module.
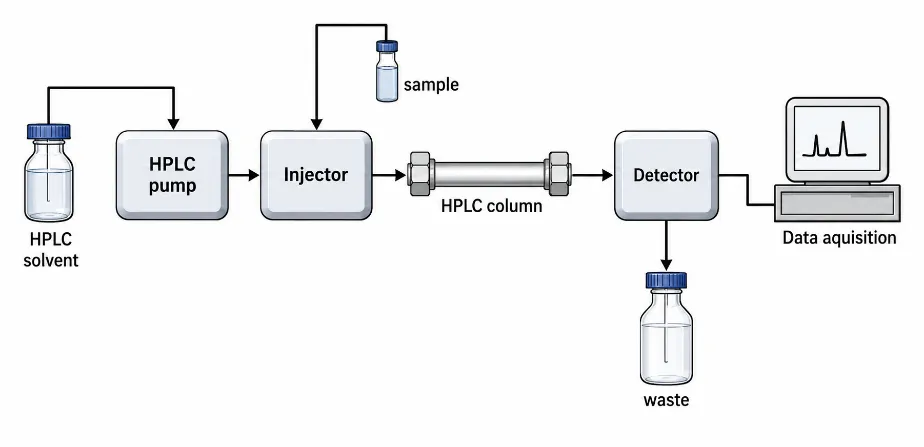
Figure 2: Systematic Diagram of HPLC
2.3 Method Development Strategy
The creation of a technique involves the systematic optimization of conditions of the chromatography in order to provide good separation, reasonable retention time, symmetrical peaks, and adequate sensitivity. Several experiments were performed using different compositions of mobile phase, columns, and different wavelengths of detection. System suitability indicators such as the number of theoretical plates, tailing factor, resolution, and retention time were used for the optimization.
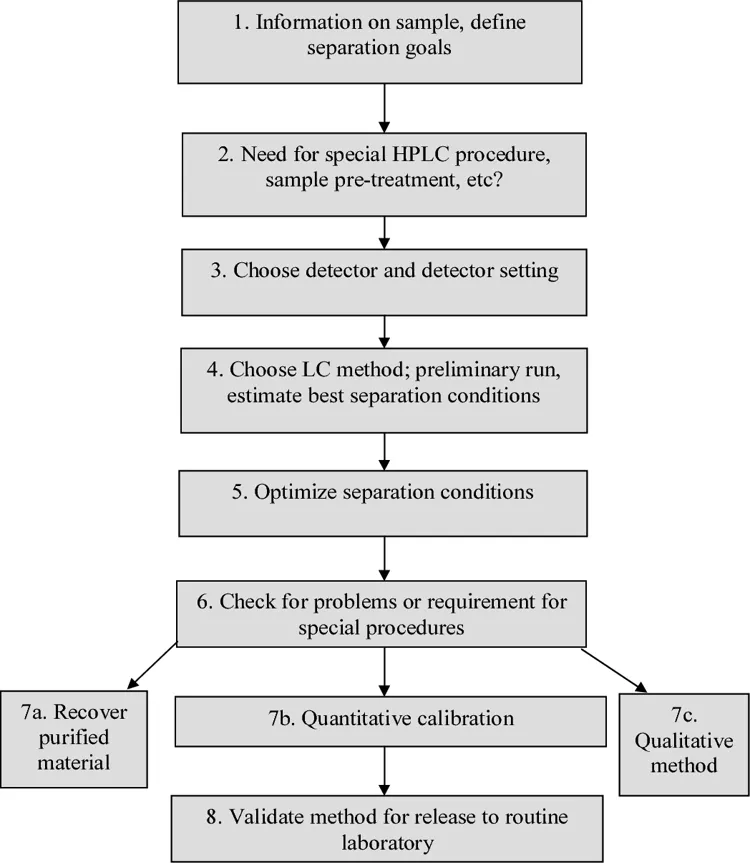
Figure 3: Steps in HPLC Method Development
Development procedure was based on choosing a suitable stationary phase and then optimizing the mobile phase composition. Wavelength for detection was chosen according to UV absorption properties of APD. Different parameters of the method were studied to achieve good symmetry and sharpness of the peak.
2.4 Selection of Detection Wavelength
The UV Spectra of APD was measured using the UV Visible Spectrophotometer in the wavelength range of 200 to 400 nm. A standard sample of APD was taken and scanned to find the wavelength which gave maximum absorbance. The wavelength which had the maximum absorbance was chosen as the detection wavelength in the HPLC method.
2.5 Selection of Chromatographic Conditions
Various combination systems made up of methanol, acetonitrile, water, and buffers have been tested during initial trials. The purpose here was to obtain suitable peak symmetry, proper retention, and baseline separation from excipients of the formulation.
After optimization, the chromatographic conditions providing acceptable system suitability parameters were selected for further validation studies.
2.6 Preparation of Mobile Phase
The selected mobile phase was prepared by accurately measuring the required quantities of organic solvent and aqueous phase according to the optimized ratio. The prepared mobile phase was filtered through a 0.45 μm membrane filter to remove particulate matter and subsequently degassed using an ultrasonic bath for approximately fifteen minutes prior to chromatographic analysis.
2.7 Preparation of Standard Stock Solution
An accurately weighed quantity of APD working standard equivalent to 10 mg was transferred into a 100 mL volumetric flask. Approximately 70 mL of diluent was added and the solution was sonicated until complete dissolution was achieved. The volume was then adjusted to the mark with the same diluent to obtain a stock solution containing 100 μg/mL of APD.
2.8 Preparation of Working Standard Solution
Aliquots of the standard stock solution were transferred into a series of volumetric flasks and diluted appropriately with the selected diluent to obtain working standard solutions covering the concentration range required for method validation studies. These solutions were used for linearity, precision, accuracy, and robustness investigations.
2.9 Sample Preparation
A measured amount of the cream sample equivalent to 10 mg APD was added to the volumetric flask containing the appropriate amount of diluent. The mixture was sonicated to aid in extracting the drug from the semisolid base. This solution was then filtered using a membrane filter to separate the insoluble excipients. The necessary dilutions were done to get the required concentration.
2.10 System Suitability Evaluation
Before analyzing the samples, system suitability test was done to check for the acceptability of the HPLC system. The HPLC system suitability test was done by making six replicates of the standard and recording the system suitability parameters. The acceptance criteria were determined based on pharmaceutical regulation guidelines.
|
Sr. No. |
Parameter |
Acceptance Criteria |
|
1 |
Number of Theoretical Plates |
More than 2000 |
|
2 |
Capacity Factor |
Greater than 1 |
|
3 |
Relative Retention |
Greater than 1 |
|
4 |
Resolution |
More than 1.5 |
|
5 |
Tailing Factor |
Less than 2 |
|
6 |
Relative Standard Deviation |
Less than 2% |
Table 2: System Suitability Parameters
2.11 Method Validation
The established RP-HPLC method was validated based on the ICH guideline for analytical procedure validation, Q2(R1). The parameters validated were specificity, linearity, precision, accuracy, limit of detection, limit of quantitation, robustness, and system suitability.
2.11.1 Specificity
Specificity was assessed by the comparison of the chromatograms from blank solution, placebo solution, standard solution, and sample solution. The capability of the method to quantify APD free from interference due to any excipient or degradation product was studied.
2.11.2 Linearity
Linearity was assessed by preparing a series of APD standard solutions covering the anticipated analytical concentration range. Each concentration level was injected into the HPLC system and the corresponding peak areas were recorded. A calibration curve was constructed by plotting concentration versus peak area, and linear regression analysis was performed.
2.11.3 Precision
Precision was evaluated through repeatability and intermediate precision studies. Repeatability was determined by analyzing six replicate preparations of the same concentration under identical operating conditions. Intermediate precision was assessed by performing the analysis on different days and by different analysts.
2.11.4 Accuracy
Accuracy was determined using recovery studies at three concentration levels corresponding to eighty percent, one hundred percent, and one hundred twenty percent of the target concentration. Known quantities of APD standard were added to the pre analyzed sample and percentage recovery values were calculated.
|
Level |
Concentration Level |
|
Level I |
80% |
|
Level II |
100% |
|
Level III |
120% |
Table 3: Accuracy Study Levels
2.11.5 Limit of Detection and Limit of Quantification
The sensitivity of the method was evaluated by calculating the limit of detection and limit of quantification using the standard deviation of response and slope of the calibration curve. The calculations were performed according to ICH recommendations.
LOD = 3.3 × (σ/S)
LOQ = 10 × (σ/S)
Where σ represents the standard deviation of response and S represents the slope of the calibration curve.
2.11.6 Robustness
Robustness was examined by deliberately introducing minor variations in chromatographic parameters including flow rate, mobile phase composition, and detection wavelength. The influence of these changes on chromatographic performance was assessed.
2.11.7 Ruggedness
Ruggedness studies were performed by conducting analyses using different analysts, instruments, and experimental conditions. The obtained results were compared to evaluate the reproducibility of the analytical procedure.
2.12 Stability Indicating Assay
Stability indicating ability of the method developed was tested by storing the cream formulation in different storage conditions. The samples were stored at controlled temperatures for three months. At specific intervals, the samples were analyzed using the developed RP HPLC method and percentage assays were calculated. The chromatograms of stressed samples were evaluated for the appearance of any degradation product and change in retention behavior.
The studies of stability were conducted in order to prove the suitability of the method developed for stability testing of APD cream formulation.
3. RESULTS AND DISCUSSION
3.1 UV Visible Spectrophotometric Analysis
The development of the UV Visible spectrophotometric technique began with the identification of the wavelength of maximum absorption (λmax) of APD before proceeding to the development of the RP HPLC method. Choice of methanol as the solvent was based on the solvent's capacity to dissolve the analyte. The standard solution of APD was scanned across a range of 200 – 400 nm. The absorption spectrum revealed an absorption peak at 245 nm, which indicated the presence of high absorbency of the analyte at this wavelength. Hence, 245 nm was chosen as the wavelength for analysis through UV spectrophotometry and RP HPLC techniques.
Choice of λmax ensures high analytical sensitivity by generating maximum detector response without any background interference. This wavelength was also ideal for the quantitative estimation of APD.
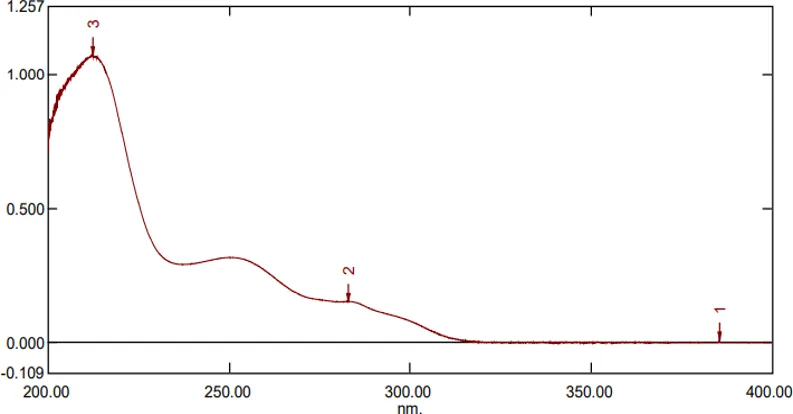
Figure 4: UV-Spectrum of APD
After selecting the wavelength for measurement, the linearity of the UV Spectrophotometry was determined using Beer Lambert’s law. This was done by preparing standard solutions that had varying concentrations from 10 µg/mL to 50 µg/mL, and their respective absorbance values were recorded at 245nm. It was noted that the absorbance increased linearly with increasing concentration of the drug, thus showing excellent compliance with Beer Lambert’s law.
|
Sr. No. |
Concentration (µg/ml) or (ppm) |
Absorption |
|
1 |
10 µg/ ml |
0.318 |
|
2 |
20 µg/ ml |
0.636 |
|
3 |
30 µg/ ml |
0.934 |
|
4 |
40 µg/ ml |
1.242 |
|
5 |
50 µg/ ml |
1.550 |
Table 4: Linearity study of APD on UV- Visible Spectometry
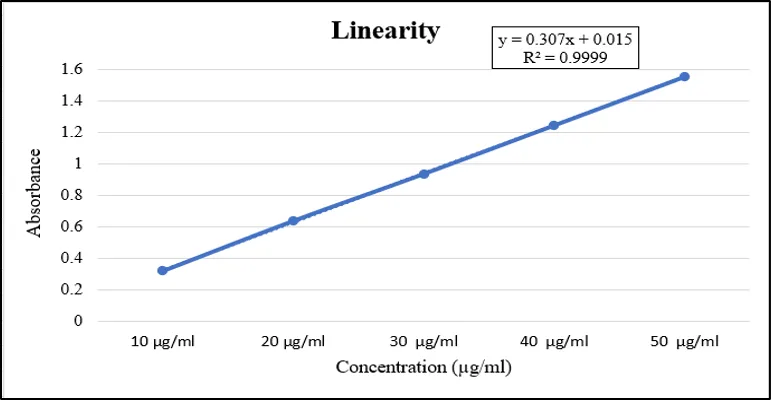
Figure 5: Linearity curve of APD on UV- Visible Spectometry
It can be seen from the linear regression analysis that a very good correlation exists between concentration and absorbance. The calibration graph shows a slope of 0.307 and intercept value of 0.015, and R2 = 0.9999 validates a very good linear correlation. It is seen that the value of the intercept is negligibly low, suggesting a very low level of background absorption, and the high regression coefficient implies that almost all variations in the absorbance are due to the variation in analyte concentration.
3.2 RP HPLC Method Development
RP HPLC method development was aimed at creating a fast, selective, and stability-indicating chromatographic method for accurate quantitation of APD in cream formulation. Method development was based on the use of various chromatographic columns with the same composition of the mobile phase and constant flow rate. Chromatographic properties were evaluated through the consideration of peak symmetry, peak sharpness, retention characteristics, and resolution.
At first, Kromasil C8 column was studied; however, poor peak definition and poor chromatographic characteristics were provided. Inertsil ODS column showed too long retention time of the analyte peaks. Agilent Eclipse XDB C18 column gave poor peak definition with poor peak characteristics. YMC Pack Pro C18 column significantly increased peak resolution, but additional modifications were necessary. The Prontosil Prontol C18 column provided sharp, symmetrical, and well-resolved peaks with high reproducibility and was chosen for further method validation.
|
Trial |
Column |
Mobile Phase |
Flow Rate |
Observation |
|
1 |
Kromasil C8 |
Buffer : Acetonitrile + Methanol (40:60) |
1 mL/min |
Not sharpen peaks |
|
2 |
Inertsil ODS |
Buffer : Acetonitrile + Methanol (40:60) |
1 mL/min |
Peaks appeared at longer retention time |
|
3 |
Agilent Eclipse XDB C18 |
Buffer : Acetonitrile + Methanol (40:60) |
1 mL/min |
Not clear peaks |
|
4 |
YMC Pack Pro C18 |
Buffer : Acetonitrile + Methanol (40:60) |
1 mL/min |
Peak resolution obtained |
|
5 |
Prontosil Prontol C18 |
Buffer : Acetonitrile + Methanol (40:60) |
1 mL/min |
Perfect sharp peaks with clear resolution |
Table 5: Trial for selection of Chromatographic column
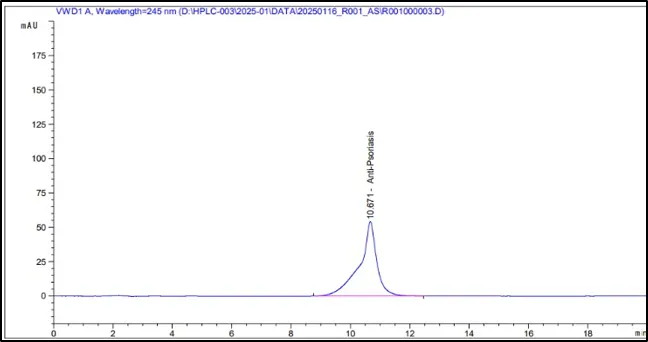
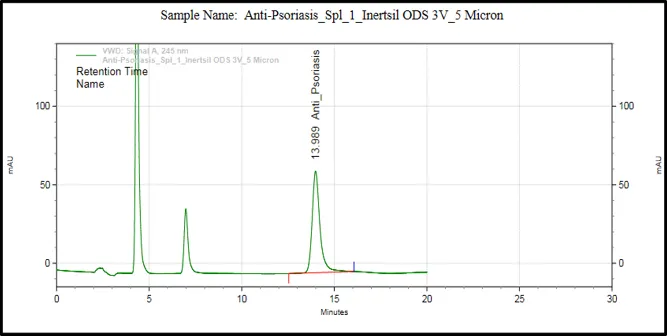
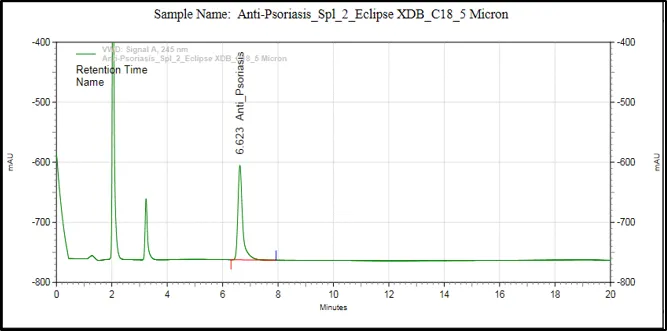
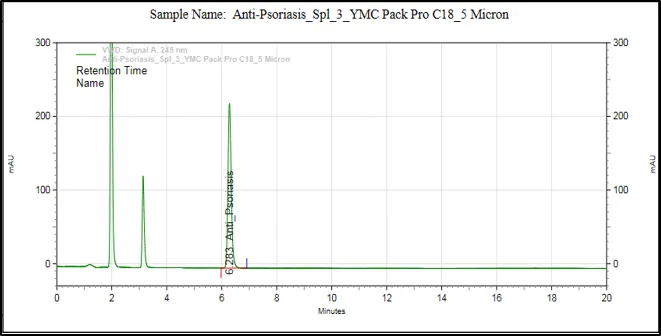
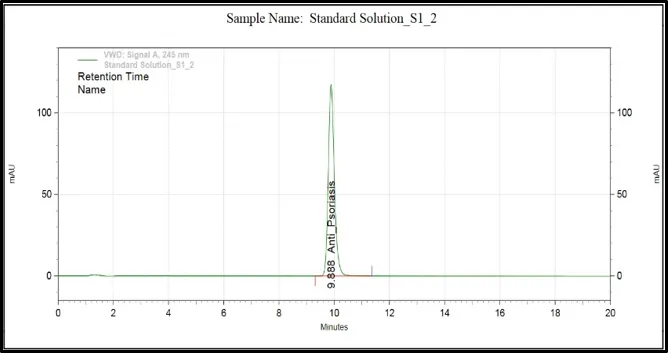
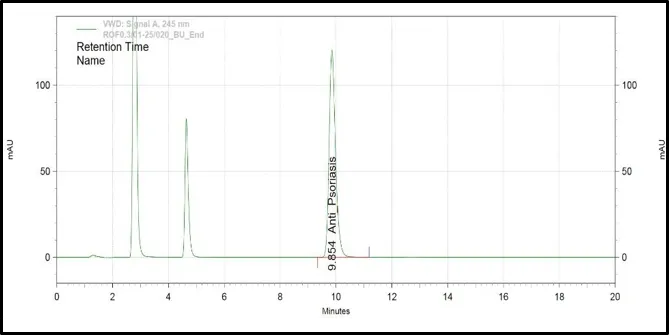
Figure 6: Chromatograms of selected HPLC columns used during the optimization of chromatography method: (A) Kromasil C8 column, (B) Inertsil ODS column, (C) Agilent Eclipse XDB C18 column, (D) YMC Pack Pro C18 column, (E) Prontosil ProntoSIL C18 column for APD formula, and (F) Prontosil ProntoSIL C18
It can be seen from the above optimization study that the Prontosil Prontol C18 column is better than the other columns that were studied in terms of providing good chromatographic efficiency. It has produced an ideal symmetrical peak, theoretical number of plates, adequate retention property and separation of APD from the other formulation components.
3.3 Optimized Chromatographic Conditions
After optimizing the conditions, the optimized condition for the RP-HPLC analysis for APD was determined. The optimized technique included the use of the Prontosil Prontol C18 analytical column with a mobile phase consisting of acetate buffer, acetonitrile, and methanol. The detection was done using wavelength of 245 nm and flow rate of 1.0 mL/min. With the optimized conditions, APD was eluted as a sharp and symmetrical peak at retention time of 9.87 minutes.
|
Parameter |
Optimized Condition |
|
HPLC System |
Agilent Technology Infinity 1100 |
|
Detector |
1100 VWD |
|
Column |
Prontosil Prontol C18 (150 × 4.6 mm, 5 µm) |
|
Mobile Phase |
Acetate Buffer : Acetonitrile + Methanol (40:60 v/v) |
|
Detection Wavelength |
245 nm |
|
Flow Rate |
1.0 mL/min |
|
Injection Volume |
10 µL |
|
Run Time |
20 min |
|
Retention Time |
9.87 min |
Table 6: Final Chromatographic Conditions
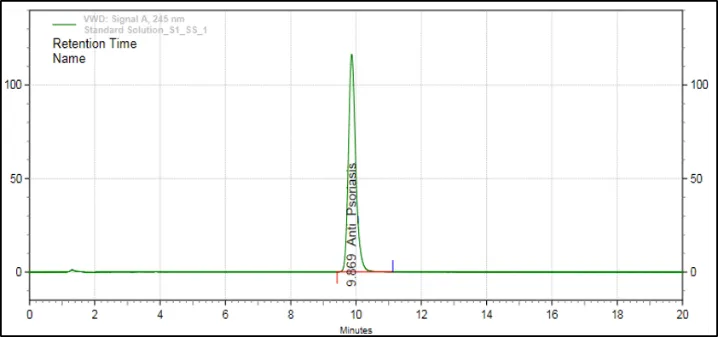
Figure 7: HPLC Graph of APD
The optimal conditions gave rise to well-resolved and highly symmetric chromatographic peaks with stable baseline. There were no interferences from formulation excipients or the solvent peak at the retention time of APD. The developed method thus met all the necessary chromatographic criteria for its validation according to ICH Q2(R1).
3.4 System Suitability Studies
Prior to the method validation, the system suitability tests were carried out to confirm the adequacy and suitability of the chromatographic system. The freshly prepared APD standard solution was injected using optimal chromatographic conditions and the system suitability criteria such as retention time, theoretical plates, tailing factor, capacity factor, and asymmetry factor were determined.
|
Parameter |
Acceptance Criteria |
Result |
|
Retention Time |
— |
9.87 min |
|
Theoretical Plates |
>3000 |
9516 |
|
Tailing Factor |
<2 |
0.896 |
|
Capacity Factor |
<1 |
0.58 |
|
Asymmetry Factor |
<2 |
1.21 |
Table 7: System Suitability Parameters
All acceptance criteria were met by the chromatographic system in an effective manner. The theoretical plate count of 9516 was a demonstration of high column efficiency whereas the tailing factor of 0.896 indicated high symmetry of the peak shape. Asymmetry factor of 1.21 further supported the absence of peak distortion while the retention time observed was always highly reproducible during the entire analysis. All these findings have clearly indicated that the chromatographic system had sufficient efficiency, reproducibility, and stability to perform quantitative analysis of APD. The favorable system suitability results have thus proved the efficacy of the developed RP HPLC method which can be used for the subsequent validations.
4. DISCUSSION
A stability-indicating reverse-phase high-performance liquid chromatography method was developed and validated for the quantification of APD in cream formulation. Method development entailed the meticulous optimization of various chromatographic parameters, such as selection of stationary phase, mobile phase, wavelength of detection, and flow rate, in order to optimize the performance of the chromatographic method. Of all the columns investigated, the Prontosil ProntoSIL C18 column showed superior chromatographic performance in terms of peak shape, resolution, and retention behavior of the analyte.
The developed method showed an excellent performance during the validation process as per ICH Q2(R1) guidelines. Calibration plot showed excellent linear relationship, with correlation coefficient more than 0.999, implying a proportional relationship between concentration of the analyte and detector response. Precisions were characterized by low relative standard deviation, implying the repeatability and intermediate precision of the method. Accuracy was ascertained by recovery experiments at various concentration levels. Robustness experiments indicated that the method is not affected by any minor variations in the chromatographic conditions. The system suitability parameters such as number of theoretical plates, tailing factor, and asymmetry factor met the acceptance criteria set out by the pharmacopoeias, thus ensuring the efficacy and consistency of the chromatographic system. In addition to this, the developed method was able to adequately separate APD from its possible degradants as well as the other formulation components, thus making it a stability-indicating method. This observation is in agreement with other published RP-HPLC methods for the analysis of topical formulations, but presents a much simpler, faster, and accurate method than those before it.
CONCLUSION
A simple, precise, accurate, robust, and stability indicating RP-HPLC method was successfully developed and validated for the quantitative estimation of APD in cream formulation. Optimization of chromatographic parameters led to the selection of Prontosil ProntoSIL C18 analytical column with optimized mobile phase which provided good separation, symmetry, retention time, and efficiency of the column. The developed analytical method satisfied all validation criteria required according to ICH Q2 (R1) guideline and showed very good specificity, linearity, accuracy, precision, robustness, and system suitability.
The stability indicating property of the developed method proved its ability to accurately estimate APD in presence of the formulation excipients and potential degradation products, thus making it a suitable technique for stability study and shelf life determination. The proposed method has shown high reproducibility and reliability. In comparison with conventional analytical methods, the current method has advantages such as simplicity of the sample preparation process, efficient chromatographic separation, reduced analytical complexity, and consistent analytical performance without reduction in accuracy and precision. In summary, the RP HPLC validation method is considered a useful method that can be used to measure APD cream formulations through routine assay determination, batch release testing, stability studies, and quality control. The presented procedure can be easily adopted by the pharmaceutical industry for quality control of the products. Further research could include the extension of this technique to other applications such as impurity profiling, forced degradation under various stress conditions, and simultaneous quantification of APD in combination topical creams.
REFERENCES

Om S. Dhule, Vaibhav Changediya, V. G. Rajurkar, A Stability-Indicating RP-HPLC Method For The Development And Validation Of APD Quantification In Cream Formulation, Int. J. Sci. R. Tech., 2026, 3 (7), 347-360. https://doi.org/10.5281/zenodo.21362050
 10.5281/zenodo.21362050