
We use cookies to ensure our website works properly and to personalise your experience. Cookies policy
Department of Pharmaceutical Quality Assurance, Samarth Institute Of Pharmacy, Belhe, On Kalyan Nagar Highway, Junnar, Pune 412410
A simple, precise, accurate, and stability-indicating Reverse Phase High Performance Liquid Chromatographic (RP-HPLC) method was developed and validated for the quantitative estimation of Fostemsavir in bulk drug and marketed tablet formulation. Chromatographic separation was achieved using a Hypersil BDS C18 column (250 mm × 4.6 mm, 5 µm particle size) with a mobile phase consisting of Acetonitrile and Phosphate Buffer (80:20 v/v) at a flow rate of 0.8 mL/min. Detection was carried out at 210 nm using a UV detector, and the retention time of Fostemsavir was found to be approximately 4.82 min. The developed method was optimized using a Quality by Design (QbD) approach employing Box–Behnken experimental design. The optimized chromatographic conditions showed good peak symmetry, satisfactory retention behavior, and excellent system suitability parameters. The method exhibited linearity in the concentration range of 50–90 µg/mL with a correlation coefficient (r²) of 1.000. Accuracy studies showed recovery in the range of 99.3–100.6%, confirming the accuracy of the method. Precision studies revealed %RSD values below 2%, indicating good repeatability and reproducibility. Robustness and ruggedness studies demonstrated that the method was unaffected by small deliberate changes in chromatographic conditions and analyst variation. The developed method was also validated for sensitivity with LOD and LOQ values of 0.035 µg/mL and 0.105 µg/mL, respectively. Forced degradation studies under acidic, alkaline, oxidative, thermal, and photolytic stress conditions confirmed the stability-indicating nature of the method. Assay of marketed formulation (RUKOBIA tablets containing 600 mg Fostemsavir) showed 100.05% purity, indicating suitability of the method for routine quality control analysis. Hence, the proposed RP-HPLC method was found to be simple, rapid, reliable, economical, and suitable for routine estimation of Fostemsavir in pharmaceutical dosage forms.
Human Immunodeficiency Virus (HIV) infection is still one of the major global health problems affecting millions of people worldwide. [1] Continuous research and development of antiretroviral drugs have improved the quality of life and survival rate of HIV patients. [2] Among the recently approved anti-HIV drugs, [3] Fostemsavir has gained significant importance because of its unique mechanism of action and effectiveness in heavily treatment-experienced HIV patients. [4]
Fostemsavir is a prodrug of Temsavir[5] and belongs to the class of HIV-1 attachment inhibitors. It was approved by the U.S. Food and Drug Administration in July 2020[6] for the treatment of multidrug-resistant HIV-1 infection in adults. [7] Chemically, Fostemsavir is known as (3R)-5-(6-amino-5-fluoro-2-methylpyrrolo[2,1-f][1,2,4]triazin-4-yl)-3-hydroxytetrahydrofuran-2-yl methyl phosphate. [8] The marketed formulation is available under the brand name Rukobia. [9] The drug works by preventing the attachment of HIV virus to CD4 immune cells, thereby blocking viral entry into the host cell. [10]
For pharmaceutical industries, development of a reliable analytical method is very important to ensure the quality, safety, and efficacy of drug products. [11] Reverse Phase High Performance Liquid Chromatography (RP-HPLC) is one of the most widely used analytical techniques for quantitative estimation of pharmaceutical compounds because of its accuracy, sensitivity, precision, and reproducibility. [12] A stability-indicating RP-HPLC method helps to separate the drug from its degradation products formed during stress conditions such as acidic, alkaline, oxidative, thermal, and photolytic degradation. Such methods are essential for stability studies and regulatory submissions. [13]
Nowadays, the Quality by Design (QbD) approach has become an important tool in pharmaceutical analytical method development. [14] QbD is a systematic and scientific approach that improves method performance by understanding the effect of different analytical variables on method quality. [15] It mainly focuses on method robustness, optimization, and risk assessment. [16] By implementing QbD principles, a more reliable and robust RP-HPLC method can be developed with reduced variability and improved analytical performance. [17]
Literature survey revealed that only limited analytical methods have been reported for the estimation of Fostemsavir in bulk drug and pharmaceutical dosage forms. Bharathi et al. developed a simple RP-HPLC method for quantitative estimation of Fostemsavir in tablet dosage form with satisfactory precision and accuracy. [18] Rao and Kumar reported a stability-indicating RP-HPLC method capable of separating the drug from its degradation products formed under stress conditions. [19] Patel et al. developed a rapid UPLC method for the estimation of Fostemsavir with reduced run time and improved sensitivity. [20] Smith et al. established an LC-MS/MS bioanalytical method for determination of Temsavir in human plasma during pharmacokinetic studies. [21] Reddy and Lakshmi reported a gradient RP-HPLC method for impurity profiling of Fostemsavir in bulk drug samples. [22] Sharma et al. developed a simple UV spectrophotometric method for routine analysis of Fostemsavir in pharmaceutical formulations. [23] Kumar et al. performed forced degradation studies to evaluate the stability behavior of Fostemsavir under acidic, alkaline, oxidative, thermal, and photolytic conditions. Mehta and Shah developed an HPTLC method for simultaneous estimation of Fostemsavir and related impurities in dosage forms. [24] Wilson et al. reported a validated chromatographic method for routine quality control analysis of Fostemsavir tablets. [25] Prasad et al. investigated a QbD-based RP-HPLC method for optimization of chromatographic conditions using Design of Experiments. [26] Nagaraju et al. developed an LC-UV method for determination of Fostemsavir during dissolution studies. [27] Chen et al. reported an impurity profiling method for detection and quantification of process-related impurities in Fostemsavir active pharmaceutical ingredient. [28] Joshi et al. developed a robust RP-HPLC method by applying Design of Experiments for better robustness and method performance. [29] David et al. established a bioequivalence analytical method for estimation of Temsavir concentration in biological samples [30], while Anitha et al. reported a stability-indicating analytical method for monitoring degradation kinetics of Fostemsavir under accelerated stability conditions. [31]
The present research work aims to develop a simple, accurate, precise, economical, and stability-indicating RP-HPLC method for the estimation of Fostemsavir in bulk drug and marketed formulation by implementing a Quality by Design approach. [32] The developed method will be validated according to International Council for Harmonisation guidelines for parameters such as accuracy, precision, linearity, specificity, robustness, limit of detection, and limit of quantification. [33]
MATERIALS AND METHODS
Drug samples: Brand: RUKOBIA; 600 mg Fostemsavir.
Chemicals and solvents: All the solvents and reagents used were HPLC grade or AR grades. Water, Methanol, Acetonitrile, and DMSO, ethanol, Sodium dihydrogen phosphate, di-sodium hydrogen phosphate, Hydrochloric acid, Hydrogen Peroxide, and Sodium Hydroxide.
Chromatographic instrumentation:
The chromatographic analysis was carried out using a Waters HPLC system equipped with Alliance 2695 separation module. The system consisted of a quaternary pump, auto sampler, and Ultra Violet (UV) detector. Data acquisition and processing were performed using Empower 3.0 and QbD software. Chromatographic separation was achieved on a Hypersil BDS C18 column (250 mm × 4.6 mm i.d., 5 µm particle size) manufactured by Thermo Scientific. The optimized chromatographic conditions provided good resolution, peak symmetry, and reproducible results for the estimation of Fostemsavir in bulk drug and marketed formulation.
Chromatographic conditions:
The chromatographic separation of Fostemsavir was carried out using a Waters HPLC system equipped with an Ultra-violet (UV) detector. The chromatographic data were processed using Empower software and Design Expert-13 software. Separation was achieved on a Hypersil BDS C18 column (250 mm × 4.6 mm i.d., 5 µm particle size). The optimized mobile phase consisted of Acetonitrile and Phosphate Buffer in the ratio of 80:20 v/v. The analysis was performed at a detection wavelength of 210 nm with a flow rate of 0.8 mL/min. The column temperature was maintained at 40°C and the injection volume was kept at 10 µL. These optimized chromatographic conditions provided good peak shape, better resolution, and satisfactory retention behavior for the analysis of the drug.
Selection of Detection Wavelength:
The sensitivity of HPLC method that uses UV detection depends upon proper selection of detection wavelength. An ideal wavelength is one that gives good response for the drugs that are to be detected. For good response, optimization of wavelength was done at different wavelengths by UV detector. In the present study, drug solutions of 10μg/ml of each of Fostemsavir were prepared in methanol. After observing UV spectra of the drug, wavelength of 210 nm was selected for further study.
Preparation of Phosphate Buffer pH 7.0
Weigh 1.14gm of Sodium dihydrogen phosphate and 1.49gm of di-sodium hydrogen phosphate in 1000ml HPLC Grade water. Adjust to pH 7.0 with diluted phosphoric acid or NaOH. Filtered through 0.45µm membrane filter.
Mobile Phase Preparation
Prepare mobile phase by taking Acetonitrile and Phosphate Buffer in various proportion, ACN: Phosphate Buffer, 80: 20. Mobile phase was degassed by sonication for 20 min.
Preparation of standard solutions (100ppm):
Accurately 10.0 mg weighed quantity of Fostemsavir was transferred to 10.0 mL volumetric flask. That was dissolved by adding 5.0 mL mobile phase and then the drug solution was diluted up to the mark with mobile phase to get the stock solution of 1000 µg/mL of Fostemsavir. The working standard solutions of these drugs were obtained by appropriate dilution of the respective stock solution with mobile phase.
Optimization of RP-HPLC Method
Based on drug solubility, stability and suitability of drug in different solvents, various mobile phases and compositions were tried to get a good resolution and sharp peak. The standard solution containing drugs were run in different mobile phases. For selection of mobile phase, various mobile phase compositions containing methanol, acetonitrile, Phosphate Buffer and water in different ratios were tried.
The following mobile phases were tried,
a) Methanol: water [85:15 % v/v]
b) ACN: Water [80: 20 % v/v]
c) ACN: Phosphate Buffer [80: 20 % v/v]
d) ACN: Methanol: Phosphate Buffer [70: 20:10 % v/v/v]
Each mobile phase was filtered through 0.45 µm membrane filter and degassed by sonication for 20 min. From the various mobile phases tried, mobile phase containing methanol and acetonitrile in gradient program was selected, since it gave sharp peaks with symmetry within limits and significant retention times for drugs.
Method design by QbD Approach
Applying three levels Box Behnken experimental design with three central points as stated in Table 09. Critical Quality Attributes (CQA) defined for the present method were ACN: Phosphate Buffer concentration (X1), and Flow Rate (X2). The level of above said CQA were as given in table
|
Level of Variable |
Factor |
|
|
Mobile Phase Composition % (ACN: Phosphate Buffer) |
Flow Rate (mL/min) |
|
|
Low Level (-1) |
70:30 |
0.8 |
|
Medium Level (0) |
80:20 |
1.0 |
|
High Level (1) |
90:10 |
1.2 |
Table No 5: Translation of coded levels in actual values
From given input ranges of the CQA in the Box Behnken experimental design software, which provides eleven trials output, that data was given in Table 06.
|
Std |
Run |
Factor-1 A: Mobile Composition |
Factor-2 B: Flow rate ml/min |
|
1 |
1 |
70:30 |
0.8 |
|
9 |
2 |
80:20 |
1.0 |
|
4 |
3 |
90:10 |
1.2 |
|
11 |
4 |
80:20 |
1.0 |
|
5 |
5 |
70:30 |
1.0 |
|
6 |
6 |
90:10 |
1.0 |
|
8 |
7 |
80:20 |
1.2 |
|
10 |
8 |
80:20 |
1.0 |
|
3 |
9 |
70:30 |
1.2 |
|
7 |
10 |
80:20 |
0.8 |
|
2 |
11 |
90:10 |
0.8 |
Table No 6: Layout of Actual Design of DOE
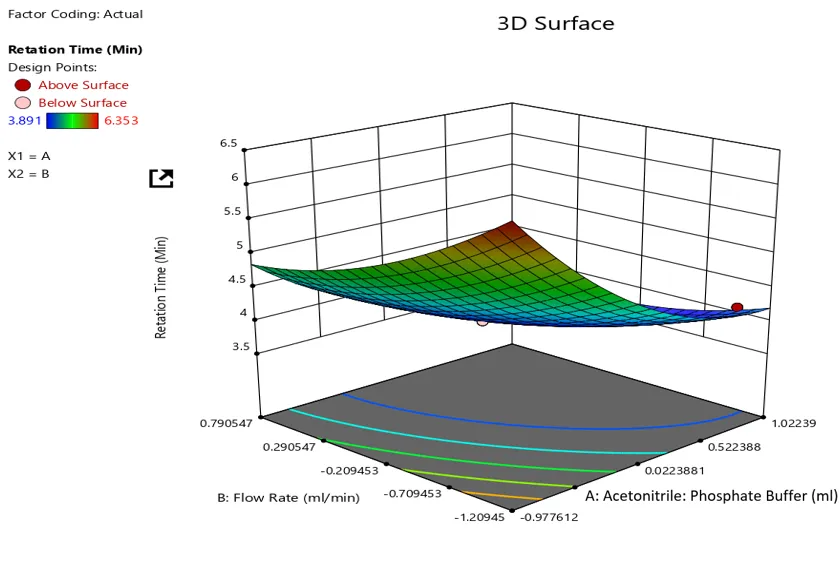
Response plot of retention time (min) against flow rate and mobile phase composition
The Model F-value of 3.24 implies there is a 9.31% chance that an F-value this large could occur due to noise.
P-values less than 0.0500 indicate model terms are significant. In this case there are no significant model terms. Values greater than 0.1000 indicate the model terms are not significant. If there are many insignificant model terms (not counting those required to support hierarchy), model reduction may improve your model.
Final Equation in Terms of Coded Factors:
Theoretical plate =+6469.00 -1332.25*A -473.75*B+130.00 *C 309.00*AB+95.00*AC+957.50 *BC-1115.75*A2+460.25B2+474.25*
The equation in terms of coded factor can used to make prediction about the response for given level of each factor. By default, the high level of the factors are coded as +1 and the low levels of the factors are coded as -1. The coded equation is useful for identifying the relative impact of the factors by comparing the factor coefficients.
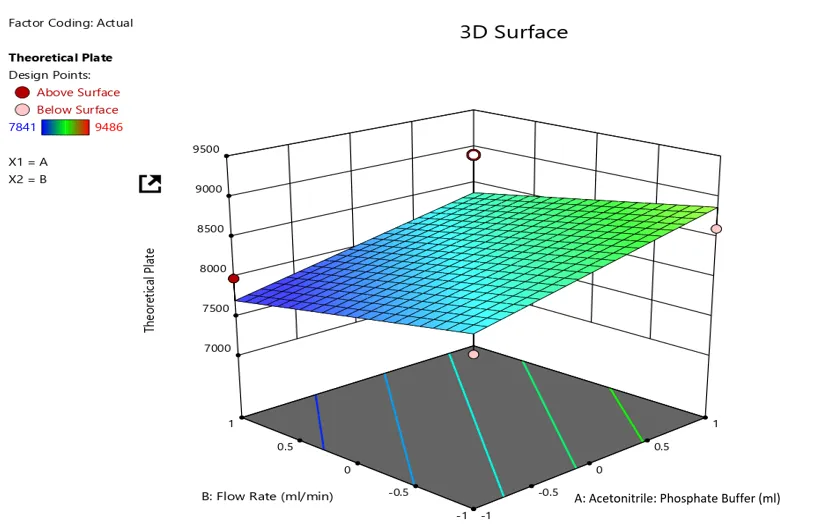
Response plot of Theoretical plate (unit) against flow rate and mobile phase composition
The Model F-value of 2.77 implies the model is not significant relative to the noise. There is a 12.07% chance that an F-value this large could occur due to noise.
P-values less than 0.0500 indicate model terms are significant. In this case there are no significant model terms. Values greater than 0.1000 indicate the model terms are not significant. If there are many insignificant model terms (not counting those required to support hierarchy), model reduction may improve your model.
The Lack of Fit F-value of 35.14 implies the Lack of Fit is significant. There is only a 2.79% chance that a Lack of Fit F-value this large could occur due to noise. Significant lack of fit is bad -- we want the model to fit.
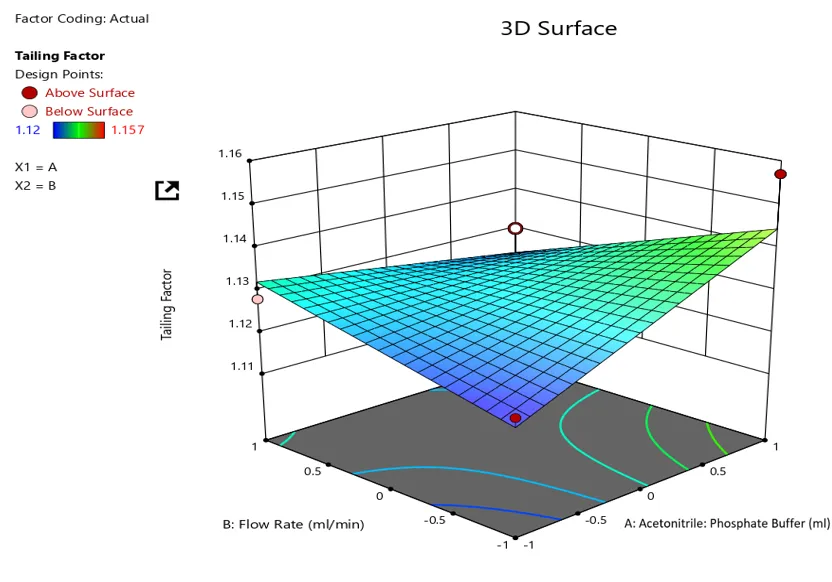
Response plot for asymmetric factor against mobile phase composition and flow rate
Tailing factor = +1.01 – 1.250E-003*A+0.000*B-1.250E-003*C-0.013*AB-5.000E 0005*AC+2.500E-003*BC-0.048*A2 -0.010*B2+7.500E-003*C2
The equation in terms of coded factor can used to make prediction about the response for given level of each factor. By default, the high level of the factors are coded as +1 and the low levels of the factors are coded as -1. The coded equation is useful for identifying the relative impact of the factors by comparing the factor coefficients.
Obtained solution for optimized formulation
|
Code |
ACN to Phosphate Buffer |
Flow Rate |
Retention Time |
Tailing Factor |
Theoretical Plate |
Desirability |
|
C10 |
80:20 |
0.8 |
4.833 |
1.124 |
7876 |
1.0 |
Validation of Developed HPLC Method
The test for system suitability was performed for Fostemsavir with an optimized chromatographic condition as given in table. The results obtained in terms of percent RSD for retention time and peak area were evaluated for their acceptance criteria as per ICH Q2R1 guidelines.
The column efficiency for TMN peak should not be less than 2000 theoretical plates.
The tailing factor for peak, should not be more than 2.0.
% CV for area shall NMT 2 for peak area and for RT NMT 0.5%
|
HPLC |
Waters System |
|
Detector |
Ultra-violet (UV) detector |
|
Software |
Empower and Design Expert-13 |
|
Column |
Hypersil BDS C18 |
|
Particle size packing |
250mm x 4.6ID, Particle size: 5 micron |
|
Mobile phase |
Acetonitrile: Phosphate Buffer (80:20) |
|
Detection Wavelength |
210 |
|
Flow Rate |
0.8 |
|
Temperature |
400C |
|
Sample size |
10 μl |
Table: Optimized Chromatographic Conditions
Linearity of an analytical method is its ability to elicit test results that are directly or by a well-defined mathematical transformation, proportional to the concentration of analyte in samples within a given range.
Determination
The linearity of the analytical method is determined by mathematical treatment of test results obtained by analysis of samples with analyte concentrations across the claimed range. Area is plotted graphically as a function of analyte concentration. Percentage curve fittings are calculated.
Acceptance Criteria:
The plot should be linear passing through the origin.
Correlation Coefficient should not be less than 0.999.
Preparation of linearity solution:
Linearity was performed by diluting standard stock solution. From stock solution aliquots of 5,6,7,8 and 9 ml was taken and diluted to 10ml with diluent such that the final concentration of Fostemsavir in the range of 50 to 90μg/ml. Then 10µl of each concentration solution was injected by using set parameters (ACN: Phosphate Buffer (80:20) Mobile Phase, 0.8ml/min Flow rate, 210nm Wavelength)
Samples are prepared normally covering 50 % to 150 % of the nominal sample preparation concentration. These samples are analyzed and the recoveries of each are calculated. For this study, prepare three preparations of each 50 %, 100 % and 150 % level and inject in to the chromatography. Make the injection lowest concentration to highest concentration. Calculate individual recovery, mean recovery and %RSD.
Acceptance Criteria:
Individual and mean % recovery should be within 98.0 % to 102.0 %.
Precision of an analytical method is the degree of agreement among individual test results when the procedure is applied repeatedly to multiple Samplings of a homogenous sample. Precision of an analytical method is usually expressed as standard deviation or relative standard deviation.
Intraday and Interday Precision:
Intraday precision study was carried out by preparing test solution of same concentration and analyzing it at three different times in a day. The same procedure was followed for three different days to determine interday precision. The result was reported as %RSD. The precision result showed a good reproducibility with percent relative standard deviation less than 2.
Repeatability:
Repeatability precision study was carried out by preparing test solution of same concentration and analyzing it at five different times. The result was reported as %RSD. The precision result showed a good reproducibility with percent relative standard deviation less than 2.
Ruggedness should be used as a parameter evaluating constancy of the results when external factors such as analyst, laboratory, instrument, reagents and days are varied.
The effect of small deliberate change in optimized method was studied by robustness evaluation. To evaluate robustness of the developed method, parameter was deliberately varied. These parameter included variation of flow rate, variation of Temperature, variation of Mobile Phase ratio and variation of wavelength. Factor selected was changed at two levels, for change in the flow rate in ml/min, change in column temperature in 0C., change in mobile phase in percentage concentration and change in wavelength in nm. In significant differences in peak areas and less variability in retention time were observed.
Effect of variation in Flow rate
A study was conducted to determine the effect of change in flow rate. Test solution prepared as per the test method and injected 3 concentrations of test solution into HPLC system with flow rate 0.6 ml/min. and 1.0 ml/min. The system suitability parameters were evaluated as per the test method.
Effect of variation in Wavelength
A study was conducted to determine the effect of change in wavelength. Test solution prepared as per the test method and injected 3 concentrations of test solution into HPLC system with wavelength of 205 nm and 215 nm. The system suitability parameters were evaluated as per the test method.
Effect of variation in Temperature
A study was conducted to determine the effect of change in column Temperature. Test solution prepared as per the test method and injected 3 concentrations of test solution into HPLC system with column Temperature 350C and 450C. The system suitability parameters were evaluated as per the test method.
Effect of variation in Ratio of Mobile Phase
A study was conducted to determine the effect of change in Ratio of Mobile Phase. Test solution prepared as per the test method and injected 3 concentrations of test solution into HPLC system with Mobile Phase ACN: Phosphate Buffer 70:30 and ACN: Phosphate Buffer 90:10. The system suitability parameters were evaluated as per the test method.
The detection limit of an individual analytical procedure is the lowest amount of analyte in a sample which can be detected but not necessarily quantified as an exact value. Limits are prescribed as percentage or as parts per million. The limit of detection will not only depend on the procedure of analysis but also on type of instrument. A signal-to-noise ratio between 3:1 or 2:1 is generally considered acceptable for estimating the detection limit. It may be calculated based on standard deviation (SD) of the response and slope of the curve(S).
LOD= 3.3 (SD)/ S
Where, SD = Standard deviation,
S = Slope of the curve.
The quantitation limit of an individual analytical procedure is the lowest amount of analyte in a sample which can be quantitatively determined with suitable precision and Accuracy. It is expressed as the conc. of analyte (e.g., percentage, parts per billion) in the sample. A typical signal-to-noise ratio is 10:1 or 20:1.
The S/N ratio should not less than 10.
It may be calculated based on standard deviation (SD) of the response and slope of the curve(S).
LOQ= 10 (SD)/S
Where, SD = Standard deviation,
S = Slope of the curve.
Acid induced-degradation
10.0 mg Fostemsavir was transferred to 100.0 mL volumetric flask, added 50.0 mL mobile phase, sonicated for 20.0 min., volume was made up to the mark with mobile phase. From this stock solution take 5 ml of solution into 20 ml volumetric flask then add 10 ml of mobile phase and then add 1 ml of 1N HCl and stressed the samples at condition mentioned in Table No.10 in water bath, cooled at room temperature and neutralize of acid with base of same concentration and volume. Make up the volume with mobile phase and mixed. Filter the solution through 0.45 µ membrane filter and filtrate use as such. Then these filtrates were chromatographed under optimized chromatographic system.
Base induced-degradation
10.0 mg Fostemsavir was transferred to 100.0 mL volumetric flask, added 50.0 mL mobile phase, sonicated for 20.0 min., volume was made up to the mark with mobile phase. From this stock solution take 5 ml of solution into 20 ml volumetric flask then add 10 ml of mobile phase and then add 1 ml of 1N NaOH and stressed the samples at condition mentioned in Table No.10 in water bath, cooled at room temperature and neutralize of acid with base of same concentration and volume. Make up the volume with mobile phase and mixed. Filter the solution through 0.45 µ membrane filter and filtrate use as such. Then these filtrates were chromatographed under optimized chromatographic system.
Hydrogen Peroxide- induced degradation
10.0 mg Fostemsavir was transferred to 100.0 mL volumetric flask, added 50.0 mL mobile phase, sonicated for 20.0 min., volume was made up to the mark with mobile phase. From this stock solution take 5 ml of solution into 20 ml volumetric flask then add 10 ml of mobile phase and then add 1 ml of 3% w/v H2O2 and stressed the samples at condition mentioned in Table No.10 in water bath, cooled at room temperature and neutralize of Methanol of same concentration and volume. Make up the volume with mobile phase and mixed. Filter the solution through 0.45 µ membrane filter and filtrate use as such. Then these filtrates were chromatographed under optimized chromatographic system.
Thermal degradation
Fostemsavir sample was taken in petriplate and kept in an oven maintained at 500C temperature for 3 hr. 10 mg of the above sample was dissolved in and diluted with Methanol in order to make the volume up to 10 ml. The solution were diluted with the mobile phase to reach a final concentration of 50 μg/ml. The chromatograms were run by injecting the sample in the column.
Photolytic degradation
Sample of Fostemsavir was exposed to both cool white fluorescent and near ultraviolet lamp in photo stability chamber. Ten milligrams sample was dissolved in Mobile phase and volume made up to 10 ml. From this solution appropriate dilution was made using mobile phase and injected in stabilized chromatographic condition
|
Test Condition |
Acid stress |
Alkali stress |
Peroxide stress |
Thermal stress |
Photolytic degradation |
|
Fostemsavir |
1N HCl, 8 h at 600 c |
1N NaOH, 8 h at 600 c |
3%H2O2, 24h |
Thermal stress for 3 h at 500c |
Photolytic degradation product for 8 h |
Table: Force degradation study
Twenty tablets were weighed accurately and the average weight was determined. The tablet was further crushed; powder equivalent to 100 mg of Fostemsavir was transferred to a 100 ml volumetric flask and dissolved in mobile phase. An aliquot of 5 ml was withdrawn from the above solution into 100ml volumetric flask and the final solution was filtered by using 0.45 µ membrane filter to get concentration of 50μg/ml. The solution was analyzed by HPLC with same chromatographic condition as linearity. The mean of 3 different assay were used for calculation.
RESULTS AND DISCUSSION:
Analytical Validation of proposed HPLC method
|
Sr. No. |
Parameter |
Mean observations |
SD |
%RSD |
Acceptance criteria |
Inference |
|
1 |
Peak Area |
1914746 |
2687.210 |
0.154 |
< 2 |
Pass |
|
2 |
RT |
4.8268 |
0.0004 |
0.008 |
< 0.5 |
Pass |
|
3 |
T. plates |
7876 |
85.273 |
0.909 |
> 2000 |
Pass |
|
4 |
Tailing factor |
1.124 |
0.0008 |
0.079 |
< 2 |
Pass |
Observations for system suitability testing of Fostemsavir
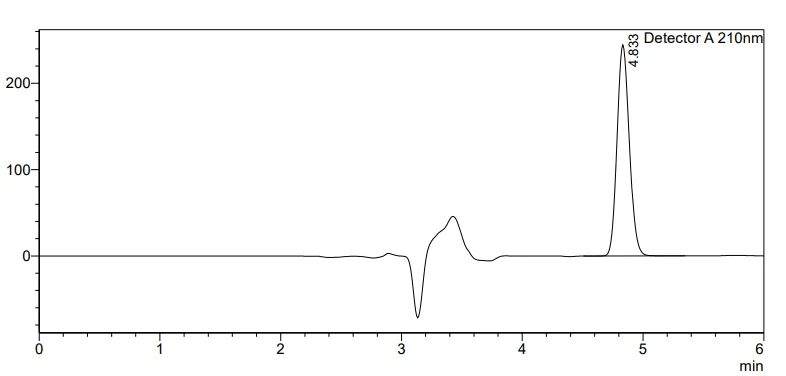
Graph: Representative chromatogram of Fostemsavir observed in SST study
Drug was found to be linear in the concentration range of 50-90 μg/ml.
|
Sr. No. |
Fostemsavir Conc. (ppm) |
Time |
Peak Area |
Theoretical Plates |
Tailing Factor |
|
1 |
50 |
4.828 |
1910438 |
9486 |
1.124 |
|
2 |
60 |
4.827 |
2298732 |
9357 |
1.123 |
|
3 |
70 |
4.827 |
2674642 |
9245 |
1.124 |
|
4 |
80 |
4.829 |
3060952 |
9369 |
1.124 |
|
5 |
90 |
4.832 |
3438921 |
9456 |
1.123 |
Table: Data of calibration curve of Fostemsavir by HPLC method
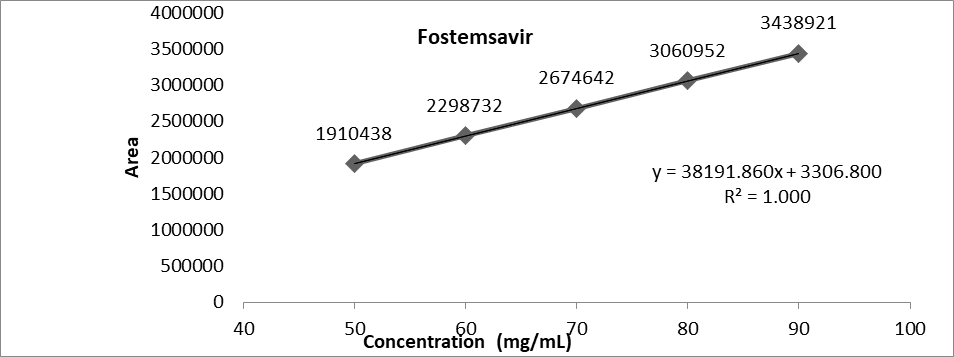
Graph No.25: Linearity graph of Fostemsavir
Data Interpretation: The method was found to be linear for Fostemsavir. The correlation coefficient of the plot was found to be 1.000.
Optical characteristics
|
Sr. No. |
Parameters |
HPLC method |
|
1 |
λmax |
210 |
|
2 |
Linearity |
50-90 |
|
3 |
Regression equation[y] |
y = 38191.860x + 3306.800 |
|
4 |
Slope[m] |
38191.860 |
|
5 |
Intercept [c] |
3306.800 |
|
6 |
Correlation coefficient [r2] |
1.000 |
|
7 |
Limit of detection (LOD) |
0.035 |
|
8 |
Limit of quantitation (LOQ) |
0.105 |
Table: Optical characteristics for Fostemsavir
Accuracy was studied by standard addition method and % recovery found was within acceptable limit.
|
Level of addition |
Standard added (μg/ml) |
Conc. (μg/ml) |
Total Conc. (μg/ml) |
Area Obtained |
Std Area |
Drug recovered (μg/ml) |
% Recovery |
|
50% |
5 |
10 |
15 |
573129 |
572910 |
15.00 |
100.0 |
|
5 |
10 |
15 |
569842 |
14.91 |
99.4 |
||
|
5 |
10 |
15 |
575761 |
15.07 |
100.5 |
||
|
100% |
10 |
10 |
20 |
764175 |
762924 |
20.00 |
100.0 |
|
10 |
10 |
20 |
758977 |
19.86 |
99.3 |
||
|
10 |
10 |
20 |
765620 |
20.04 |
100.2 |
||
|
150% |
15 |
10 |
25 |
955218 |
956272 |
25.00 |
100.0 |
|
15 |
10 |
25 |
952972 |
24.94 |
99.8 |
||
|
15 |
10 |
25 |
960627 |
25.14 |
100.6 |
Table No. 24: Data for recovery study of Lenacapavir by HPLC method
The % RSD for repeatability for Fostemsavir based on six times the measurement of the same concentration (50 μg/ml) was found to be less than 2.
|
S. N. |
Conc (μg/ml) |
Peak Area |
% Assay |
Average |
SD |
%RSD |
|
1 |
50 |
1910403 |
99.99 |
101.25 |
1.999 |
1.974 |
|
2 |
1967432 |
102.79 |
||||
|
3 |
1895362 |
98.93 |
||||
|
4 |
1965340 |
103.13 |
||||
|
5 |
1903497 |
99.48 |
||||
|
6 |
1972342 |
103.23 |
Table: Repeatability of Fostemsavir
|
Sr. No. |
Conc μg/ml |
0 Hours |
2 Hours |
4 Hours |
Mean |
SD |
%RSD |
|
Peak Area |
Peak Area |
Peak Area |
|||||
|
1 |
50 |
1910438 |
1938688 |
1899463 |
1916196 |
20236.575 |
1.056 |
|
2 |
60 |
2246553 |
2249832 |
2303452 |
2266612 |
31946.185 |
1.409 |
|
3 |
70 |
2686322 |
2656873 |
2674642 |
2672612 |
15811.96 |
0.595 |
Table: Data for intraday precision of Fostemsavir by HPLC method
|
Sr. No. |
Conc μg/ml |
1 Day |
2 Day |
3 Day |
Mean |
SD |
%RSD |
|
Peak Area |
Peak Area |
Peak Area |
|||||
|
1 |
50 |
1964832 |
1976398 |
1912325 |
1951185 |
34147.00 |
1.75 |
|
2 |
60 |
2210837 |
2284215 |
2287381 |
2260811 |
43307.69 |
1.92 |
|
3 |
70 |
2629470 |
2687387 |
2654647 |
2682603 |
29040.68 |
1.09 |
Table: Data for interday precision of Fostemsavir by HPLC method
Robustness was studied by different deliberate variations in the chromatographic conditions.
|
Sr. No. |
Parameter |
Condition |
Area |
Mean |
SD |
%RSD |
|
1 |
Change in Flow rate (ml/min) |
0.6 |
1978649 |
1973384 |
13320.58 |
0.68 |
|
2 |
0.8 |
1958236 |
||||
|
3 |
1.0 |
1983268 |
||||
|
1 |
Change in Wavelength (nm) |
205 |
1998378 |
1971240 |
26179.01 |
1.33 |
|
2 |
210 |
1946139 |
||||
|
3 |
215 |
1969203 |
||||
|
1 |
Change in Temperature (0C) |
35 |
1907132 |
1909926 |
18226.86 |
0.95 |
|
2 |
40 |
1929389 |
||||
|
3 |
45 |
1893258 |
||||
|
1 |
Change in Mobile phase ratio |
70:30 |
1958361 |
1972778 |
22527.90 |
1.14 |
|
2 |
80:20 |
1998738 |
||||
|
3 |
90:10 |
1961235 |
Table: Data for Robustness study of Fostemsavir by HPLC method
Ruggedness was studied by different analyst.
|
Sr. No. |
Analyst |
Conc. (μg/ml) |
Area |
Mean Area |
SD |
% RSD |
|
1 |
Analyst-1 |
50µg/ml |
1934653 |
1966244 |
32052.03 |
1.63 |
|
1965342 |
||||||
|
1998738 |
||||||
|
2 |
Analyst-2 |
50µg/ml |
1965476 |
1976999 |
18361.09 |
0.93 |
|
1998173 |
||||||
|
1967348 |
Table: Data for ruggedness study of Fostemsavir by HPLC method
|
Drugs |
LOD (µg/ml) |
LOQ (µg/ml) |
|
Fostemsavir |
0.035 |
0.105 |
Table: Results of LOD and LOQ values of Fostemsavir
|
|
Acid stress |
Alkali stress |
Peroxide stress |
Thermal stress |
Photolytic stress |
|
% Recovered |
96.98% |
93.35% |
90.23% |
99.66% |
99.34% |
|
% Degradation |
3.02% |
6.65% |
9.77% |
0.34% |
0.66% |
Table: Results of Forced Degradation Studies for Fostemsavir
|
Marketed Formulation |
Label Claim |
Observed amount (mg) |
% Assay |
|
RUKOBIA |
600 mg Fostemsavir |
600.31 |
100.05 |
CONCLUSION
The present study successfully developed and validated a simple, rapid, accurate, precise, and stability-indicating RP-HPLC method for the estimation of Fostemsavir in bulk drug and marketed tablet dosage form. The chromatographic conditions consisting of Acetonitrile: Phosphate Buffer (80:20 v/v) as mobile phase, Hypersil BDS C18 column, flow rate of 0.8 mL/min, and detection wavelength of 210 nm provided satisfactory peak resolution and reproducible results.
Application of the QbD approach using Box–Behnken design enabled systematic optimization of chromatographic parameters and established the robustness of the analytical method. Validation studies performed according to ICH Q2(R1) guidelines demonstrated excellent linearity, accuracy, precision, robustness, ruggedness, specificity, and sensitivity. The low LOD and LOQ values indicated high sensitivity of the developed method.
Forced degradation studies confirmed that the method could effectively separate degradation products from the drug peak, proving its stability-indicating capability. Assay results of marketed formulation demonstrated that the method is suitable for routine quality control analysis of Fostemsavir tablets. Therefore, the developed RP-HPLC method can be effectively employed for routine analysis, stability studies, and quality assurance of Fostemsavir in pharmaceutical industries and research laboratories.
ACKNOWLEDGEMENT
The authors express sincere gratitude to the management and faculty members of the respective institute for providing the necessary laboratory facilities and continuous support to carry out this research work successfully. The authors are also thankful to the suppliers of Fostemsavir reference standard and to the technical staff of the analytical laboratory for their valuable assistance during the experimental work. Special thanks are extended to colleagues and friends for their encouragement and cooperation throughout the study.
CONFLICT OF INTEREST
The authors declare that there is no conflict of interest regarding the publication of this research work. The study was carried out independently without any financial or commercial influence that could affect the outcome of the research.
REFERENCES


Sawant Rushika Ratnadeep*, Kajal Walunj, Stability Indicating RP HPLC Method Development And Validation Of Fostemsavir In Bulk Drug And Marketed Formulation By Implementing A Quality By Design Approach, Int. J. Sci. R. Tech., 2026, 3 (6), 1545-1561. https://doi.org/10.5281/zenodo.20924615
 10.5281/zenodo.20924615