

We use cookies to ensure our website works properly and to personalise your experience. Cookies policy
MMLT (Medical Laboratory Technology) – Medical Hematology, SAM Global University, Agariya Chopra, District Raisen, Bhopal, Madhya Pradesh, India.
Background: Hemoglobin (Hb) and red cell indices are routinely used together in the laboratory assessment of red blood cell abnormalities. MCV, MCH, MCHC and RDW provide complementary information about cell size, hemoglobin content and variation in red-cell size. Aim: To assess the correlation of hemoglobin with MCV, MCH, MCHC and RDW in retrospective CBC records. Materials and Methods: This retrospective observational study was conducted at Chirayu Hospital over approximately 2.5 months, from the last week of June through August. A total of 115 CBC records were evaluated. Testing was performed using Mindray BC-6800Plus 5-Part Differential Auto Hematology Analyzer and Mindray BC-6800 Auto Hematology Analyzer. Descriptive statistics and Pearson correlation were used. Results: Of 115 records, 58 (50.4%) were male and 57 (49.6%) were female. Mean age was 32.04 ± 12.61 years. Mean Hb was 10.90 ± 2.28 g/dL. Hb showed positive correlation with MCV (r=0.337), MCH (r=0.393) and MCHC (r=0.266), and negative correlation with RDW (r=-0.506); all associations were statistically significant (p<0.05). Conclusion: Hb was significantly associated with the evaluated red cell indices. Interpretation of these parameters together can improve the laboratory description of red-cell patterns.
Hemoglobin is the principal oxygen-carrying protein in erythrocytes and is one of the most frequently interpreted parameters in a complete blood count. A change in hemoglobin concentration may occur with several hematological conditions, but its interpretation is strengthened by red cell indices.
MCV reflects average red-cell volume, MCH reflects the average hemoglobin content per red cell, MCHC expresses hemoglobin concentration within red cells, and RDW reflects variability in red-cell size. Together these indices assist in describing microcytic, normocytic and macrocytic patterns.
The present study was undertaken to examine the relationship of Hb with MCV, MCH, MCHC and RDW in 115 retrospective CBC records.
To study the correlation of hemoglobin with MCV, MCH, MCHC and RDW among patients undergoing CBC testing.
Study design: Retrospective observational study.
Study period: Last week of June to August (approximately 2.5 months).
Sample size: 115 CBC records.
Laboratory analyzers: Mindray BC-6800Plus 5-Part Differential Auto Hematology Analyzer and Mindray BC-6800 Auto Hematology Analyzer.
Data collection: Demographic and CBC parameters were obtained from available laboratory records. Patient IDs were used for dataset organization.
Statistical analysis: Continuous variables were summarized as mean ± SD. Pearson correlation coefficient was used to evaluate relationships between Hb and each red cell index. p<0.05 was considered statistically significant.
Ethical considerations: Ethics committee approval, waiver or exemption should be reported according to the actual institutional documentation before journal submission. No approval number is stated here without verification.
A total of 115 records were analyzed. The dataset contained 58 male and 57 female records. Age ranged from 13 to 73 years.
|
Variable |
Result |
|
Total |
115 |
|
Male |
58 (50.4%) |
|
Female |
57 (49.6%) |
|
Mean age |
32.04 ± 12.61 years |
|
Mean Hb |
10.90 ± 2.28 g/dL |
5.1 Descriptive statistics
|
Parameter |
Mean ± SD |
Minimum |
Maximum |
|
Hb |
10.90 ± 2.28 |
6.1 |
15.9 |
|
MCV |
84.32 ± 10.78 |
59.4 |
124.0 |
|
MCH |
27.34 ± 3.97 |
18.4 |
43.0 |
|
MCHC |
32.32 ± 1.96 |
25.4 |
41.1 |
|
RDW |
16.34 ± 3.23 |
12.0 |
27.7 |
5.2 Correlation analysis
|
Index |
Pearson r |
p-value |
Direction |
|
MCV |
0.337 |
<0.001 |
Positive |
|
MCH |
0.393 |
<0.001 |
Positive |
|
MCHC |
0.266 |
0.004 |
Positive |
|
RDW |
-0.506 |
<0.001 |
Negative |
5.3 Figures
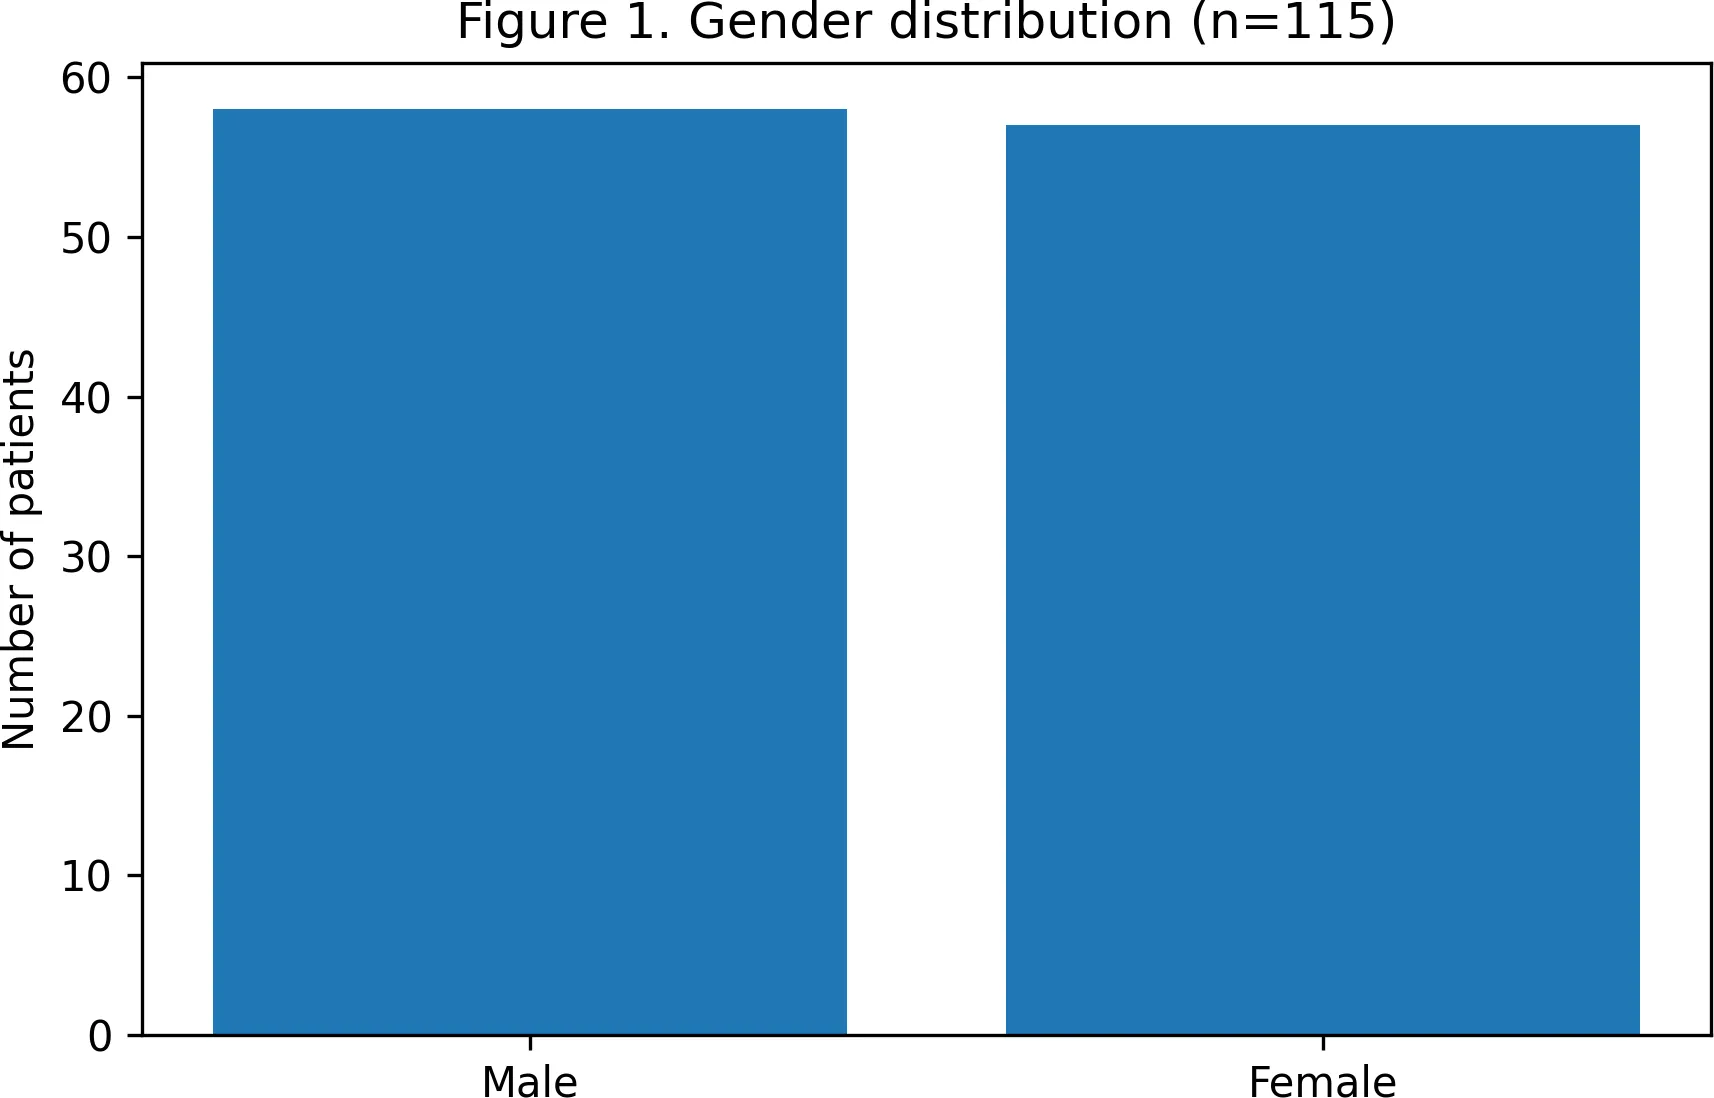
Figure 1. Gender distribution.
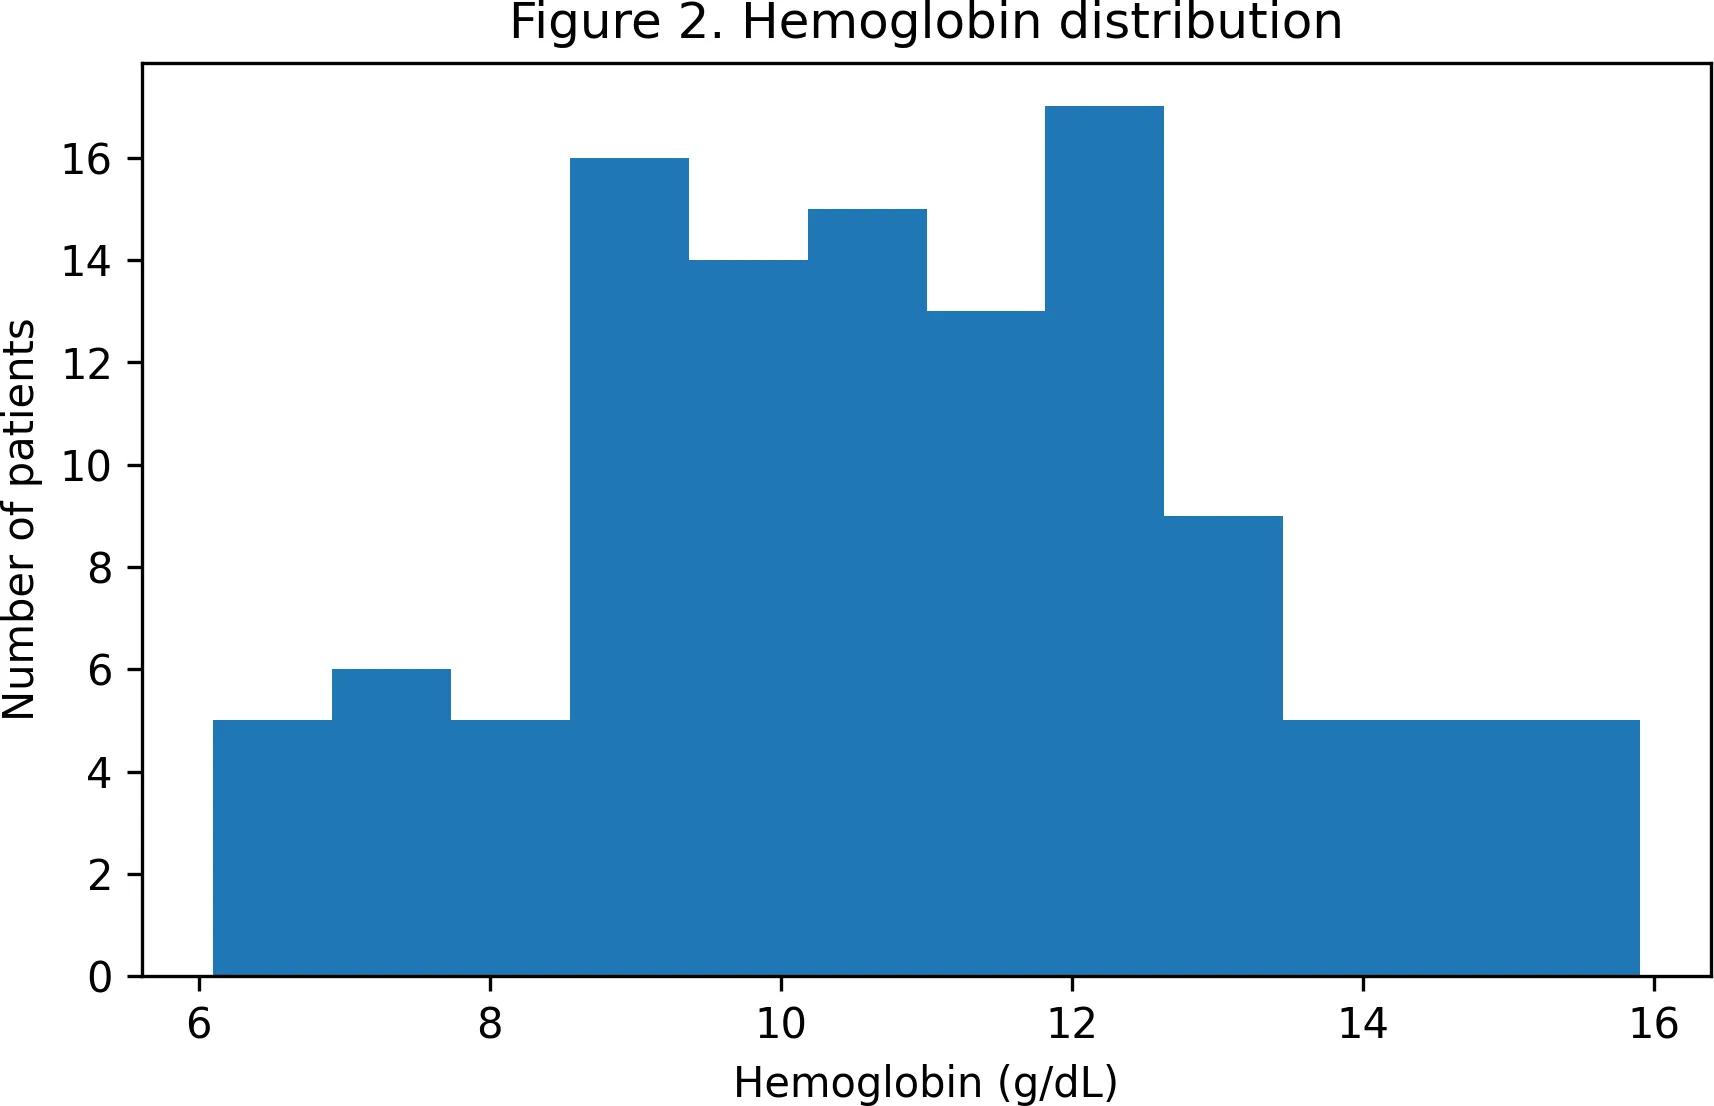
Figure 2. Hemoglobin distribution.
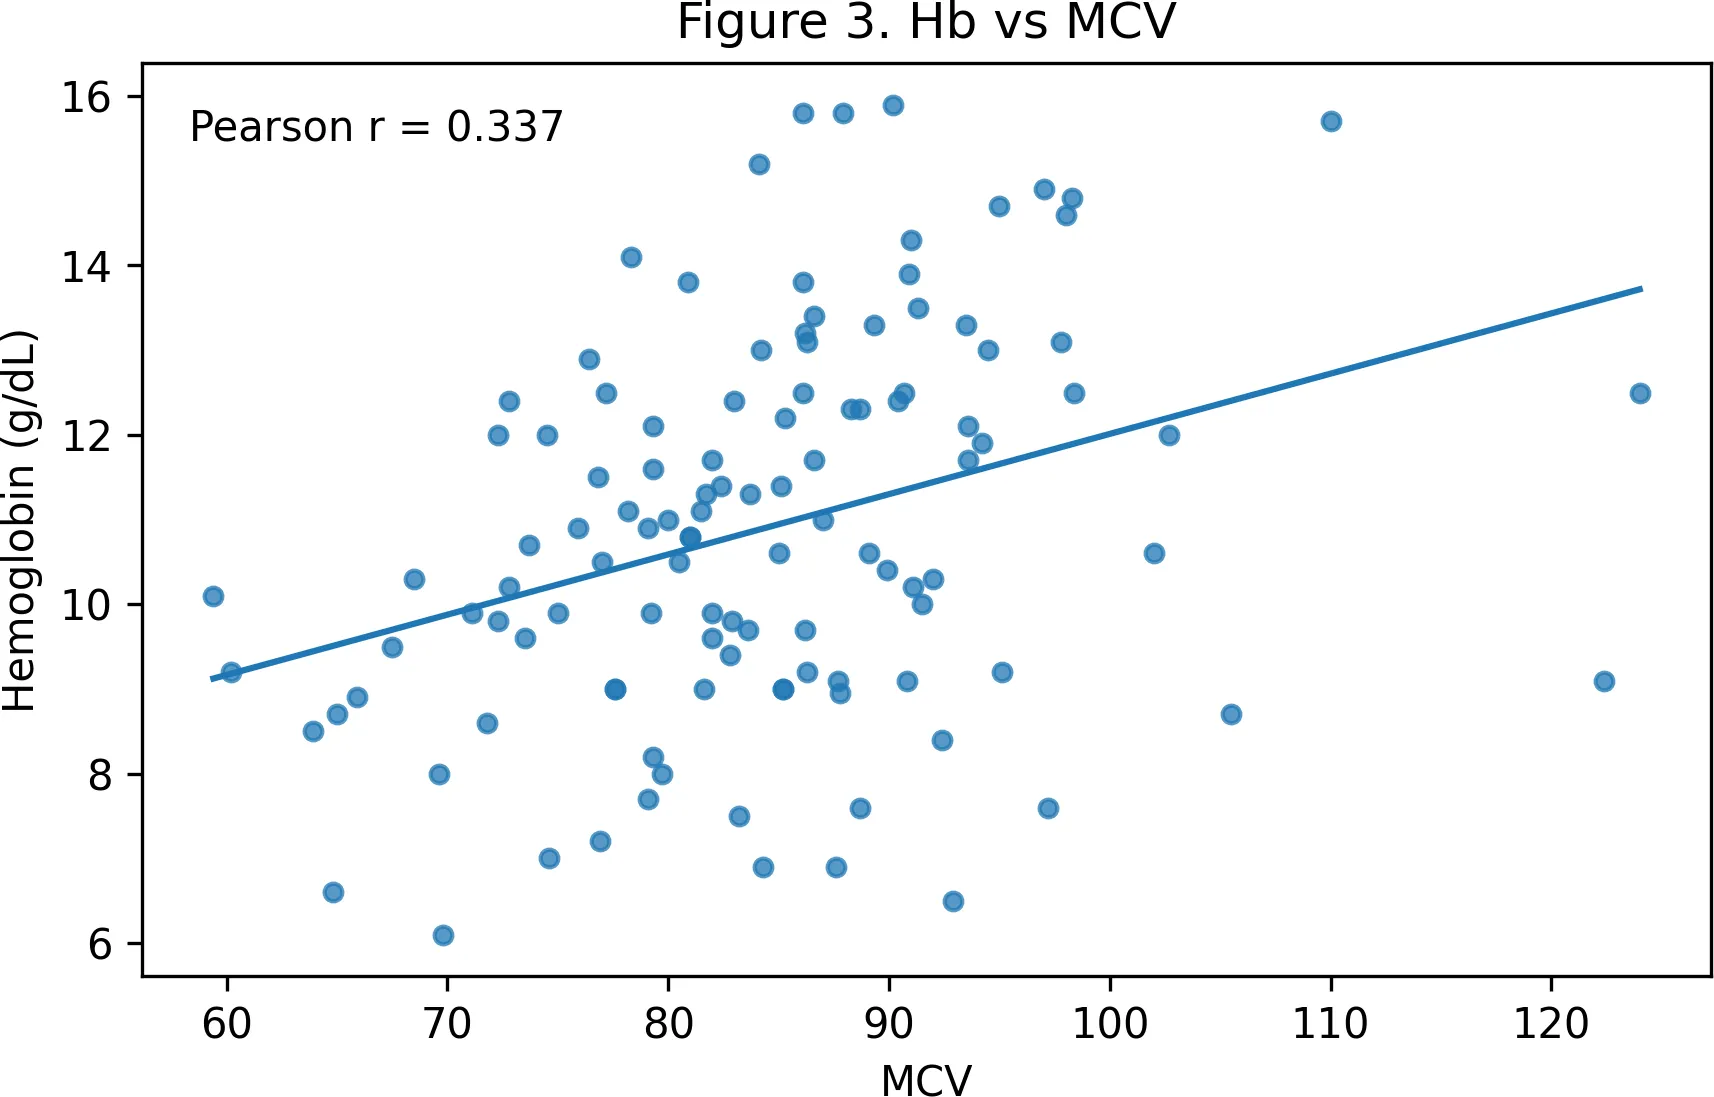
Figure 3. Hb versus MCV.
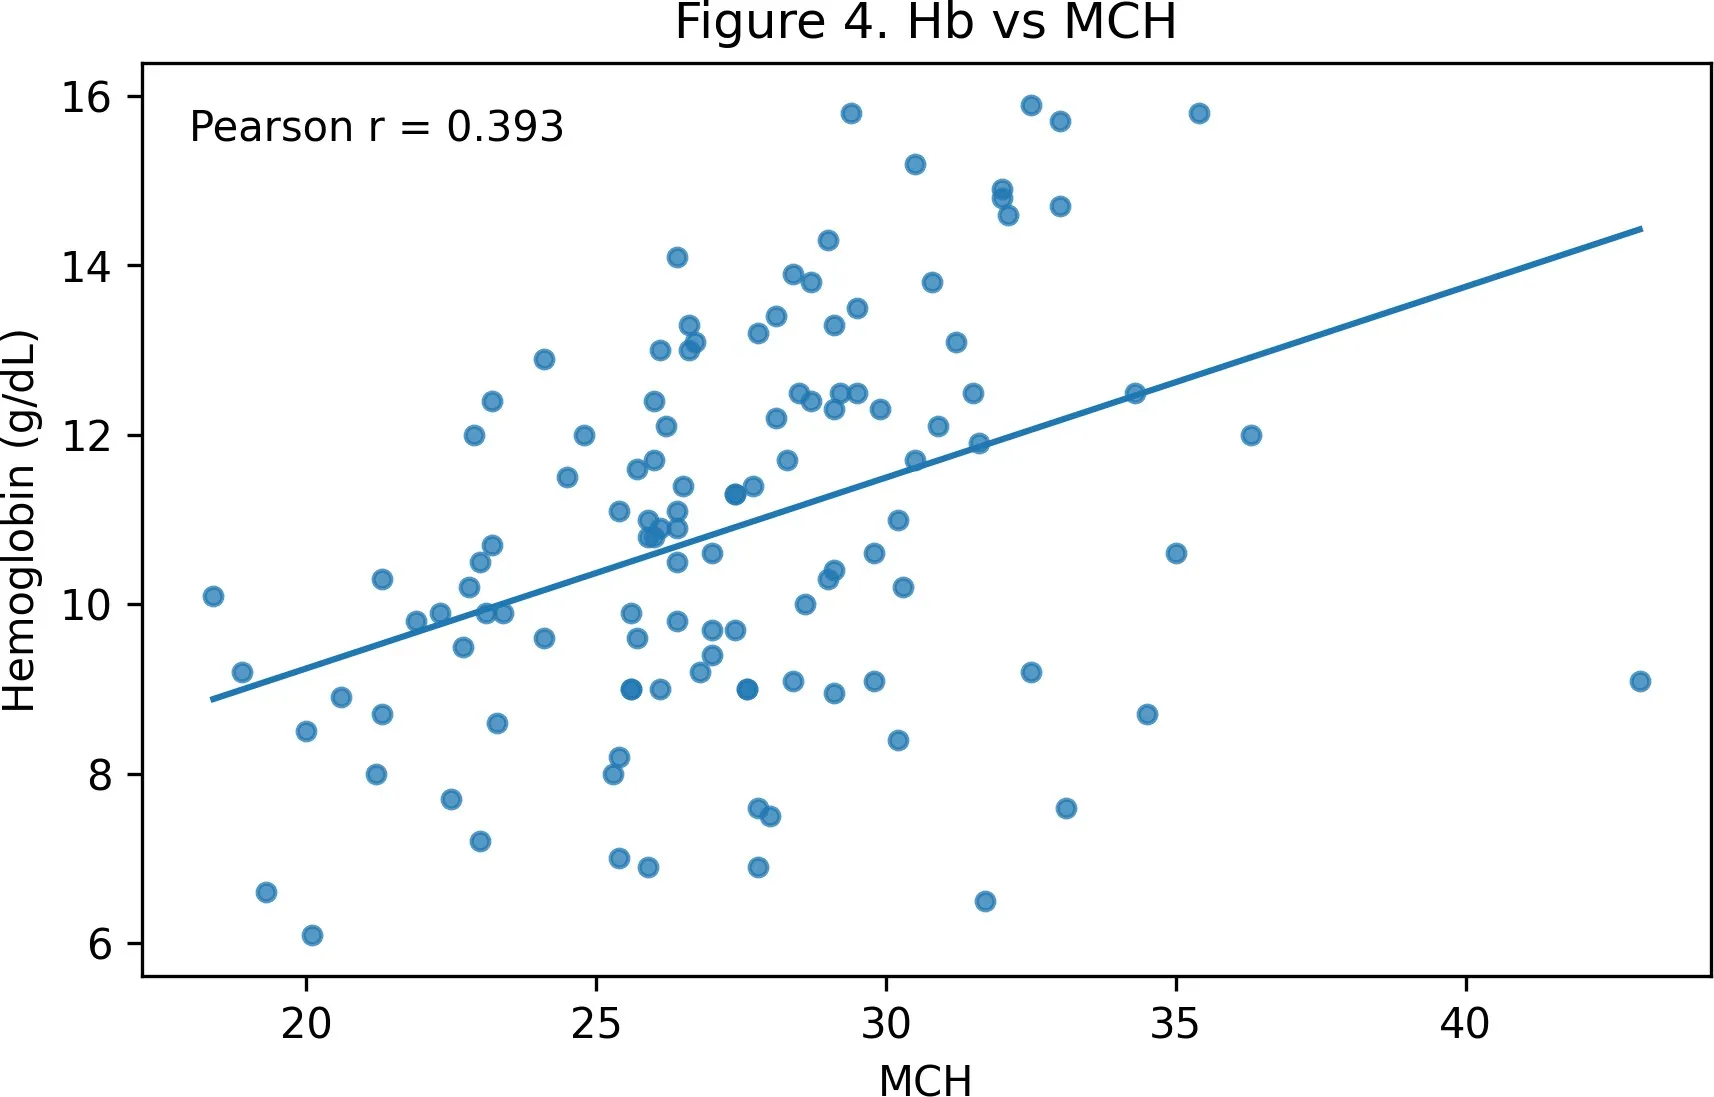
Figure 4. Hb versus MCH.
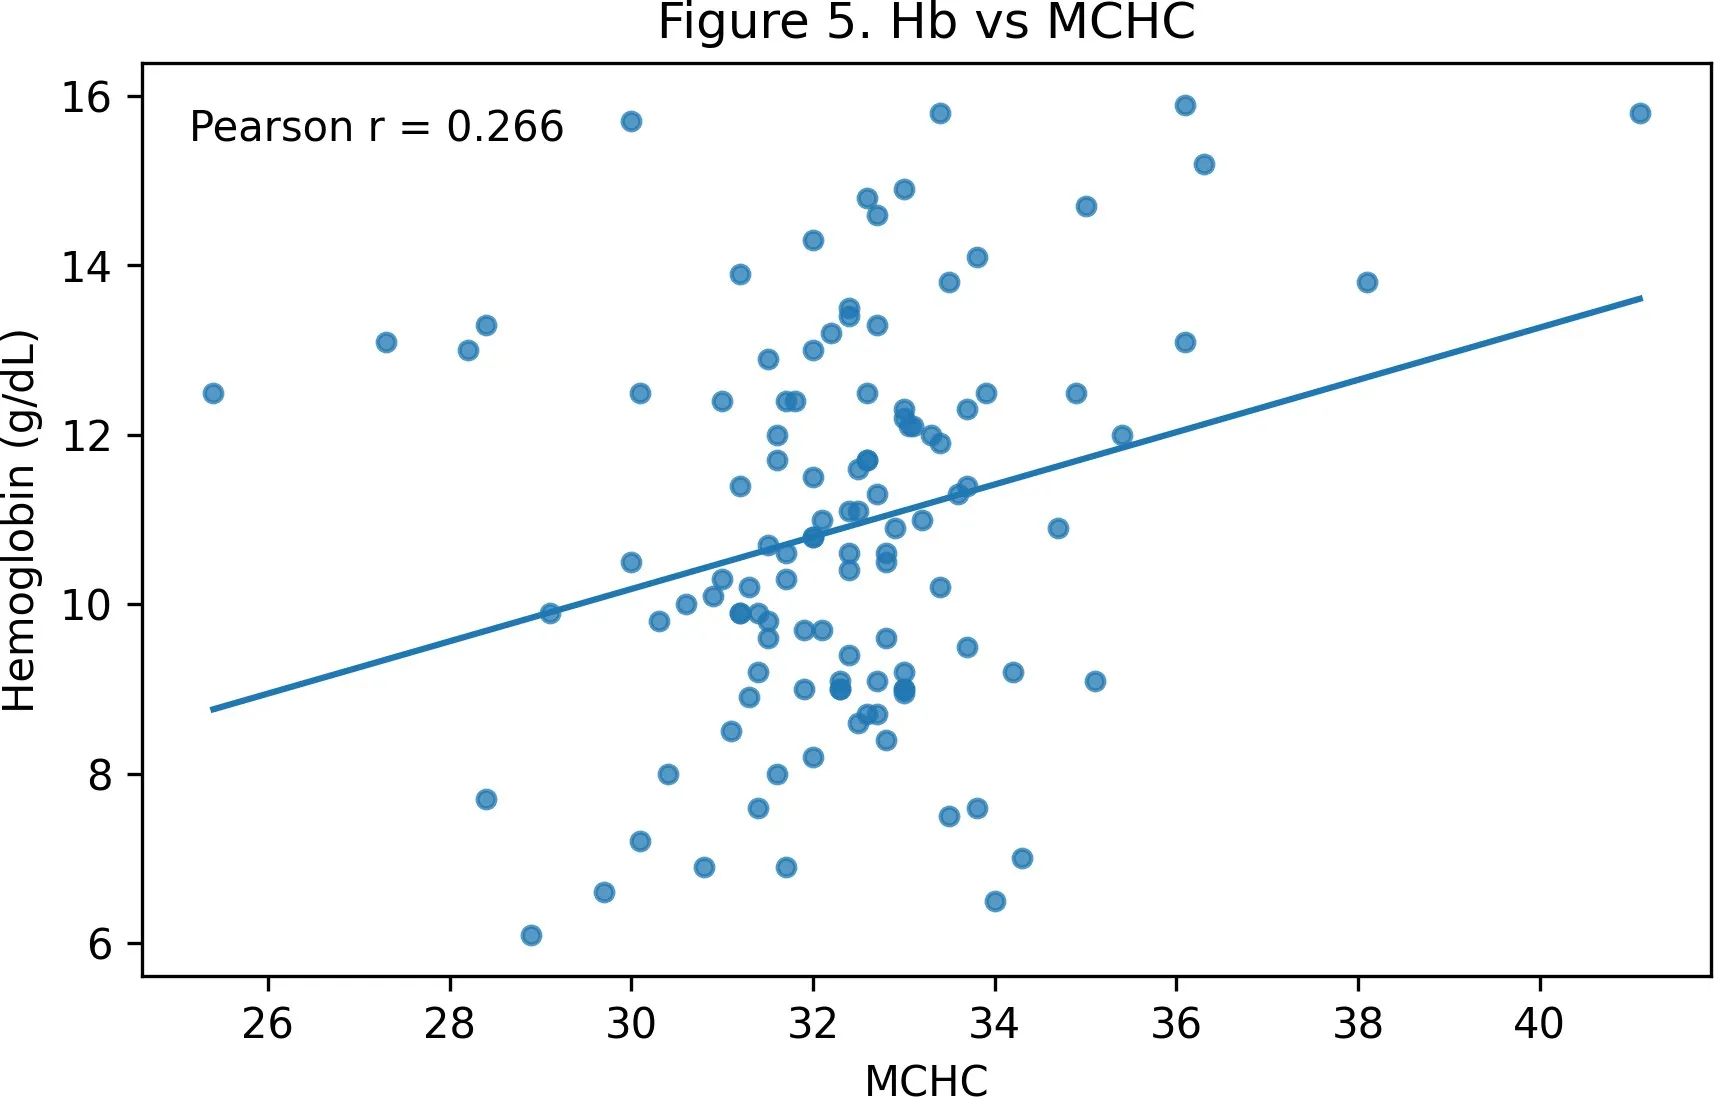
Figure 5. Hb versus MCHC.
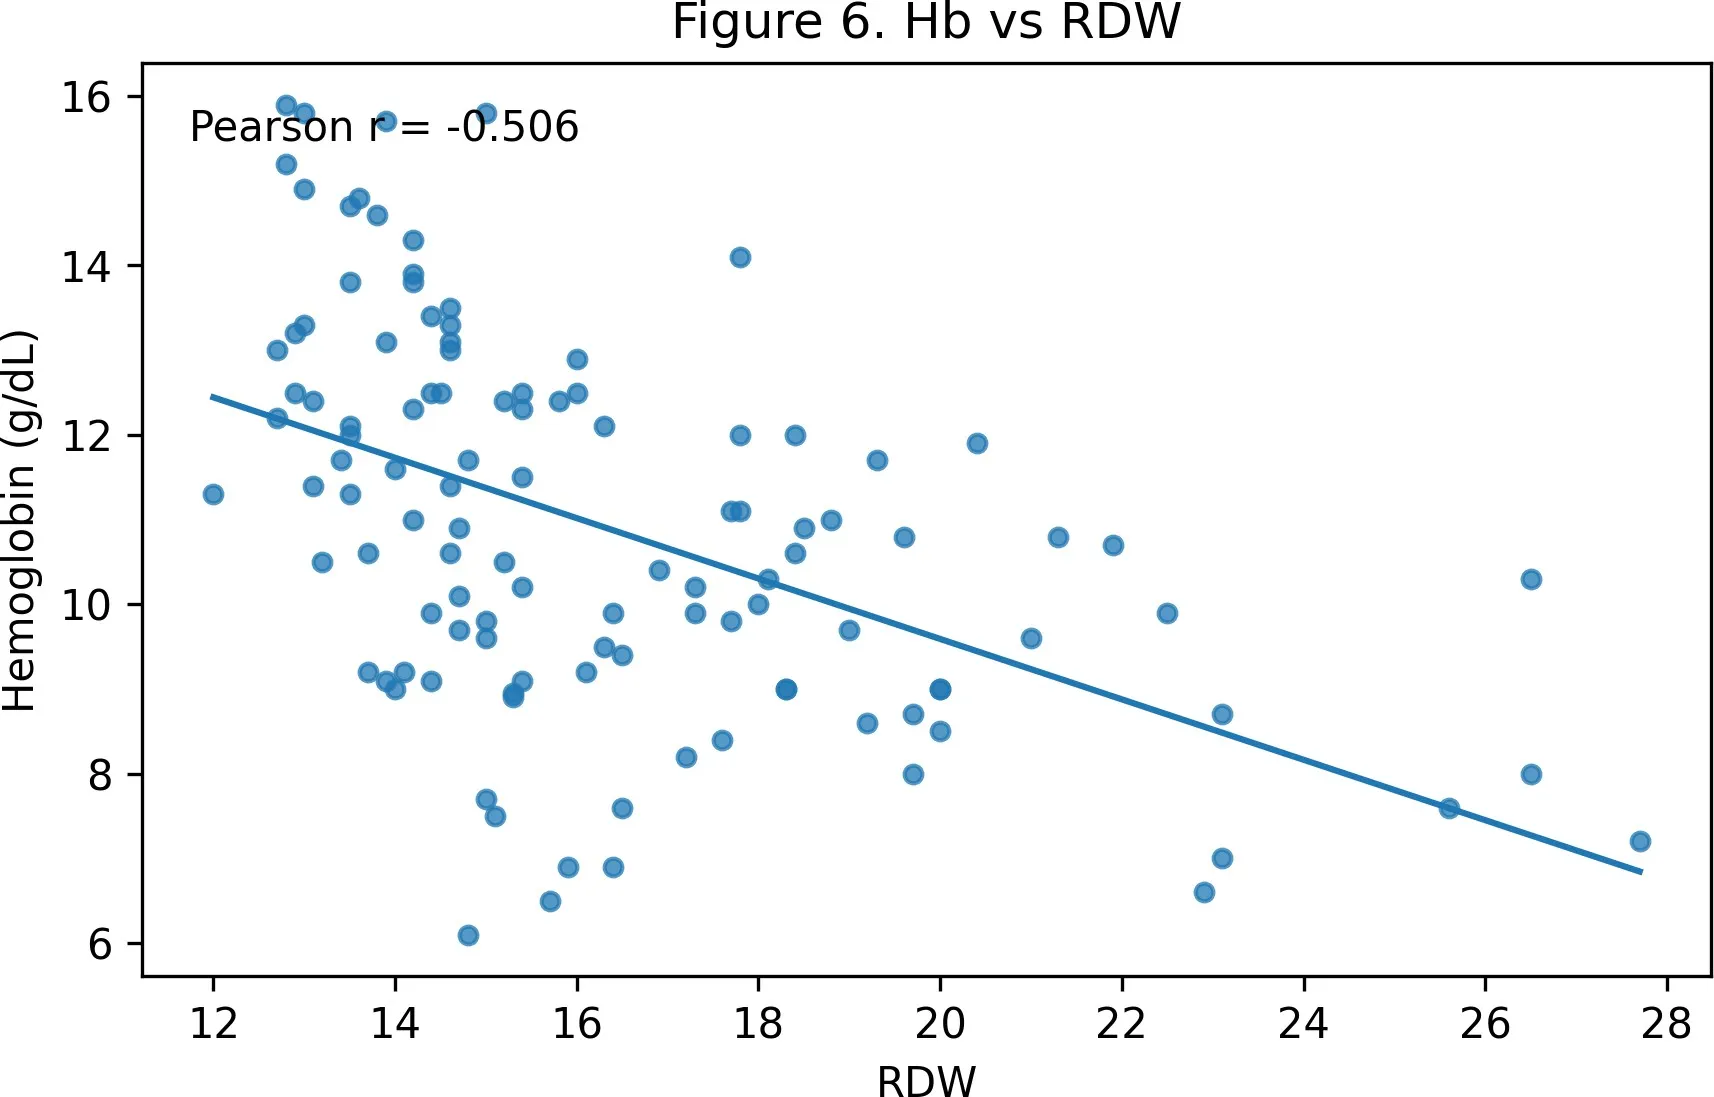
Figure 6. Hb versus RDW.
The analysis showed positive relationships between Hb and MCV, MCH and MCHC, whereas RDW was inversely related to Hb. The Hb–MCH relationship was particularly strong (r=0.393). The inverse association with RDW indicates that greater red-cell size variability tended to occur with lower Hb in this dataset. These findings should be interpreted as statistical associations within a retrospective laboratory sample and not as evidence of causation.
The observed variation in red cell indices also illustrates why Hb is better interpreted together with erythrocyte indices rather than in isolation. The dataset included microcytic, normocytic and macrocytic patterns, supporting the usefulness of combined index interpretation.
LIMITATIONS
DECLARATIONS
Ethical approval: To be completed from actual institutional IEC approval/waiver/exemption documentation.
Consent: To be stated according to institutional policy and target journal requirements.
Conflict of interest: To be declared by the author.
Funding: To be declared by the author.
Author contribution: Jyoti Singh: study concept, data organization, analysis, interpretation and manuscript preparation, subject to verification of actual contribution.
Data availability: Patient-level data should be shared only in accordance with institutional privacy and ethical requirements.
CONCLUSION
In this retrospective sample of 115 CBC records, hemoglobin showed significant correlations with MCV, MCH, MCHC and RDW. The findings support the use of red cell indices alongside Hb for laboratory characterization of red-cell abnormalities.
REFERENCES


Jyoti Singh*, Nikita Meena, Correlation Of Hemoglobin With Red Cell Indices (MCV, MCH, MCHC And RDW): A Retrospective Study, Int. J. Sci. R. Tech., 2026, 3 (9), 323-327. https://doi.org/10.5281/zenodo.22876804
 10.5281/zenodo.22876804