

We use cookies to ensure our website works properly and to personalise your experience. Cookies policy
School of Pharmacy, R.K. University, Rajkot, Gujarat
The purpose of this work was to develop and validate the area under curve method for Endoxifen in tablet dosage forms using UV spectroscopy method. This method was developed as a solvent using methanol and the absorption was measured at 282 nm. The linear relationship between absorption and concentration can be shown by AUC method. The line equation is y=0.024 x 0.1709, with a correlation coefficient (R) of 0.9986 was retained. The area under curve method was verified according to ICH Q(R) guideline. This method was statistically validated by regression studies. The LOD and LOQ are 0.4360 µg/ml and 1.3213 µg/ml. The rate of recovery was found to be 99.738636%. The precision value was found to be less than 2% and the %RSD value is 0.7231949%.
1.Endoxifen: Endoxifen, also known as 4-hydroxy-N-desmethyltamoxifen, it is a nonsteroidal selective estrogen receptor modulator (SERM) and an active metabolite of tamoxifen. It plays an important role in the treatment of estrogen receptor-positive (ER+) breast cancer. Tamoxifen acts as a prodrug and is metabolized mainly by CYP2D6 to form active metabolites, particularly endoxifen and 4-hydroxytamoxifen.
2. UV-Visible Spectroscopy[1]: Spectroscopy is the measurement and interpretation of electromagnetic radiation absorbed, emitted, or transmitted by molecules. UV-Visible spectroscopy is an optical analytical technique that measures the absorption of ultraviolet and visible light by a substance. According to the Beer–Lambert law, the absorbance is related to the concentration of the substance, allowing its concentration to be determined. UV-Vis spectroscopy is widely used because it is simple, rapid, accurate, versatile, and economical.
3. Analytical Method Development and Validation[2]: Analytical method development involves designing a suitable analytical procedure for the accurate analysis of a substance, while method validation confirms that the method is reliable and fit for its intended purpose. Validation ensures the quality, accuracy, reliability, and consistency of analytical results. Important validation parameters include linearity, limit of detection (LOD), limit of quantification (LOQ), accuracy, precision, robustness, and assay.
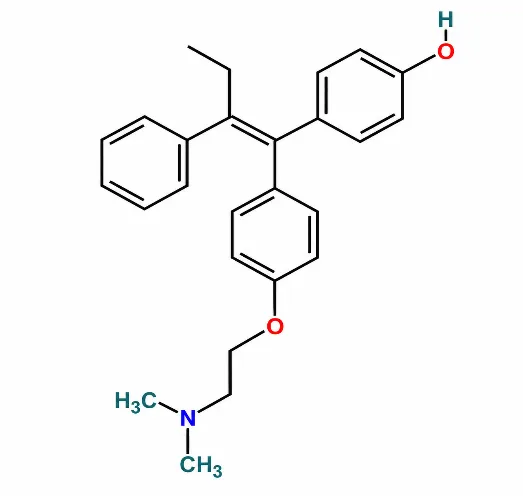
Fig.No : 01 Structure of Endoxifen
MATERIALS & METHODS:
The chemicals will be used for the analysis of Endoxifen API are Endoxifen as the active pharmaceutical ingredient (API), methanol, and purified water. For the analytical study Endoxifen API is used in test sample, as an organic solvent we use methanol and mobile-phase component to facilitate proper dissolution and separation of the drug. For an aqueous component of the mobile phase and for solution preparation purified water is used. All chemicals should be of appropriate analytical or HPLC grade to ensure accurate, reproducible, and reliable results during chromatographic or UV–Visible analysis.
|
Brand Name |
Marketed By |
Drug Content |
Dosage Form |
|
Zonalta |
Intas Pharmaceutical ltd |
Endoxifen tablet 8mg |
Tablet |
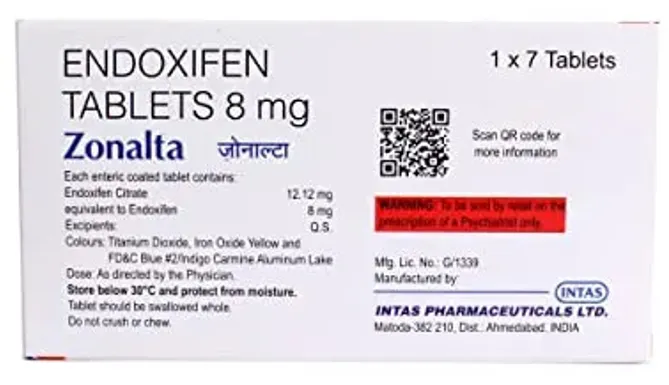
Fig.No : 02 Marketed Formulation of Endoxifen
Take a 10 mg of Endoxifen API in volumetric flask and a Make up to 10 ml of methanol (1000ppm) (Standard solution). Take a 1ml of standard solution in volumetric flask and Make up to 10 ml Methanol (100ppm solution). Again, take a 1 ml of stock solution in volumetric flask and Make up to 10 ml of Methanol (10ppm solution).
Take a 0.1 ml standard solution in volumetric flask and dilute with 10 ml Methanol. This solution Is scan in 200-400 nm. According to this method Amax is a 282nm.
|
UV-Visible Spectrophotometer |
Shimadzu UV 1900 |
|
Analytical Balance |
Digital Balance |
Table 1: List of Equipment
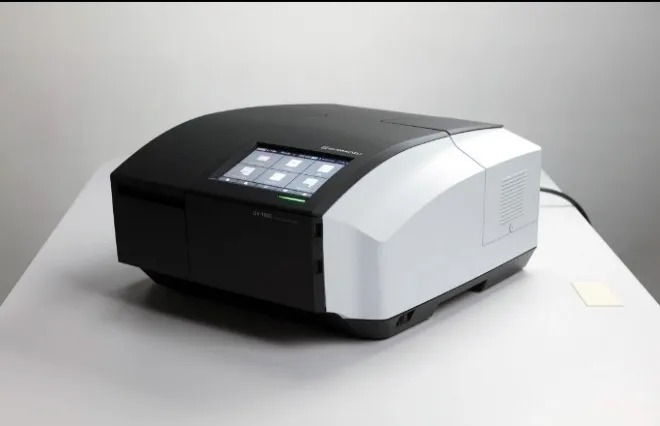
Fig.No : 03 UV – Spectrophotometer Instrument
RESULT & DISCUSSION :
It is the ability of the method to produce results which are direct proportional to analyte concentration. Solutions of 0.2, 0.4, 0.6, 0.8, and 1.0 mL of standard solution were diluted to 10 mL with methanol and scanned at 200–400 nm.
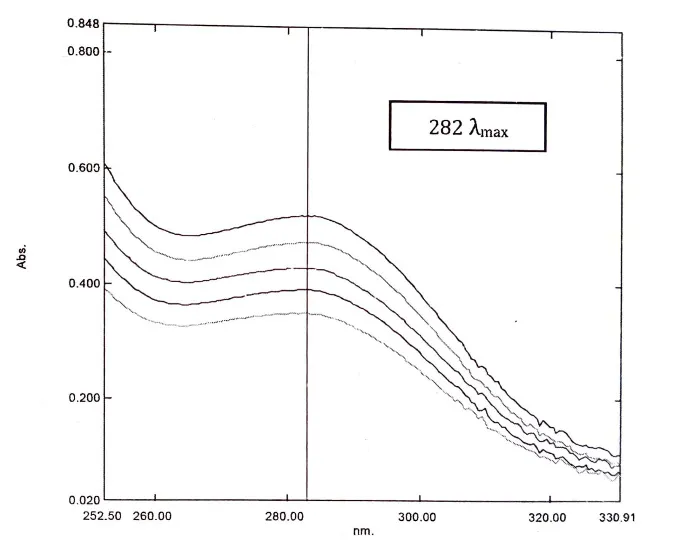
Fig.No : 04 Overlay Spectra of Linearity
The minimum amount of analyte which can be detected under specified experimental conditions but not necessarily quantified is known as LOD. It is stated as percentage, ppm, etc. following is an expression for detection limit:
LOD = 3.3 × σ/S
= 3.3 × 0.002648/0.02004
= 0.4360 µg/ml
LOQ is lowest concentration of analyte in sample which can be quantified with acceptable accuracy and precison. It is stated as analyte concentration in a sample, for e.g. ppm. Quantification limits is as follows:
LOQ= 10 × σ/S
= 10 × 0.002648/0.02004
= 1.3213 µg/ml
It is the closeness of the measured value to either true or standard value. Create 3 different solutions of 80%, 100%, and 120% concentrations were prepared from the 100 ppm standard and scanned at 200–400 nm by UV-Visible Spectrometer. All solutions are scanned 3-3 times.
|
% of Sample |
% Mean Recovery |
SD |
%RSD |
|
80% |
99.458 |
1.682 |
1.692 |
|
100% |
99.833 |
0.190 |
0.191 |
|
120% |
99.924 |
0.285 |
0.286 |
|
Mean |
99.738 |
0.719 |
0.723 |
Table 2: Statistical Validation for Accuracy
It indicates the consistency or repeated measurements and is expressed as %RSD for repeatability, intraday, and interday precision under constant conditions. Solutions of 0.2, 0.4, and 0.6 mL stock solution were diluted to 10 mL with methanol to obtain solution of 2, 4 & 6 ml.
|
Sr. No |
Concentration |
ABS |
Average |
SD |
%RSD |
|
1 |
2 |
0.346 |
0.347 |
0.026 |
0.762 |
|
0.345 |
|||||
|
0.35 |
|||||
|
2 |
4 |
0.395 |
0.397 |
0.026 |
0.666 |
|
0.396 |
|||||
|
0.4 |
|||||
|
3 |
6 |
0.43 |
0.432 |
0.025 |
0.581 |
|
0.433 |
|||||
|
0.435 |
Table 3: Interday Precision
|
Sr. No |
Concentration |
ABS |
Average |
SD |
%RSD |
|
1 |
2 |
0.345 |
0.346 |
0.015 |
0.440 |
|
0.347 |
|||||
|
0.348 |
|||||
|
2 |
4 |
0.391 |
0.392 |
0.015 |
0.389 |
|
0.393 |
|||||
|
0.394 |
|||||
|
3 |
6 |
0.432 |
0.433 |
0.001 |
0.230 |
|
0.433 |
|||||
|
0.434 |
Table 4: Intraday Precision
It is the ability of the analytical method to remain unaffected by any small deliberate changes in experimental environmental conditions.
|
Concentration (ppm) |
Wavelength (nm) |
Ab.1 |
Ab.2 |
Ab.3 |
Mean |
SD |
%RSD |
|
2 |
281 |
0.346 |
0.349 |
0.352 |
0.349 |
0.027 |
0.773 |
|
282 |
0.351 |
0.356 |
0.355 |
0.354 |
|||
|
283 |
0.345 |
0.348 |
0.356 |
0.349 |
|||
|
|
|
|
|
|
0.350 |
|
|
Table 5: Robustness Study-Wavelength Change
The proposed method was applied to the market pill, and the assay results complied with the label claim in good way without interference from common excipients, solvents, or diluents. As a result the new spectrophotometry method is easy to use. The suggested method’s applicability was evaluated using an analysis of the pill that is sold commercially.
|
Concentration (ppm) |
Standard Absorbance |
Test Absorbance |
% Recovery |
SD |
|
4 |
0.346 |
0.345 |
99.710 |
0.018 |
|
0.346 |
0.344 |
99.421 |
||
|
0.346 |
0.347 |
100.289 |
||
|
0.346 |
0.346 |
100 |
||
|
0.346 |
0.349 |
100.867 |
||
|
0.346 |
0.348 |
100.578 |
||
|
|
|
Mean |
100.144 |
|
Table 6: Assay Study for Endoxifen
AREA UNDER CURVE :
In case of AUC (Area under Curve) method is applicable for there is sharp peak or broad spectra are got. Method involves the calculation of integrated value of absorbance with respect to the wavelength between the two selected wavelengths which are ÊŽ1 and ÊŽ2. Area calculation processing item calculates the area bound by the curve and the horizontal axis. The horizontal axis is selected by the putting the wavelength ranges over which area has to be calculated. This wavelength range is selected on the basis of repeated observation so as to get the linearity between area under curve and the concentration. The above mentioned spectrums were used to calculate Area Under Curve. Thus, the calibration curve can be constructed by plotting concentration Vs AUC.
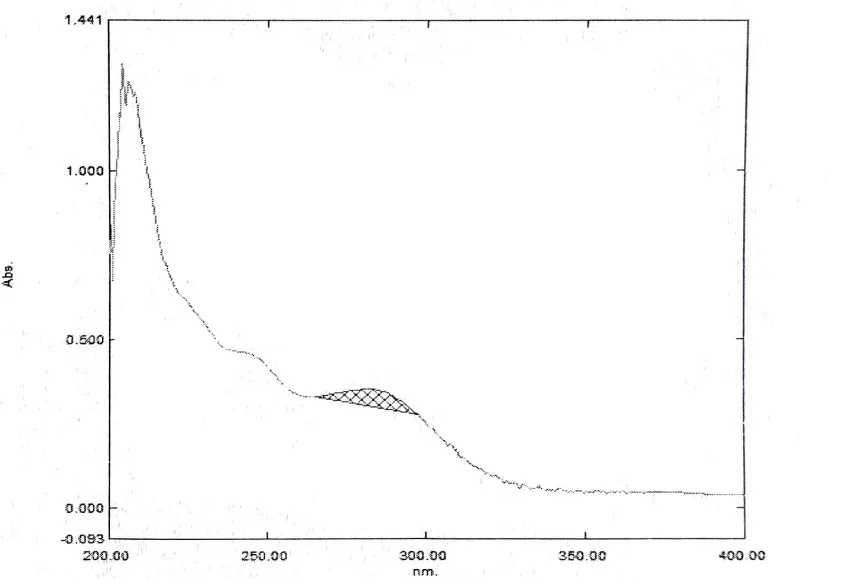
Fig.No : 05 Area Under Curve (AUC)
|
Region |
Start |
End |
Divisor |
Area |
Result |
Description |
|
1 |
265.00 |
297.50 |
1.000 |
1.048 |
1.048 |
2ppm |
|
2 |
267.50 |
297.50 |
1.000 |
1.027 |
1.027 |
4ppm |
|
3 |
267.00 |
299.50 |
1.000 |
1.369 |
1.369 |
6ppm |
|
4 |
266.00 |
298.00 |
1.000 |
1.358 |
1.358 |
8ppm |
|
5 |
267.50 |
297.50 |
1.000 |
1.296 |
1.296 |
10ppm |
CONCLUSION
A simple and validated UV spectrophotometric method is develop for the estimation of Endoxifen in tablet formulation using methanol as solvent and 282 nm as the detection wavelength. The method followed ICH Q2(R2) guidelines and showed good linearity over 2–10 µg/mL with an R² value of 0.9986. The method demonstrated good precision with RSD <2%, while the LOD and LOQ were found to be 0.436 µg/mL and 1.321 µg/mL, respectively. The recovery results confirmed good accuracy and absence of significant interference. Overall, the developed UV method was found to be accurate, precise, sensitive, simple, and suitable for the routine estimation of Endoxifen in tablet formulations.
REFERENCES

T. Rupeliya, N. Sangani*, P. Parmar, H. Vekariya, L. Vekariya, Development And Validation Of UV Spectroscopy Method For Estimation Of Endoxifen In Tablet Dosage Form By Area Under Curve Method, Int. J. Sci. R. Tech., 2026, 3 (9), 631-637. https://doi.org/10.5281/zenodo.22976176
 10.5281/zenodo.22976176