

We use cookies to ensure our website works properly and to personalise your experience. Cookies policy
Amity School of Architecture and Planning, Amity University, Lucknow Campus, India
This research investigates the formation of localized Urban Heat Island (UHI) conditions along the Sarayan River corridor in Sitapur, Uttar Pradesh. Rapid urban expansion and the proliferation of impervious anthropogenic surfaces have significantly altered local microclimates, replacing natural landscapes with heat-absorbing materials [2][6]. This study utilizes a dual-methodology approach involving land-cover mapping via satellite imagery and field-based infrared thermal observations to evaluate the relationship between surface characteristics and heat retention. Analysis reveals a distinct spatial asymmetry: the western urban edge is dominated by a 34.06% hardscape concentration, while the eastern edge maintains an ecological buffer. Thermal assessments identified a significant 16°C gradient between asphalt surfaces (53°C) and forest land (37°C). A critical finding is the interaction between the prevailing West-Northwest (WNW) wind movement (30.53%) and the corridor's spatial configuration. While this airflow represents a significant ventilation opportunity for thermal moderation, the high-density imperviousness of the western urban edge currently acts as a physical obstruction, leading to localized heat stagnation and increased thermal loading. The results indicate that asphalt and concrete function as reservoirs of potential heat discharge, sustaining elevated temperatures through thermal lag. This study concludes that mitigating thermal vulnerability in riverine urban corridors requires climate-responsive urban planning that prioritizes green-to-hardscape ratios and the preservation of river-edge ecological buffers to facilitate effective thermal exchange.
1.1 Context
Urbanization transforms the physical surface of cities. Roads, buildings, parking areas and pavements progressively replace soil and vegetation, changing the way solar radiation is absorbed, stored and released. Impervious materials generally provide less evaporative cooling than vegetated surfaces and can retain heat after the period of maximum solar exposure. These changes are fundamental to the urban heat island phenomenon and to the modification of local urban climate [1], [7].
Urban heat is not distributed uniformly. Thermal conditions vary with building density, material properties, vegetation, water bodies, street geometry, solar exposure and wind. Consequently, a river corridor can contain several contrasting thermal environments within a relatively small area. A dense urban edge may absorb substantial solar energy while an adjacent vegetated corridor can provide shade, moisture and evapotranspiration.
The issue is particularly important in warm climates where high summer temperatures coincide with intense solar exposure. Smaller cities and river-edge settlements also require localized assessment because city-wide averages can hide spatial differences that are relevant to pedestrian comfort, public-space design and environmental planning.
1.2 Problem Statement
The selected Sarayan River corridor contains a clear contrast between a dense urban edge on the western side and comparatively ecological surfaces towards the river and eastern side. The study therefore examines whether this spatial difference is reflected in surface temperature and whether the hardscape concentration creates localized thermal vulnerability.
The research focuses on localized UHI characteristics rather than attempting to establish a city-wide atmospheric UHI intensity. This distinction is important because the field measurements are surface temperatures, not simultaneous air-temperature measurements.
1.3 Research Gap
Established UHI studies have demonstrated the importance of urban energy balance, land cover and surface materials [1], [4], [8]. Thermal remote sensing is also widely used to identify spatial temperature patterns [12]. However, a localized river-corridor assessment can benefit from combining mapped land cover with direct field observations. The present study uses this combined approach to examine the relationship between hardscape concentration and measured surface temperature in Sitapur.
1.4 Aim and Objectives
The aim is to assess localized Urban Heat Island characteristics along the Sarayan River corridor through land-cover analysis, climatic assessment and field-measured surface temperatures, and to identify context-responsive mitigation strategies.
To document and analyze existing land-cover characteristics and hardscape–softscape distribution.
To evaluate the influence of temperature, solar exposure and wind movement on localized thermal behaviour.
To identify thermally vulnerable zones through comparative surface-temperature observations.
To interpret the role of vegetation, shade and the river environment in thermal moderation.
To propose planning and landscape interventions for reducing localized thermal vulnerability.
1.5 Research Hypothesis
The study hypothesizes that locations with a greater concentration of impervious hardscape surfaces will exhibit higher surface temperatures than vegetated, shaded and river-edge locations within the study corridor.
2. LITERATURE REVIEW
Oke's work on the energetic basis of the urban heat island established the importance of urban surface energy exchanges in explaining temperature differences between built and non-built environments [1]. Urban surfaces modify radiation, heat storage and turbulent exchange, while the reduction of moisture availability can reduce latent heat flux. This provides the theoretical basis for examining material and land-cover differences in the present study.
Landsberg [10] described the urban climate as a modified climatic environment produced by the structure and activities of cities. The physical properties of urban materials, the geometry of the built environment and the replacement of natural surfaces collectively affect local climatic conditions. These principles are relevant to the western edge of the Sarayan River corridor, where built surfaces are spatially concentrated.
Oke et al. [7] emphasize that urban climate operates across multiple spatial scales. A river corridor therefore cannot be understood only through a city-wide climatic average. Local surface properties, vegetation and urban morphology can generate microclimatic differences within short distances.
Santamouris [8] examined heat-island characteristics across numerous Asian and Australian cities and demonstrated the widespread relevance of urban heat in warm-climate environments. His work also emphasizes the importance of mitigation approaches such as vegetation, reflective materials and urban design strategies.
Voogt and Oke [12] demonstrated the value of thermal remote sensing for urban climate research. Surface temperature mapping can reveal spatial patterns that are not apparent from conventional air-temperature measurements. The present study complements this general approach with direct infrared observations of selected surface types.
Hathway and Sharples [9] investigated the relationship between rivers and urban form and demonstrated that urban rivers can influence local thermal conditions. The effect depends on surrounding morphology and environmental conditions. This supports the present study's approach of treating the river and its adjacent urban edge as an interconnected system rather than evaluating the water body in isolation.
The literature therefore establishes three principles relevant to the study: impervious surfaces influence heat storage, ecological surfaces can moderate thermal conditions, and the spatial relationship between built and natural systems controls the magnitude of localized effects.
3. STUDY AREA PROFILE
3.1 Geographical Context
The study focuses on a selected stretch of the Sarayan River corridor in Sitapur, Uttar Pradesh. Sitapur experiences a composite climatic regime characterized by hot summers, a concentrated monsoon period and cooler winter conditions. The corridor was selected because it presents a strong contrast between urbanized and ecological land-cover conditions.
The macroclimatic assessment identified an average annual temperature range of approximately 17.4°C and a summer intensity of 31.03°C. The hottest monthly average temperatures are 29.6°C in April, 31.9°C in May and 31.6°C in June.
3.2 Spatial Character
The western edge is characterized by dense residential settlement, compact urban fabric and transportation infrastructure. Towards the river and eastern side, larger vegetated areas, open ecological surfaces and water-associated landscapes create a contrasting environmental condition. This spatial asymmetry is important because thermal vulnerability depends not only on the total amount of hardscape but also on its location and concentration.
The Sarayan River acts as a transitional interface between built and natural systems. Together with adjacent vegetation, it represents an ecological component capable of influencing surface moisture, shading and local heat exchange.
3.3 Seasonal Conditions
The most thermally significant period is March to June. Sunshine duration reaches 10.6 hours in March, 11.5 hours in April, 11.8 hours in May and 10.7 hours in June. Humidity reaches its lowest recorded value of 31% in April and rises to 81% in July, 83% in August and 81% in September. The monsoon period from June to September comprises approximately 60 days in the project dataset.
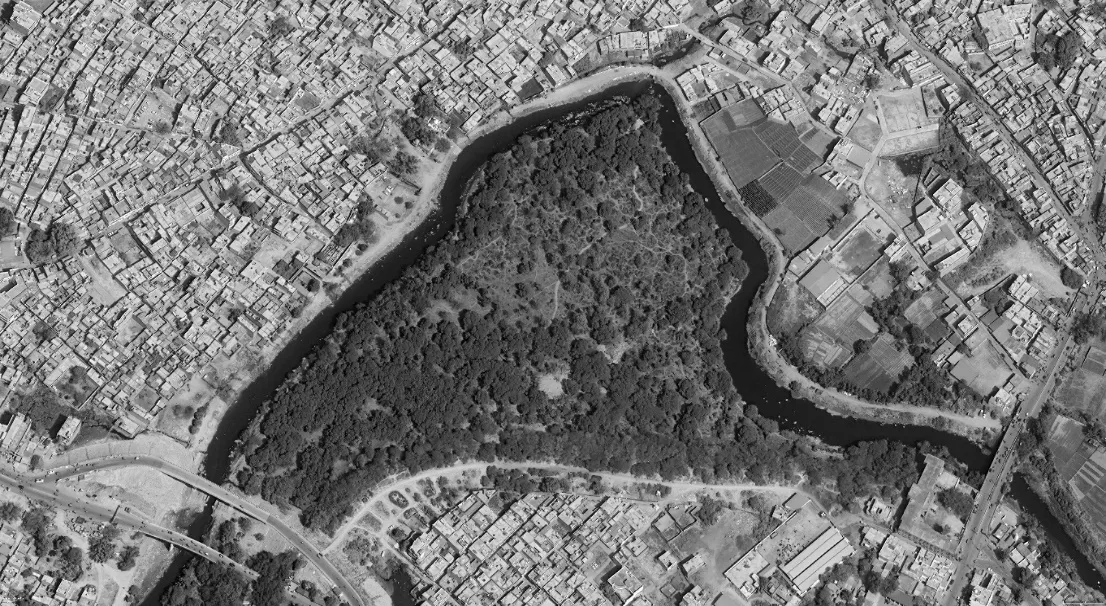
Figure 1 Sarayan River Stretch (Source: Google Earth)
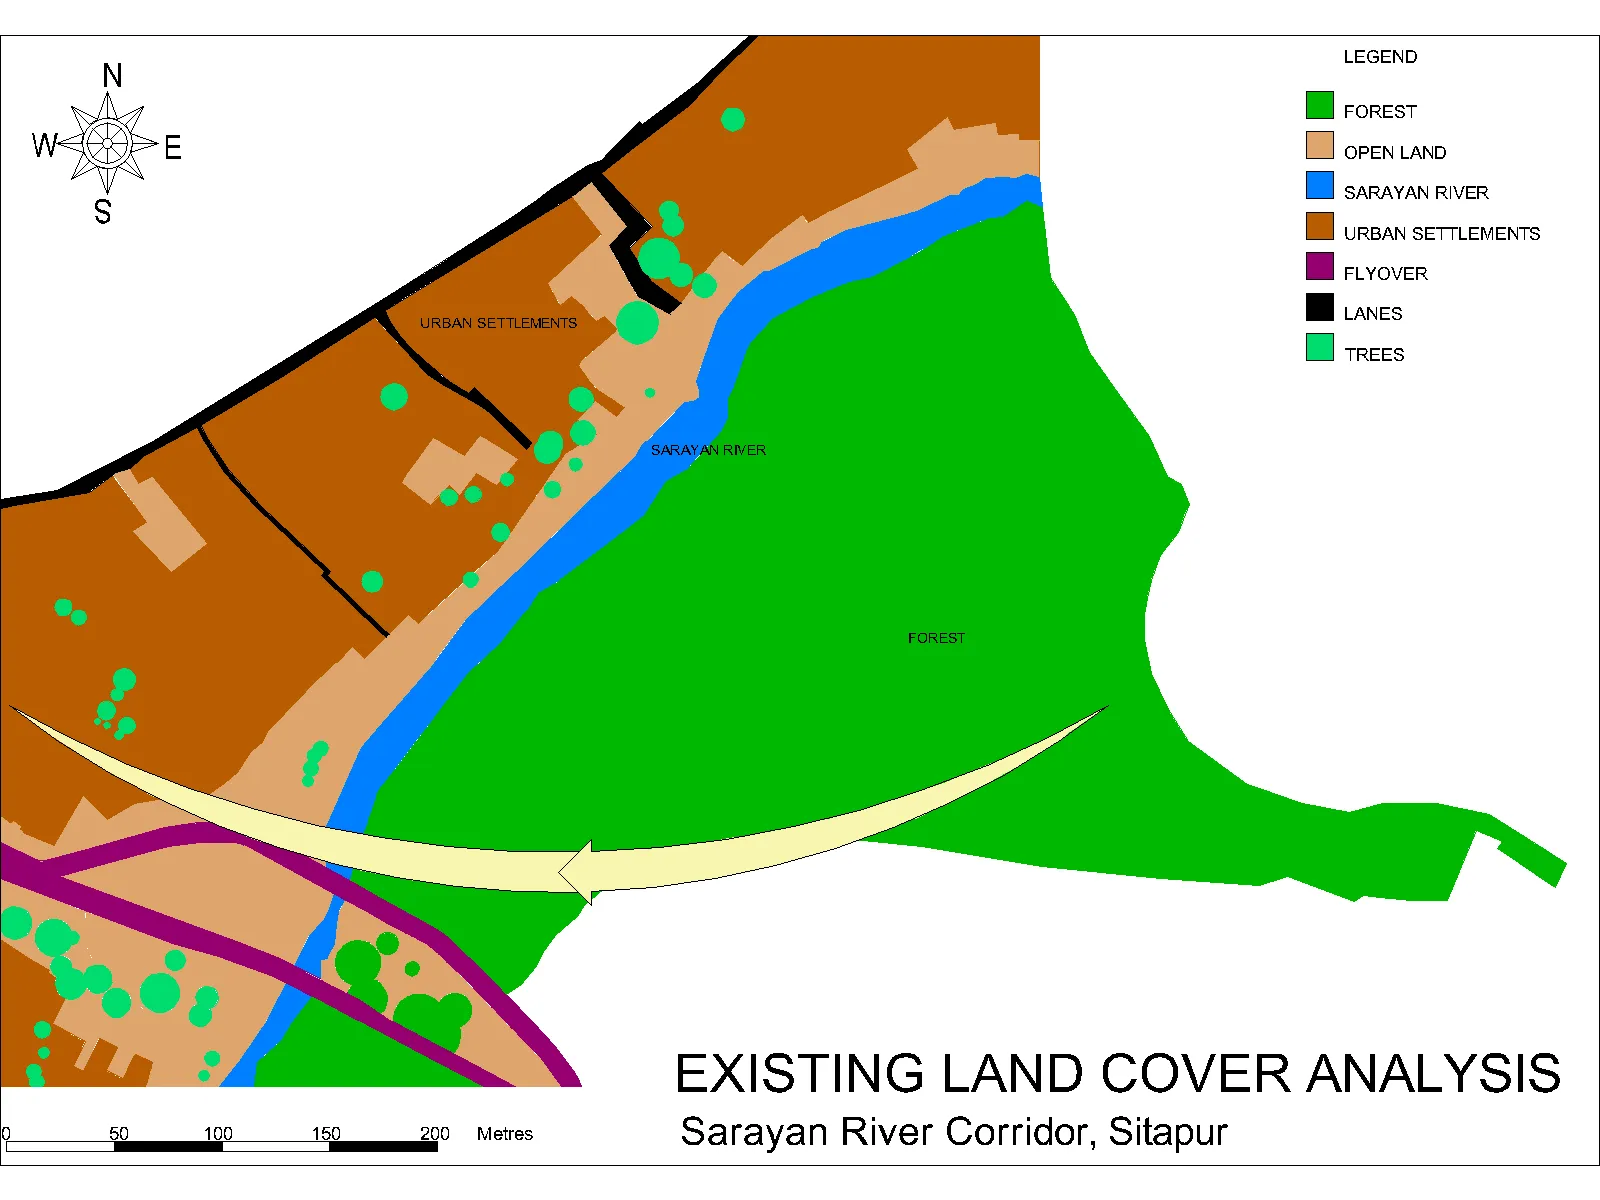
Figure 2 Existing Landcover Analysis (Source: Author)
4. MATERIALS & METHODOLOGY
4.1 Research Framework
The research followed a sequential framework: spatial mapping; macroclimatic analysis; hardscape–softscape calculation; wind and solar assessment; field thermal observation; comparative analysis; and interpretation. The purpose of combining these stages was to understand surface temperature within its climatic and spatial context.
4.2 Land-Cover Mapping
Satellite imagery and spatial mapping were used to classify the corridor into built-up area, road network, vegetated zone, open exposed land and water body. The areas were quantified in square metres. Built-up area and road network were grouped as hardscape for the ratio analysis, while vegetation, open exposed land and water body were grouped as softscape or ecologically active surfaces.
4.3 Hardscape–Softscape Calculation
Built-up area is 54,600 sqm and road network is 8,560 sqm, producing a total hardscape area of 63,160 sqm. Vegetated zone is 88,000 sqm, open exposed land is 24,600 sqm and water body is 9,660 sqm, producing a total softscape area of 122,260 sqm. The resulting distribution is 34.06% hardscape and 65.94% softscape.
4.4 Climatic Analysis
Temperature, humidity, monsoon duration, sunshine hours and monthly insolation were examined to identify periods of maximum thermal loading. The annual temperature range was calculated from the project dataset as 31.9°C minus 14.5°C, giving 17.4°C. Summer intensity was calculated as 31.03°C.
4.5 Wind Analysis
Wind-rose data were interpreted by direction, frequency and average speed. WNW is the dominant direction at 30.53% of occurrences and has an average speed of 3.11 m/s in the supplied table. ESE contributes 13.28%, W 10.14% and NW 10.07%. The WNW component was considered particularly relevant to the western urban edge and river corridor.
4.6 Solar Analysis
Solar exposure was assessed using macro-level sunshine and insolation data. The highest sunshine duration occurs in May at 11.8 hours. April and May represent an important period of solar thermal loading, particularly for exposed roads and paved surfaces.
4.7 Infrared Surface Temperature Survey
An infrared thermometer was used to record surface temperatures across representative materials and environments. The survey included asphalt road, concrete road, concrete paving, kachcha road, river surface, shaded area and forest land. The observations are interpreted as surface temperatures and not as direct atmospheric UHI intensity.
4.8 Analytical Approach
The analysis compares the highest and lowest observed surface temperatures and examines the pattern across hardscape and ecological categories. The thermal gradient is then interpreted alongside the mapped concentration of hardscape, solar exposure and wind direction. This provides a triangulated assessment rather than relying on a single dataset.
5. CLIMATIC AND ENVIRONMENTAL ANALYSIS
5.1 Temperature and Solar Thermal Loading Sitapur experiences maximum thermal stress between March and June [1]. The average temperature peaks in May at 31.9°C. This period coincides with maximum solar exposure, with sunshine hours reaching 11.8 hours in May. Analysis of insolation data indicates that peak monthly insolation in April and May leads to intense thermal loading of exposed hardscape surfaces [5].
5.2 Wind Movement and Ventilation
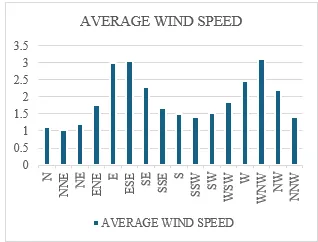
Figure 3 Average Wind Speed (Source: Author)
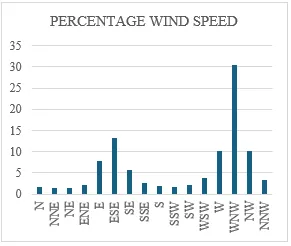
Figure 4 Percentage Wind Speed Source: Author
5.3 Humidity and Monsoon
Humidity ranges from 31% in April to a peak of 83% in August [1]. The 60-day monsoon season (June–September) provides critical ecological regeneration and temporary cooling, mitigating the heat accumulated during the preceding dry summer months [3].
6. Land Cover and Hardscape-Softscape Analysis
The spatial distribution of the study area is categorized as follows:
|
VEGETATED ZONE |
88000 sqm. |
|
BUILT UP AREA |
54600 sqm. |
|
OPEN EXPOSED LAND |
24600 sqm. |
|
WATER BODY |
9660 sqm. |
|
ROAD NETWORK |
8560 sqm. |
Table 1 Study Area Distribution (Source: Author)
Ratio Analysis The total study area is bifurcated into impervious heat-retaining surfaces and ecologically active surfaces:
Percentage Summary The corridor maintains a 34.06% Hardscape ratio versus a 65.94% Softscape ratio. Despite the overall dominance of softscapes, the concentration of hardscape materials along the western urban edge creates a localized environment highly susceptible to heat absorption and long-term retention.
7. Thermal Assessment and UHI Interpretation
7.1 Surface Temperature Comparison
Field observations using infrared thermometry reveal significant disparities in thermal performance across surface types.
|
Surface Type |
Temperature (°C) |
|
Asphalt Road |
53 |
|
Concrete Road |
52 |
|
Concrete Paving |
50 |
|
Kachcha Road |
48 |
|
River Surface |
40 |
|
Shaded Area |
38 |
|
Forest Land |
37 |
Table 2 Surface Temperature Data (Source: Author)
7.2 Thermal Gradient and Lag Analysis
A critical 16°C thermal difference exists between the highest recorded temperature (Asphalt, 53°C) and the lowest (Forest Land, 37°C). The 53°C recorded on asphalt surfaces represents not merely a peak reading but a reservoir of potential heat discharge. Due to high thermal mass, these impervious surfaces exhibit significant thermal lag, releasing stored energy slowly and sustaining the UHI effect long after sunset.
7.3 UHI Identification
The data validates localized UHI behavior. The western urban edge, with its high concentration of built-up surfaces and roads, functions as the primary heat-generating zone. Conversely, the eastern ecological edge, characterized by vegetation and the river, acts as a cooling buffer that moderates the microclimate through evapotranspiration and solar shading.
8. Findings and Recommendations
8.1 Hardscape and Thermal Behaviour
The field observations support the study hypothesis. Asphalt and concrete produced the highest surface temperatures, while vegetation, shade and water produced lower values. This is consistent with the physical behaviour of exposed impervious materials, which can absorb and store solar energy. The result is especially relevant where large areas of such materials are concentrated in the urban fabric.
The 34.06% hardscape value should not be interpreted as a uniform condition across the corridor. The location of the hardscape is critical. A concentrated hardscape cluster can create a local hot zone even when the total study area contains a larger proportion of softscape.
8.2 Vegetation and Shading
Forest land recorded 37°C, the lowest measured value. Shaded area recorded 38°C. The near-similarity of these two readings demonstrates the importance of reducing direct solar exposure. Vegetation additionally provides evapotranspiration and can modify the surrounding radiation environment. These observations support the use of canopy-based interventions along exposed pedestrian and road surfaces.
8.3 River as Thermal Buffer
The river surface recorded 40°C, which is 13°C below the asphalt reading. This does not establish a universal cooling value for the river because water temperature depends on season, depth, solar exposure and flow. Nevertheless, the observed contrast identifies the river environment as a comparatively cooler component within the surveyed corridor.
8.4 Wind and Thermal Exchange
The WNW wind occurrence of 30.53% is relevant to the corridor because the western edge is urbanized and the eastern side contains ecological surfaces. The airflow represents a potential ventilation opportunity, but the study does not directly measure building-scale wind obstruction. It is therefore more accurate to state that urban density may modify the effectiveness of this ventilation pathway rather than to claim that wind alone causes the western edge to be hotter.
8.5 Solar Loading
The thermal observations occur within a climatic context of high summer solar exposure. May combines the highest average temperature of 31.9°C with 11.8 sunshine hours. Exposed asphalt and concrete therefore experience substantial daytime radiation loading. The relationship supports the use of shade and reflective or permeable surface treatments.
8.6 Localized UHI Interpretation
The study supports localized UHI characteristics through convergence of three observations: spatial concentration of hardscape at the western urban edge, a hot pre-monsoon climatic background, and a measured 16°C surface-temperature difference between asphalt and forest land. These results indicate thermal vulnerability but should not be interpreted as a complete atmospheric UHI intensity measurement.
The eastern ecological edge provides a contrasting thermal environment. Vegetation, shade and the river surface recorded lower temperatures than exposed urban surfaces. This supports the interpretation of the river corridor as an ecological buffer that can contribute to local thermal moderation.
8.7 Implications for Environmental Quality
The findings have direct implications for urban environmental quality. High surface temperatures can increase heat exposure for pedestrians, affect the usability of outdoor spaces and contribute to heat transfer into adjacent environments. Improving canopy cover and reducing exposed heat-retaining surfaces can therefore support both thermal and public-space quality.
The study also suggests that river conservation and urban heat mitigation should not be treated as separate planning agendas. Maintaining ecological continuity along the river can simultaneously protect environmental assets and provide a thermal buffer for adjacent development.
REFERENCES


Yash Bhardwaj*, Madhavendra Pratap Singh, Study Of Urban Heat Island Effect Through Hard Surface And Green Ratio Analysis: A Case Of The Sarayan River Corridor, Sitapur, Int. J. Sci. R. Tech., 2026, 3 (9), 155-162. https://doi.org/10.5281/zenodo.22327644
 10.5281/zenodo.22327644