

We use cookies to ensure our website works properly and to personalise your experience. Cookies policy
Department of conservative dentistry and endodontics, Mr ambedkar dental college and hospital Bangalore, India
Background: Residual root canal sealer after post space preparation may affect adhesion between radicular dentin and fiber posts. This in vitro study compared residual sealer scores and push out bond strength after obturation with AH Plus, Sealapex, MTA Fillapex, and BioRoot RCS. Methods: Sixty extracted single rooted premolars were assigned to four groups of 15. Canals were prepared to size 30 with 4% taper and obturated with gutta percha and the allocated sealer. Specimens were stored for seven days at 37°C and 100% humidity. Post spaces were prepared with Peeso reamers, leaving 5 mm of apical gutta percha. Residual material was scored microscopically. Fiber posts were cemented with dual cure Paracore resin cement, specimens underwent 500 thermocycles, and roots were sectioned into coronal, middle, and apical discs for push out testing. Failure modes were examined microscopically. Results: Clean post spaces were reported in 86.7% of AH Plus samples and 80.0% of Sealapex samples, compared with 46.7% for MTA Fillapex and 33.3% for BioRoot RCS. Residual score distributions differed among groups (Pearson ?²=13.195, df=6, p=0.040). AH Plus had the highest mean bond strength in the coronal, middle, and apical regions: 24.55±1.04, 21.00±1.15, and 18.62±0.64 MPa, respectively. Sealapex had the lowest values: 10.80±0.75, 7.58±0.81, and 4.48±0.75 MPa. Bond strength declined from coronal to apical regions in every group (p<0.001). Conclusion: Sealer type was associated with residual material and fiber post bond strength. AH Plus showed the highest bond strength. These findings should not be directly generalized to clinical outcomes without further research.
Endodontically treated teeth may have substantial loss of coronal structure, making restoration and retention of the core challenging [1]. In some cases, an intraradicular post is used to retain the core rather than to strengthen the root. Fiber posts are used because their appearance is favorable and their elastic behavior is closer to dentin than that of many metal posts. Their retention depends on the interaction among the post, resin cement, and root canal dentin [2]. Post space preparation requires removal of coronal gutta percha and sealer while preserving an adequate apical seal [3]. Complete removal of filling material from the canal walls is difficult, and residual material may cover dentin, obstruct tubules, or alter the adaptation of resin cement. The amount remaining can depend on the filling material, canal anatomy, and post space preparation method [4]. Root canal sealers differ in composition and setting behavior. AH Plus is an epoxy resin based sealer; Sealapex is calcium hydroxide based; MTA Fillapex contains mineral trioxide aggregate components; and BioRoot RCS is a hydraulic calcium silicate based sealer [5]. These differences may influence how readily filling residues are removed and how the dentin surface interacts with adhesive materials. Previous laboratory studies have found that sealer type and the timing and method of post cementation can affect push out bond strength, with variable results [6]. Recent research also continues to evaluate bonding strategies for fiber posts after use of calcium silicate based sealers [7]. The aim of this in vitro study was to evaluate residual sealer after post space preparation and the push out bond strength of fiber posts following obturation with AH Plus, Sealapex, MTA Fillapex, or BioRoot RCS. The null hypothesis was that sealer type would not affect residual sealer scores, bond strength, or failure mode across the coronal, middle, and apical root regions.
MATERIALS AND METHODS
2.1 Study design and sample selection
This in vitro study included 60 extracted, caries free, single rooted premolars. The thesis states that teeth were obtained following extraction for periodontal or orthodontic reasons [8]. Teeth with mature apices and no previous root canal treatment or visible root defects were eligible. Exclusion criteria included curved canals, developmental abnormalities, open apices, cracks, internal or external resorption, calcified canals, fractures, restorations, and previous endodontic treatment. The specimens were divided into four groups of 15 according to the root canal sealer used [9,10].
Table 1: Distribution of Study Groups Based on the Type of Root Canal Sealer (N = 15 per Group) [11].
| Group | Root canal sealer | Sample size |
|---|---|---|
| A | AH Plus | 15 |
| B | Sealapex | 15 |
| C | MTA Fillapex | 15 |
| D | BioRoot RCS | 15 |
2.2 Root canal preparation and obturation
Specimens were cleaned and stored in distilled water. Crowns were decoronated below the cementoenamel junction and access cavities were prepared [12]. Working length was established approximately 0.5 to 1 mm short of the apical foramen. Canals were prepared with nickel titanium rotary instruments to size 30 with 4% taper [13]. The thesis records use of 17% EDTA gel during preparation and 0.9% saline irrigation. Canals were dried with absorbent paper points and obturated with gutta percha using the single cone technique and the allocated sealer. Access cavities were sealed with glass ionomer cement, and buccolingual and mesiodistal radiographs were taken. Specimens were stored at 37°C and 100% humidity for seven days [14].
2.3 Post space preparation and residual sealer scoring
After storage, glass ionomer cement was removed and post spaces were prepared with Peeso reamers sizes 1, 2, and 3, leaving 5 mm of apical gutta percha. Post space walls were examined under a dental operating microscope. Residual material was categorized as Grade 0, clean; Grade 1, minimal remnants; Grade 2, moderate remnants; and Grade 3, extensive remnants [15].
2.4 Fiber post cementation and push out testing
Translucent Tenax fiber posts were cemented using dual cure Paracore resin cement and core build up was completed. The specimens underwent 500 thermocycles and were incubated for 24 hours at 37°C, as reported in the thesis. Each root was sectioned transversely into approximately 2 mm thick discs representing the coronal, middle, and apical thirds. Discs were embedded in acrylic moulds, and push out bond strength was measured using a universal testing machine. Failure modes were examined microscopically and classified as adhesive, cohesive, or mixed [16].
2.5 Statistical analysis
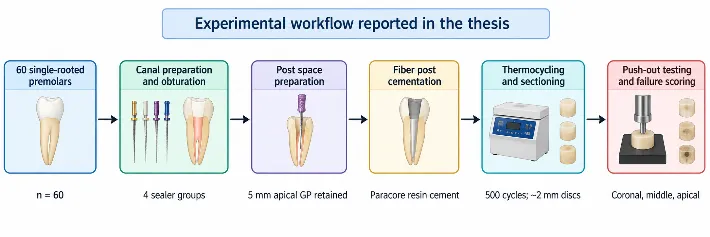
Figure 1: Experimental workflow reconstructed from the methods
The thesis reports statistical analysis using SPSS for Windows, version 22.0. Continuous outcomes were summarized as means and standard deviations, and categorical outcomes as frequencies and percentages. One way analysis of variance followed by Tukey post hoc testing was used for push out bond strength comparisons. Chi square testing was used for failure mode and residual score distributions. A Kruskal Wallis test and pairwise Mann Whitney U tests were also reported for residual scores. Statistical significance was set at p<0.05. The reported results are reproduced from the thesis; raw specimen level data were not available for independent reanalysis[17,18].
RESULTS
3.1 Residual sealer after post space preparation
AH Plus had the highest proportion of clean post spaces (86.7%), followed by Sealapex (80.0%). MTA Fillapex had 46.7% clean samples, while BioRoot RCS had 33.3%. No specimen was assigned Grade 3 in the reported distribution. The Pearson chi square test indicated a significant association between sealer group and residual score distribution (χ²=13.195, df=6, p=0.040). The thesis also reports a significant Kruskal Wallis result (p=0.023).
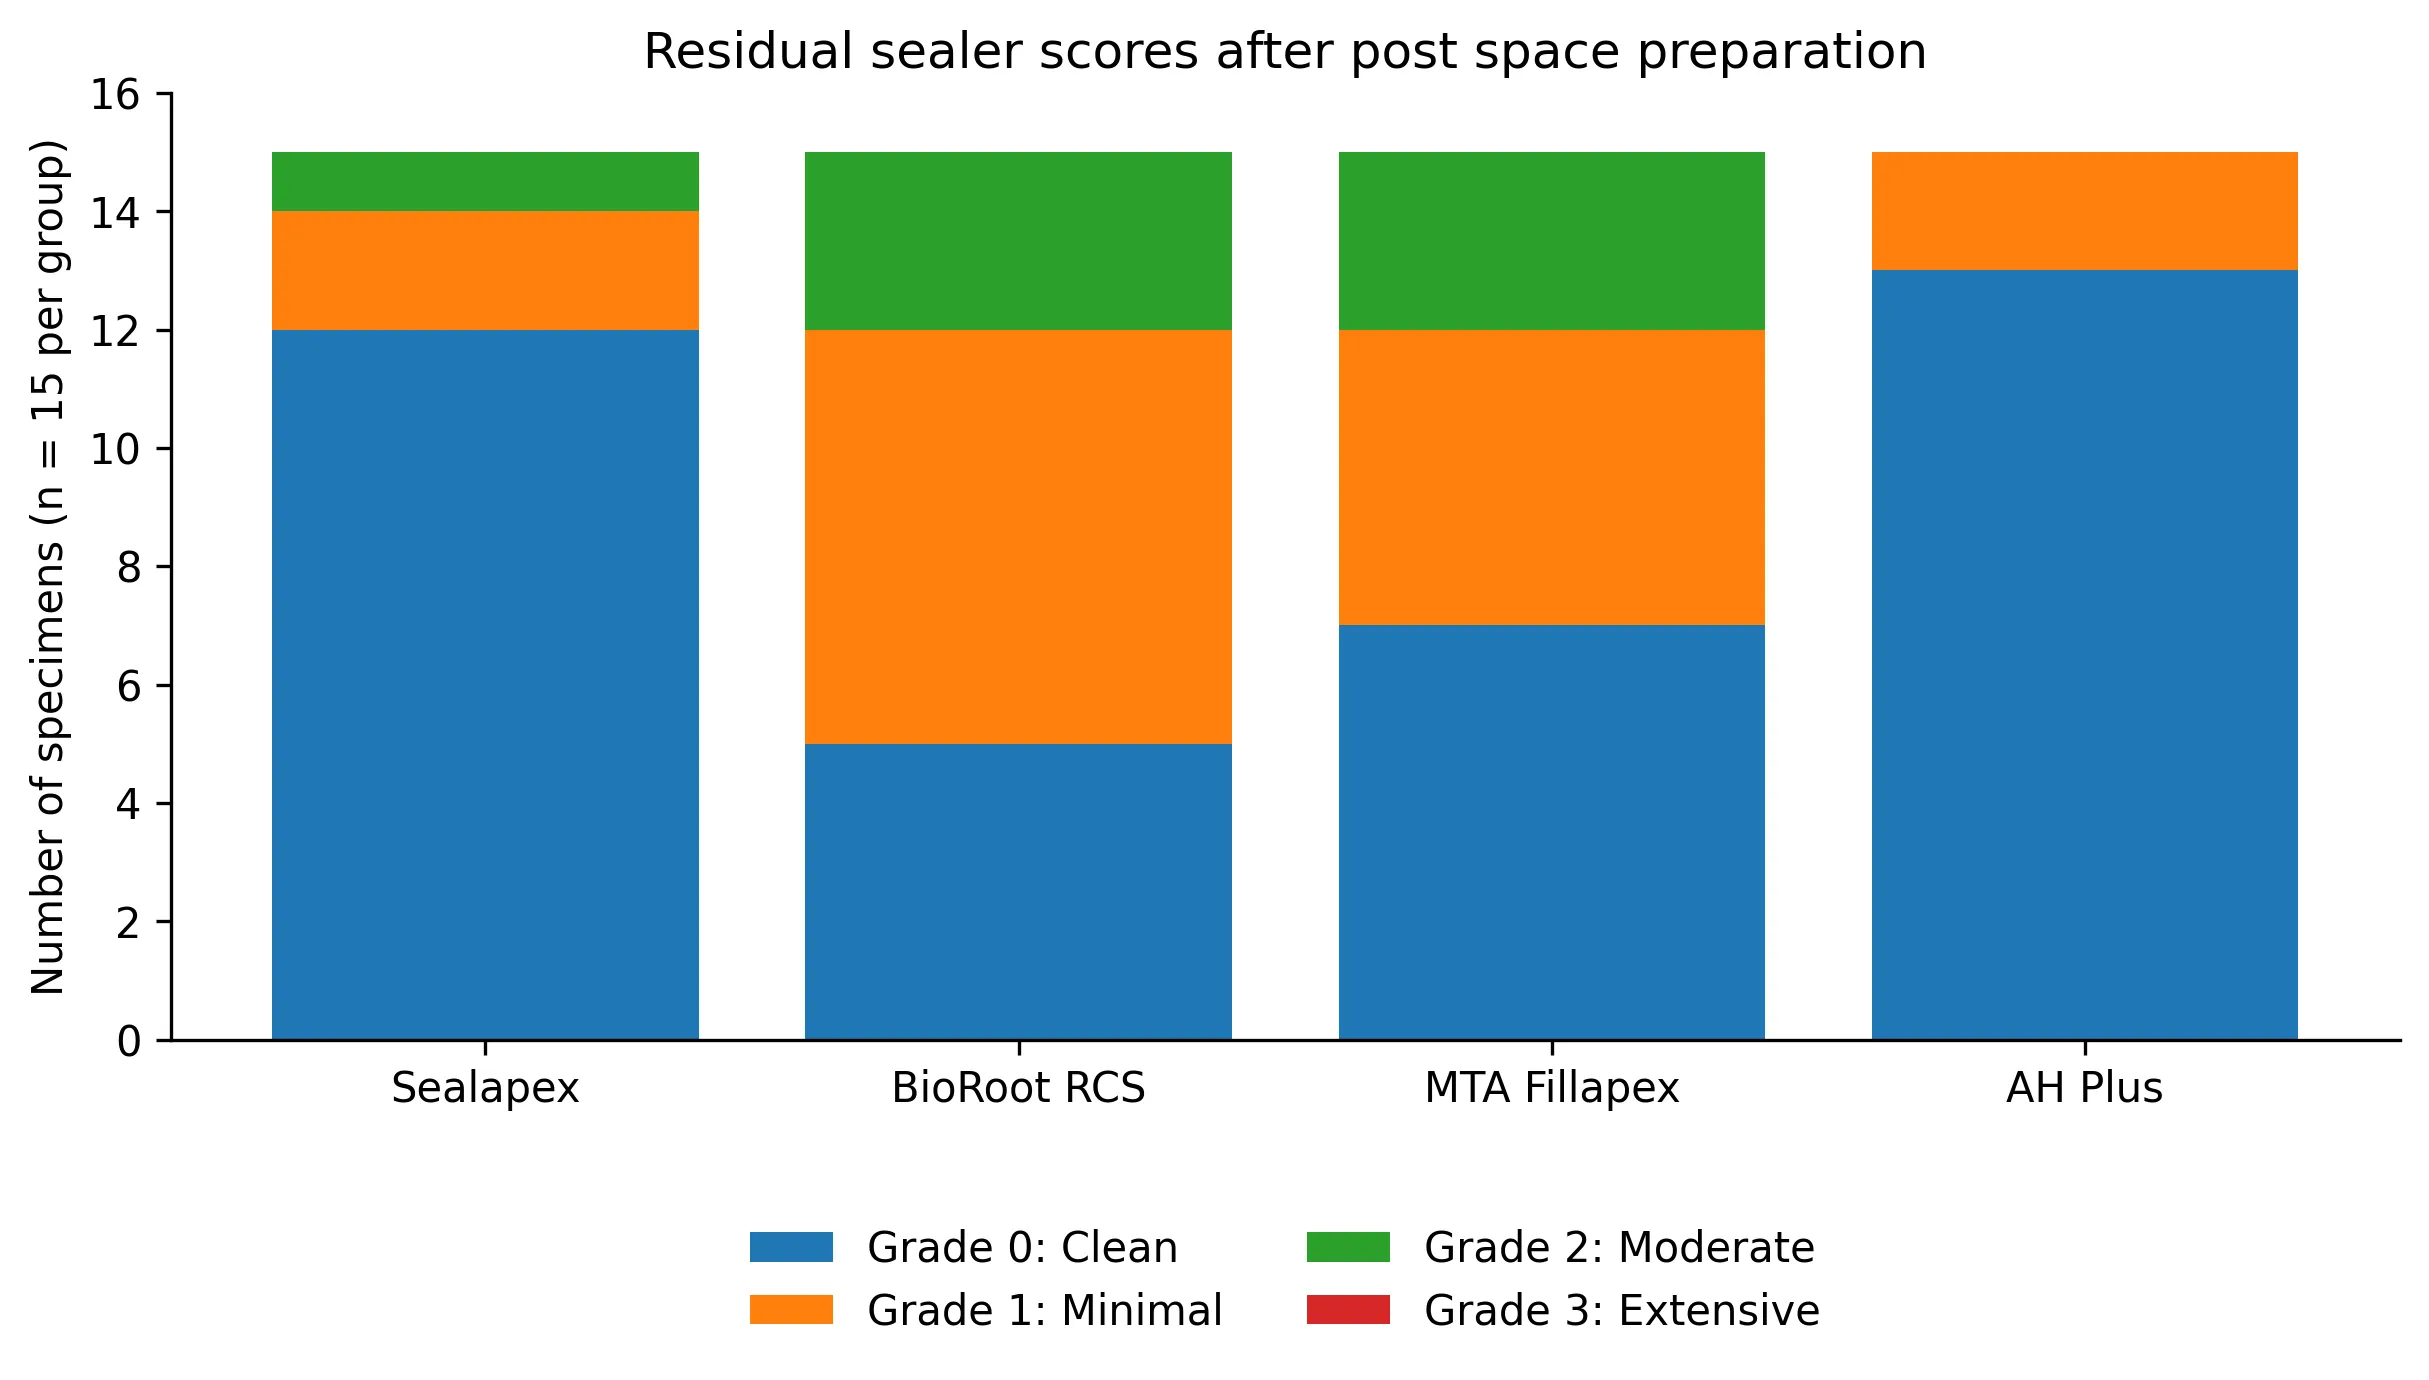
Figure 2: Distribution of residual sealer scores after post space preparation. Counts are shown for 15 specimens per group.
Table 2: Distribution of Residual Sealer Scores by Group
| Sealer group | Clean Grade 0 n (%) | Minimal Grade 1 n (%) | Moderate Grade 2 n (%) | Extensive Grade 3 n (%) | Total |
|---|---|---|---|---|---|
| Sealapex | 12 (80.0) | 2 (13.3) | 1 (6.7) | 0 (0.0) | 15 |
| BioRoot RCS | 5 (33.3) | 7 (46.7) | 3 (20.0) | 0 (0.0) | 15 |
| MTA Fillapex | 7 (46.7) | 5 (33.3) | 3 (20.0) | 0 (0.0) | 15 |
| AH Plus | 13 (86.7) | 2 (13.3) | 0 (0.0) | 0 (0.0) | 15 |
| Total | 37 (61.7) | 16 (26.7) | 7 (11.7) | 0 (0.0) | 60 |
Table 3: Reported Tests for Residual Score Distribution
| Test | Value | df | p value |
|---|---|---|---|
| Pearson chi square | 13.195 | 6 | 0.040 |
| Likelihood ratio | 14.911 | 6 | 0.021 |
| Linear by linear association | 0.434 | 1 | 0.510 |
| Valid cases | 60 | Not applicable | Not applicable |
The thesis reports a pairwise comparison between AH Plus and BioRoot RCS of p=0.0034. Because the raw scores and full pairwise output were not supplied as machine readable data, other pairwise values should be checked against the original statistical output before publication.
3.2 Push out bond strength
AH Plus produced the highest mean push out bond strength in all three root regions, while Sealapex produced the lowest. The overall comparison among the four groups was statistically significant at each level (p<0.001).
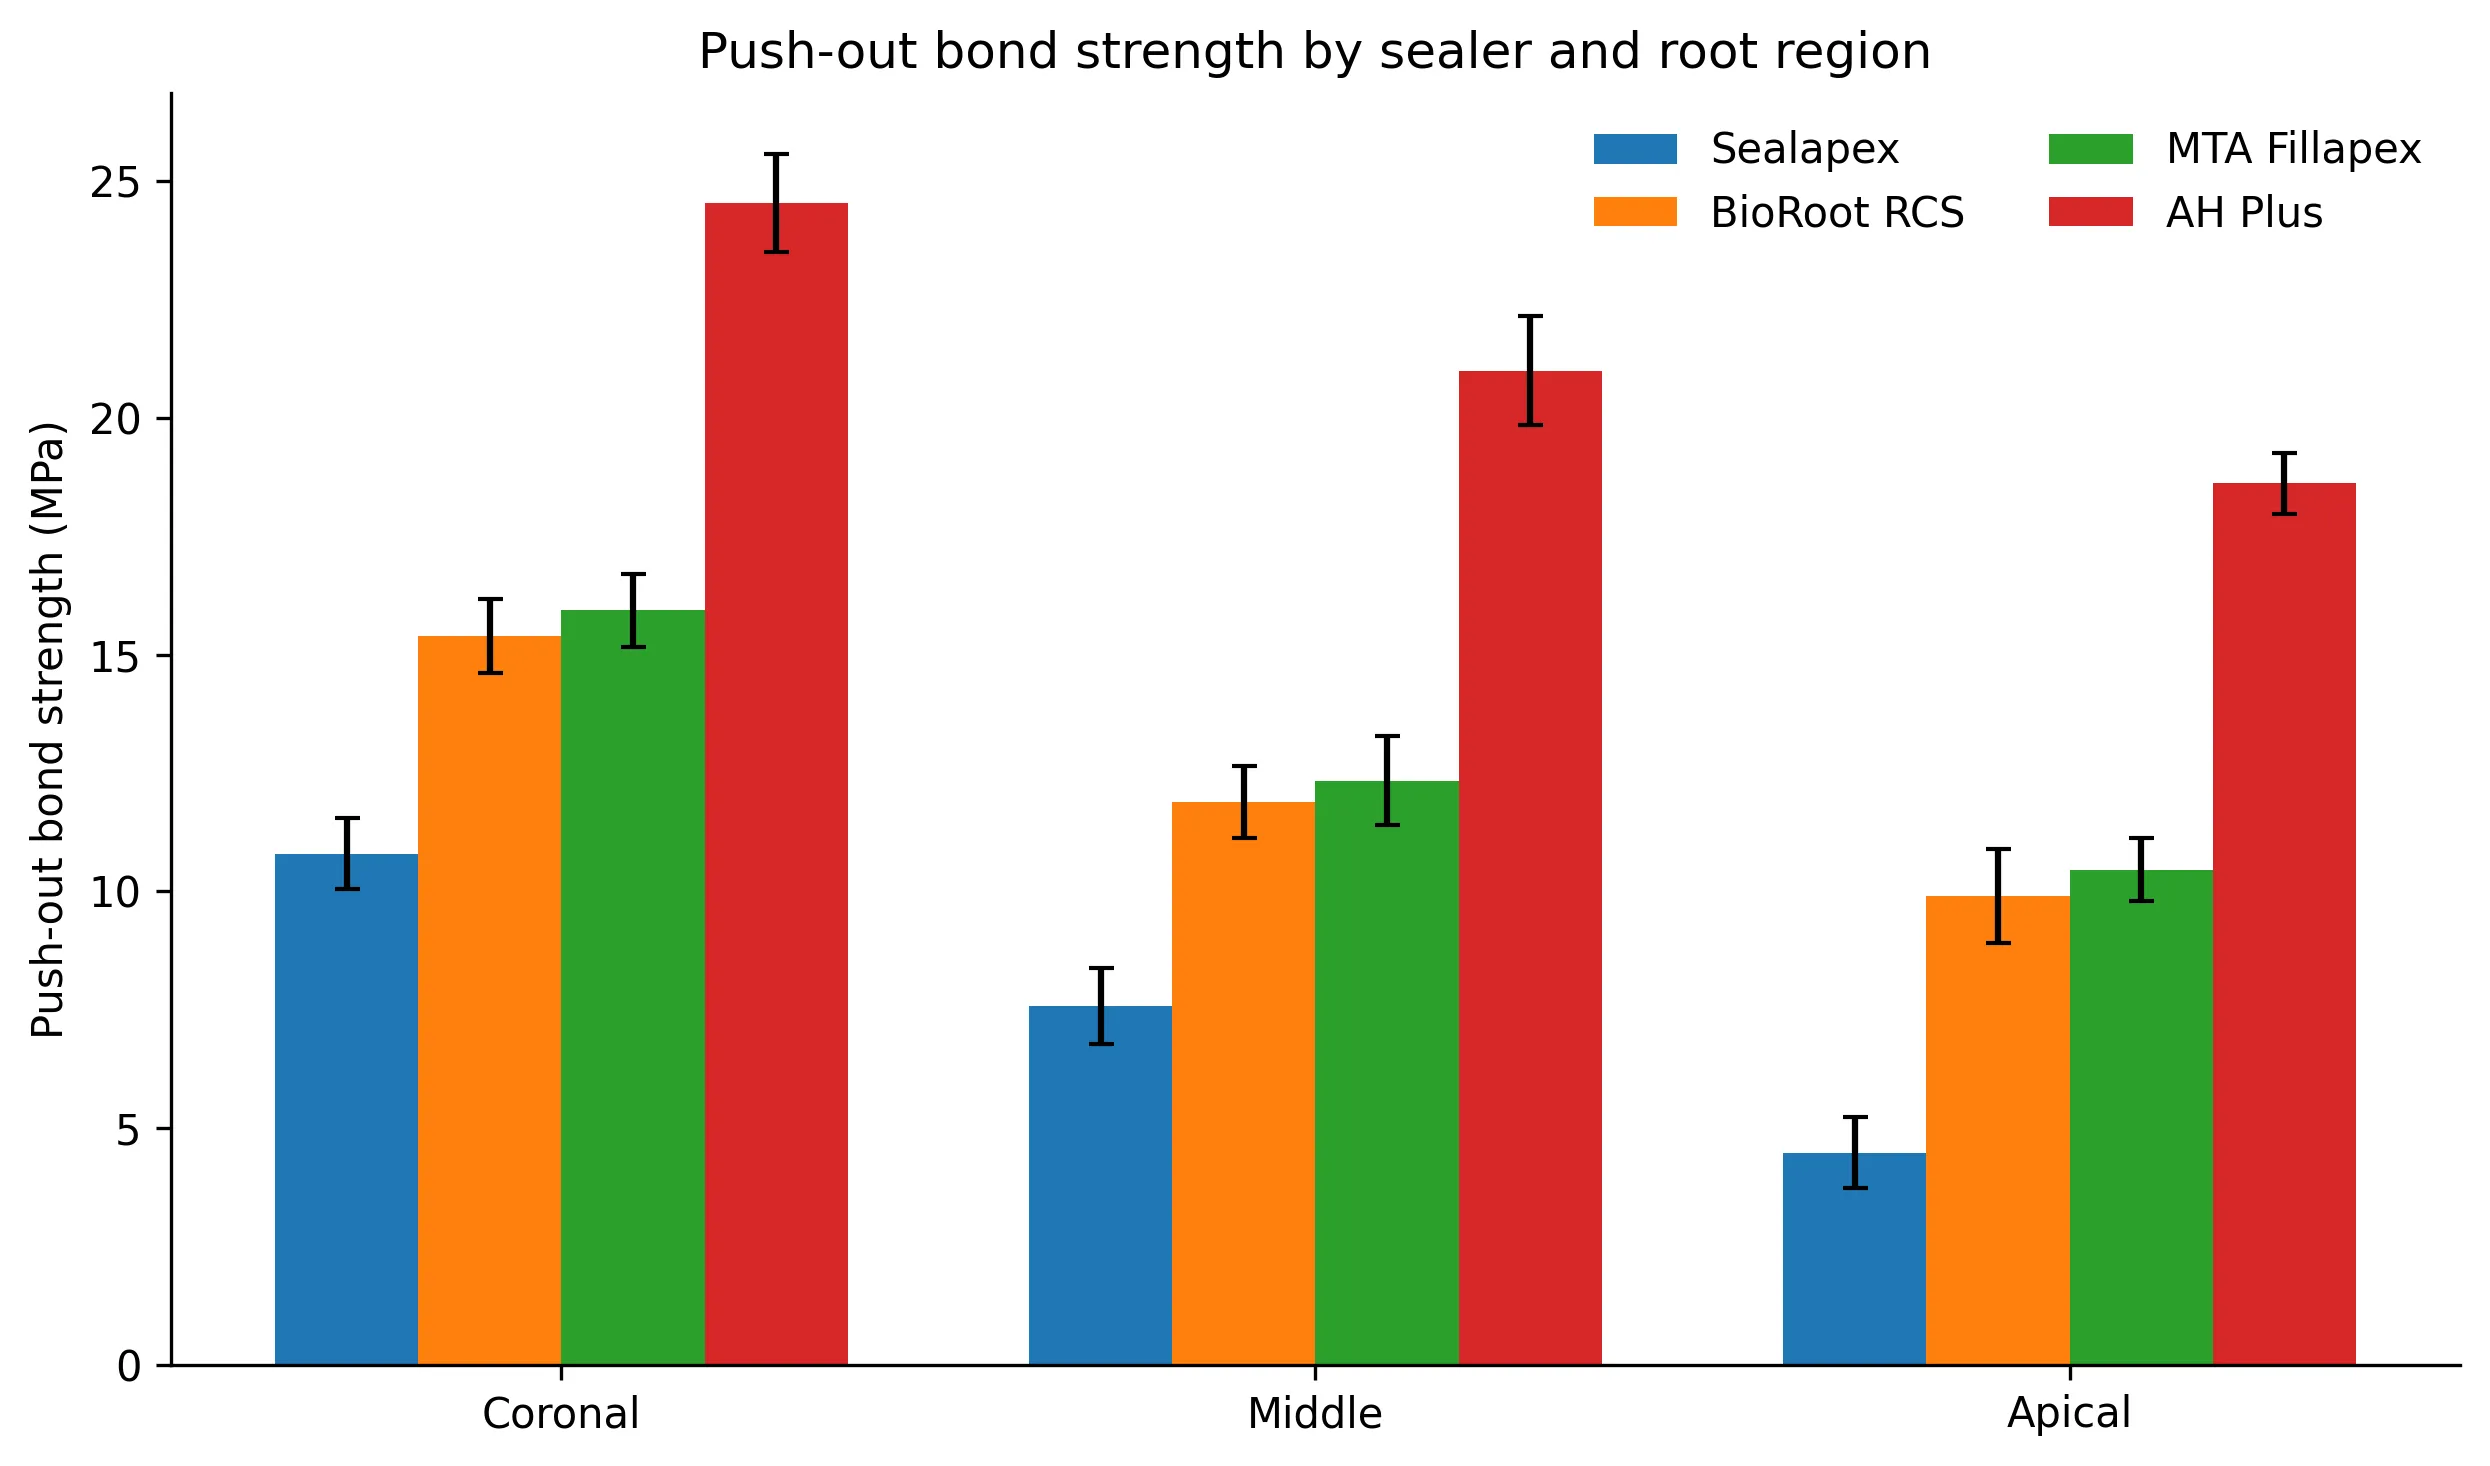
Figure 3: Mean push-out bond strength (MPa) in the coronal, middle, and apical root regions. Error bars indicate the reported standard deviations.
Table 4: Push Out Bond Strength in the Coronal Region (Source Thesis Caption: Table No. 1, Comparison of Mean Pushout Bond Strength (in mpa) Between Groups at Coronal Region Using One-way ANOVA Test)
| Sealer group | N | Mean (MPa) | SD | Minimum | Maximum | Overall p value |
|---|---|---|---|---|---|---|
| Sealapex | 15 | 10.80 | 0.75 | 9.4 | 11.9 | <0.001 |
| BioRoot RCS | 15 | 15.40 | 0.78 | 14.4 | 16.9 | |
| MTA Fillapex | 15 | 15.94 | 0.77 | 15.1 | 17.8 | |
| AH Plus | 15 | 24.55 | 1.04 | 22.8 | 27.2 |
Table 5: Push Out Bond Strength in the Middle Region (Source Thesis Caption: Table No. 3, Comparison of Mean Pushout Bond Strength (in mpa) Between Groups at Middle Region Using One-way ANOVA Test)
| Sealer group | N | Mean (MPa) | SD | Minimum | Maximum | Overall p value |
|---|---|---|---|---|---|---|
| Sealapex | 15 | 7.58 | 0.81 | 6.1 | 8.5 | <0.001 |
| BioRoot RCS | 15 | 11.90 | 0.76 | 10.9 | 13.5 | |
| MTA Fillapex | 15 | 12.34 | 0.94 | 10.8 | 13.7 | |
| AH Plus | 15 | 21.00 | 1.15 | 19.0 | 23.3 |
Table 6: Push Out Bond Strength in the Apical Region (Source Thesis Caption: Table No. 5, Comparison of Mean Pushout Bond Strength (in mpa) Between Groups at Apical Region Using One-way ANOVA Test)
| Sealer group | N | Mean (MPa) | SD | Minimum | Maximum | Overall p value |
|---|---|---|---|---|---|---|
| Sealapex | 15 | 4.48 | 0.75 | 2.7 | 5.2 | <0.001 |
| BioRoot RCS | 15 | 9.90 | 0.99 | 7.4 | 11.3 | |
| MTA Fillapex | 15 | 10.46 | 0.67 | 9.2 | 11.4 | |
| AH Plus | 15 | 18.62 | 0.64 | 17.3 | 20.0 |
Table 7: Push Out Bond Strength by Root Region and Sealer Group (Source Thesis Caption: Table No. 7, Comparison of Mean Pushout Bond Strength (in mpa) Between Different Regions of Tooth Samples in Each Group Using One-way ANOVA Test Followed by Tukey Post Hoc Test)
| Sealer group | Region | N | Mean (MPa) | SD | Reported overall p value |
|---|---|---|---|---|---|
| Sealapex | Coronal | 15 | 10.80 | 0.75 | <0.001 |
| Sealapex | Middle | 15 | 7.58 | 0.81 | |
| Sealapex | Apical | 15 | 4.48 | 0.75 | |
| BioRoot RCS | Coronal | 15 | 15.40 | 0.78 | <0.001 |
| BioRoot RCS | Middle | 15 | 11.90 | 0.76 | |
| BioRoot RCS | Apical | 15 | 9.90 | 0.99 | |
| MTA Fillapex | Coronal | 15 | 15.94 | 0.77 | <0.001 |
| MTA Fillapex | Middle | 15 | 12.34 | 0.94 | |
| MTA Fillapex | Apical | 15 | 10.46 | 0.67 | |
| AH Plus | Coronal | 15 | 24.55 | 1.04 | <0.001 |
| AH Plus | Middle | 15 | 21.00 | 1.15 | |
| AH Plus | Apical | 15 | 18.62 | 0.64 |
For each sealer group, the thesis reports a significant decrease in bond strength from the coronal to the middle and apical regions (p<0.001).
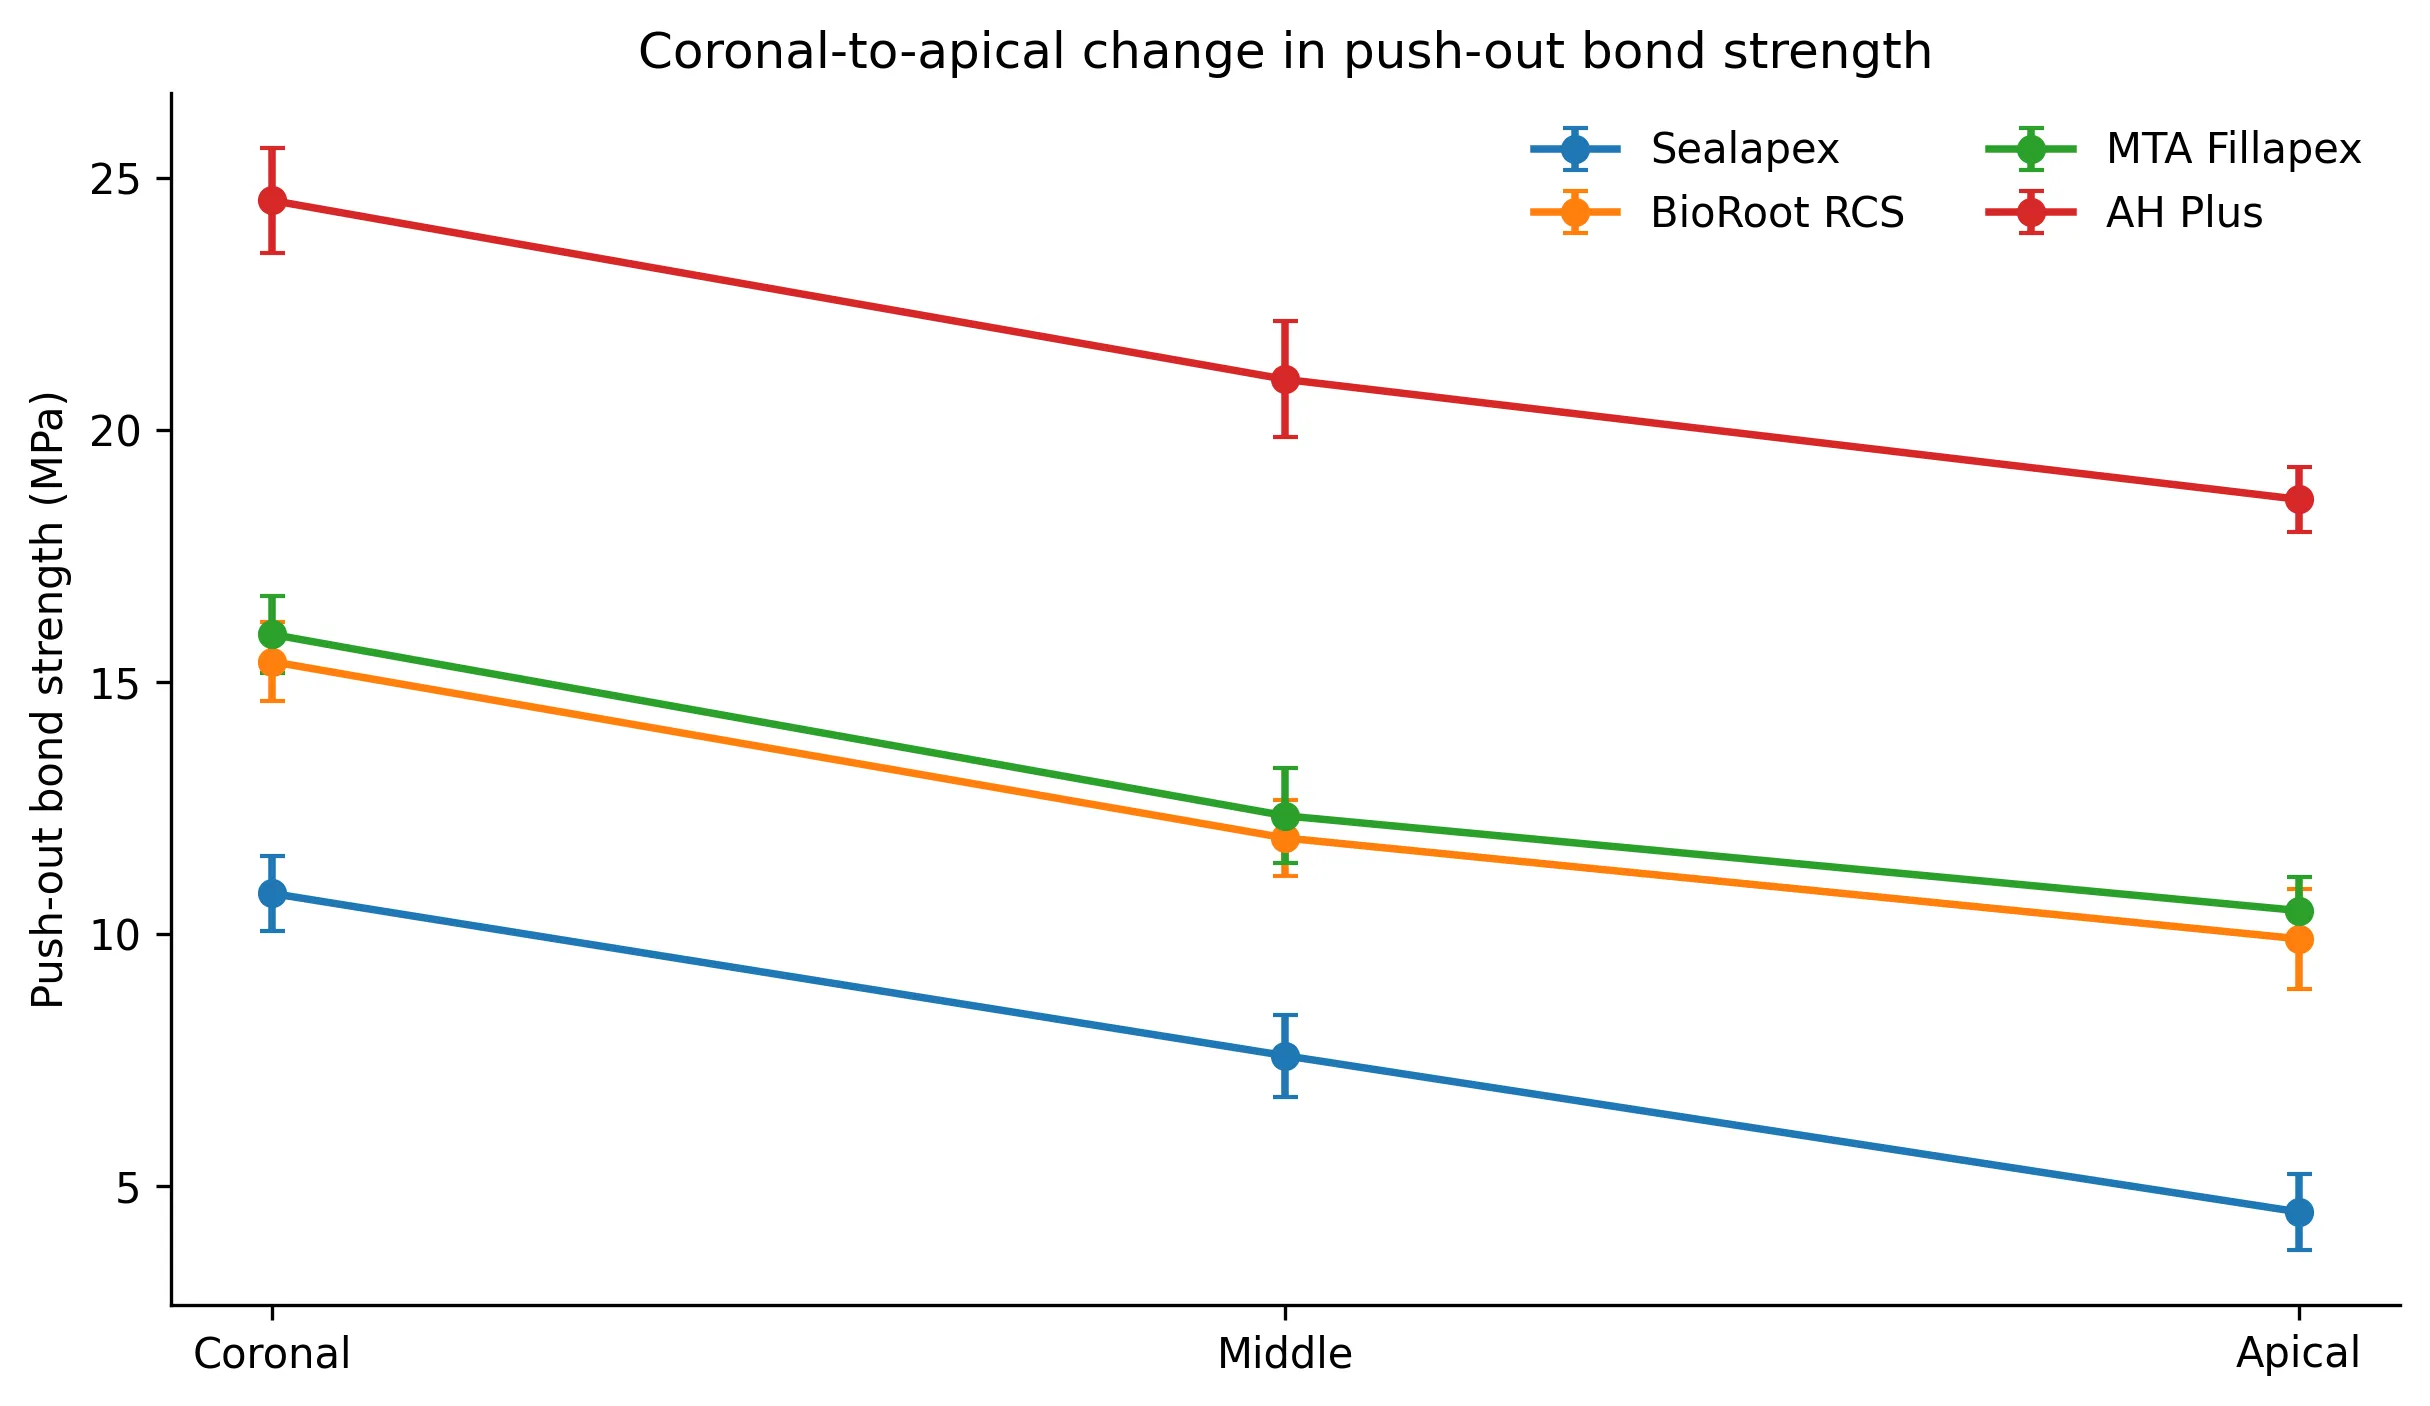
Figure 4: Regional trend in push-out bond strength for each sealer group. Error bars indicate the reported standard deviations.
3.3 Failure mode analysis
Adhesive failure was common, particularly in the apical region. Between group differences were not statistically significant in the coronal (p=0.06), middle (p=0.09), or apical (p=0.81) regions.
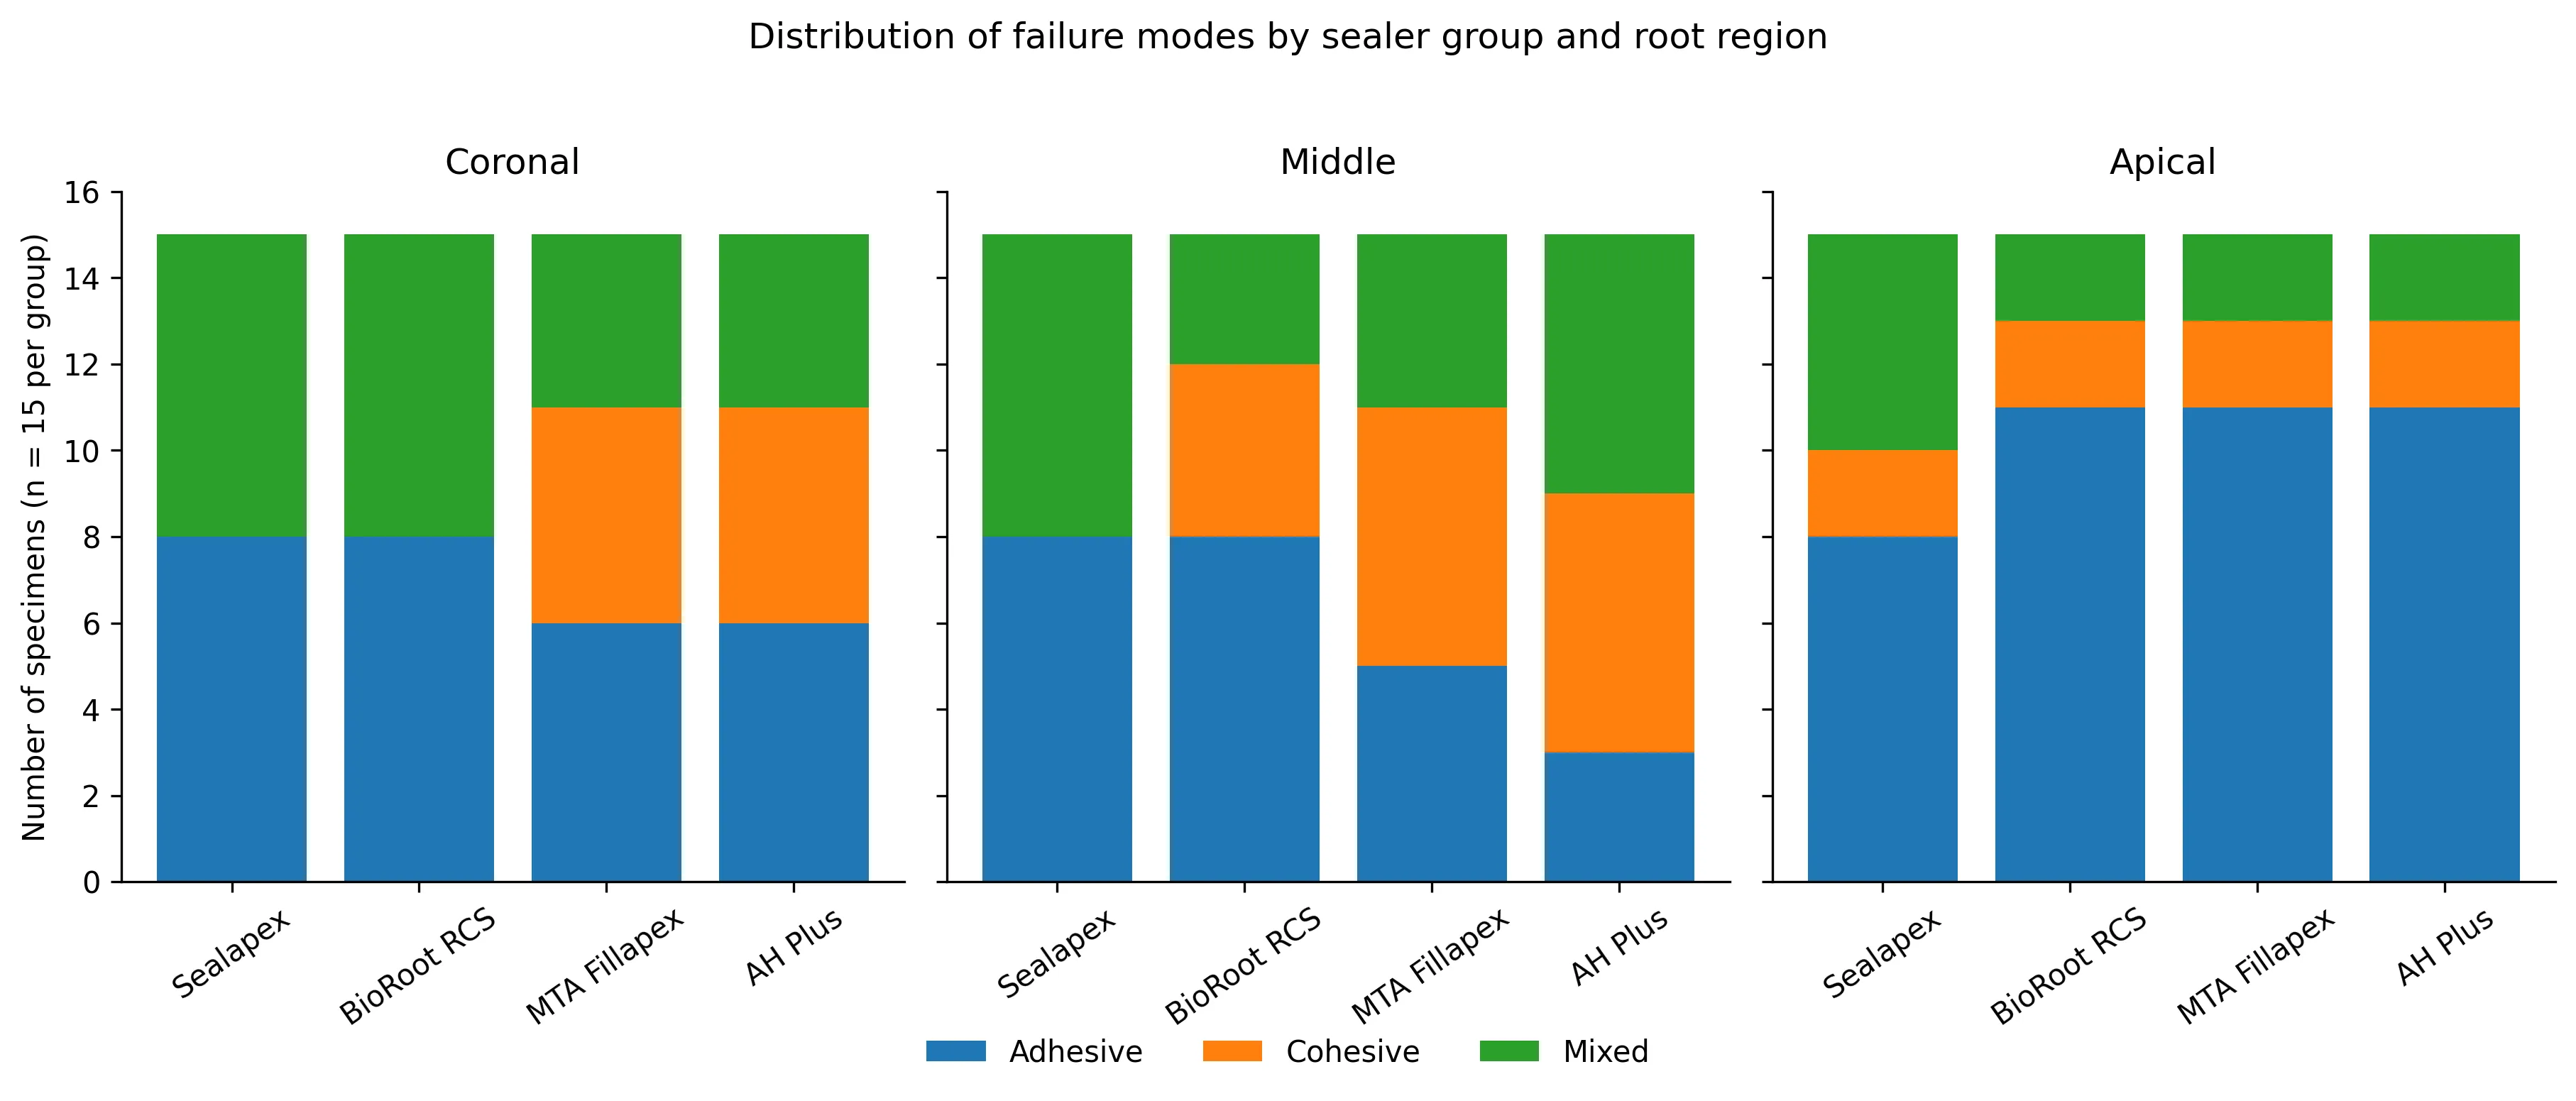
Figure 5: Failure mode counts by sealer group and root region. Each group contains 15 specimens per region.
Table 8: Failure Modes by Group and Root Region (Source Thesis Caption: Table No. 8, Comparison of Failure Modes Between Groups at Different Regions of the Tooth Samples Using Chi Square Test)
| Region | Failure mode | Sealapex n (%) | BioRoot RCS n (%) | MTA Fillapex n (%) | AH Plus n (%) | p value |
|---|---|---|---|---|---|---|
| Coronal | Adhesive | 8 (53.3) | 8 (53.3) | 6 (40.0) | 6 (40.0) | 0.06 |
| Coronal | Cohesive | 0 (0.0) | 0 (0.0) | 5 (33.3) | 5 (33.3) | |
| Coronal | Mixed | 7 (46.7) | 7 (46.7) | 4 (26.7) | 4 (26.7) | |
| Middle | Adhesive | 8 (53.3) | 8 (53.3) | 5 (33.3) | 3 (20.0) | 0.09 |
| Middle | Cohesive | 0 (0.0) | 4 (26.7) | 6 (40.0) | 6 (40.0) | |
| Middle | Mixed | 7 (46.7) | 3 (20.0) | 4 (26.7) | 6 (40.0) | |
| Apical | Adhesive | 8 (53.3) | 11 (73.3) | 11 (73.3) | 11 (73.3) | 0.81 |
| Apical | Cohesive | 2 (13.3) | 2 (13.3) | 2 (13.3) | 2 (13.3) | |
| Apical | Mixed | 5 (33.3) | 2 (13.3) | 2 (13.3) | 2 (13.3) |
DISCUSSION
The results indicate that sealer group was associated with residual scores and push out bond strength. AH Plus produced the highest proportion of clean post spaces and the highest bond strength at each root level, while Sealapex had relatively clean walls but the lowest bond strength. This contrast suggests that visible cleanliness alone cannot explain retention; sealer chemistry, dentin surface condition, cement compatibility, and polymerization may also contribute. Studies report that sealer composition and cementation timing can influence fiber post bonding, although protocols differ from those used here [3,4,7].BioRoot RCS showed the lowest proportion of clean post spaces and the highest proportion of minimal remnants, while MTA Fillapex showed intermediate residual scores and bond strength. Results from calcium silicate based sealer studies vary with the sealer, adhesive strategy, cement, and method [5,6,8]. Bond strength declined from coronal to apical regions in all four groups, consistent with reports of reduced apical values [4,7]. Adhesive failure was common, particularly apically, but group differences were not statistically significant at any level. Limitations include the in vitro design, 60 tooth sample, one cementation protocol, and lack of clinical follow up. Raw data were unavailable for independent statistical reanalysis; findings should be interpreted cautiously.
CONCLUSION
Within the limitations of this in vitro study, sealer type was associated with residual sealer scores and fiber post push out bond strength. AH Plus showed the highest proportion of clean post spaces and the greatest bond strength in the coronal, middle, and apical thirds. Sealapex showed comparatively clean post spaces but the lowest bond strength. BioRoot RCS had the lowest proportion of clean samples, while MTA Fillapex showed intermediate results. Bond strength decreased significantly from the coronal to the apical region for all four sealers. Failure mode differences between groups were not statistically significant at any root level. These findings support evaluating both sealer removability and adhesive performance when selecting materials for post endodontic restoration. Clinical studies and independent replication are needed before making clinical recommendations.
REFERENCES

Dr. Purvi Mehta, Dr. Kiran J. Kasti, Dr. Ananthakrishna S., Dr. Pradeep Pr, Dr. Aishwarya Bhattad, Dr. Vikash Sharma, Influence of Root Canal Sealers on Sealer Remnants After Post Space Preparation and Fiber Post Adhesion: An in Vitro Study, Int. J. Sci. R. Tech., 2026, 3 (10), 996-1004. https://doi.org/10.5281/zenodo.23455627
 10.5281/zenodo.23455627