

We use cookies to ensure our website works properly and to personalise your experience. Cookies policy
Department of Computer Science (Software & Web Development), Ogun State Institute of Technology, Igbesa [Ogitech]
Cloud-native applications deployed within Kubernetes-orchestrated environments present significant performance monitoring challenges, particularly under variable and high-concurrency load conditions. Existing practice commonly treats load generation and infrastructure observability as separate, manually coordinated activities, delaying root-cause identification when performance degrades. This paper proposes and evaluates a scalable, integrated performance testing framework that combines Apache JMeter for load generation, Kubernetes for orchestration, Prometheus for metrics collection, and Grafana for real-time visualization within a unified evaluation pipeline. The framework was evaluated across baseline, stress, and scalability test scenarios using throughput, latency, error rate, and CPU/memory utilization. Baseline testing at 50 concurrent users established a stable reference of 128 requests per second at 72 ms 95th-percentile latency. Stress testing identified a failure threshold at 350 concurrent users, marked by a hockey-stick latency pattern and a cliff-edge error rate spike visible in real time on Grafana. Scalability testing revealed sub-linear throughput scaling of 67.2% when pod replicas were doubled, attributable to a shared database bottleneck exposed through correlated Prometheus metrics. These results show that directly linking JMeter load-generation data with Prometheus infrastructure telemetry lets teams move beyond knowing a system failed to identifying which component caused the failure, giving DevOps engineers, developers, and organisational leadership the diagnostic precision to resolve bottlenecks significantly faster than disconnected testing and monitoring workflows permit.
The rapid adoption of cloud-native architectures has changed how modern applications are designed, deployed, and scaled: monolithic systems have given way to loosely coupled microservices, each containerized and orchestrated across distributed infrastructure. This shift enables deployment flexibility and horizontal scalability, but introduces failure modes that conventional testing approaches struggle to address [1]. A latency spike or resource exhaustion in one service can cascade upstream through dependency chains and degrade the entire application even when each service appears healthy in isolation [2]. Containerization further introduces silent bottlenecks, such as inter-container network latency, startup overhead, and pod resource contention, that remain invisible in local development but surface only under a live Kubernetes deployment [3]. Untested auto-scaling policies compound the problem, risking either wasted infrastructure spend or service unavailability during traffic surges [4].
Existing research treats performance testing and cloud-native observability largely as separate concerns: JMeter has been extensively studied for load generation, while Prometheus and Grafana have been evaluated independently for metrics collection, leaving integrated evaluation pipelines underexplored [5]. This paper addresses that gap by proposing and evaluating a scalable performance testing framework that integrates Apache JMeter, Kubernetes, Prometheus, and Grafana into a single automated pipeline, evaluated across baseline, stress, and scalability test scenarios using throughput, latency, error rate, and CPU/memory utilization as primary metrics.
2. LITERATURE REVIEW
2.1 Apache JMeter as a Performance Testing Tool
Apache JMeter is among the most widely adopted open-source load-testing tools, valued for its protocol flexibility (HTTP, HTTPS, JDBC, FTP) and distributed testing capability, which allows realistic global traffic patterns to be simulated across geographically dispersed nodes [5]. The literature also notes recurring limitations: the controller machine can itself become a bottleneck under large virtual-user counts, distorting latency measurements [2],[5], and its graphical test-plan interface is harder to version-control at scale than code-driven alternatives such as Gatling or k6 [3].
2.2 Kubernetes for Cloud-Native Container Orchestration
Container technologies such as Docker improve packaging and portability but do not address operational management at scale; unorchestrated deployments require manual restarts, scaling, and traffic distribution [4]. Kubernetes automates this through declarative desired-state management, continuously reconciling actual cluster state (like restarting failed pods, provisioning replicas via the Horizontal Pod Autoscaler (HPA), and load-balancing traffic) making it the de facto standard for self-healing, cloud-native infrastructure [1],[4].
2.3 Prometheus and Grafana for Observability and Visualisation
Prometheus and Grafana form the dominant observability stack for Kubernetes deployments. Prometheus's pull-based, time-series model suits the dynamic, ephemeral nature of containerized environments, scraping metrics from pods, nodes, and exporters for real-time alerting and retrospective analysis via PromQL [2],[3]. Grafana complements this by consuming Prometheus data sources without storing data itself, and rendering it as threshold-coloured, alert-enabled dashboards that support anomaly detection and scaling decisions [1],[3]. Over 86% of Kubernetes-using organizations rely on Prometheus for monitoring, underscoring its position as the ecosystem standard [6].
2.4 Research Gap
The literature treats performance testing and observability in isolation: JMeter research emphasizes load-generation methodology, while Prometheus/Grafana research emphasizes metrics architecture and dashboards, leaving integrated, automated evaluation pipelines largely unexplored [1],[5]. In practice, most teams treat the two as sequential using JMeter to detect failure and Prometheus afterwards to diagnose it, a disconnected workflow that delays root-cause identification. This paper closes that gap with a cohesive framework automating the full performance evaluation lifecycle within a Kubernetes-orchestrated environment.
3. PROPOSED FRAMEWORK AND ARCHITECTURE
3.1 Framework Overview
The proposed framework integrates four industry-standard tools into a single automated performance evaluation pipeline, organized as a four-layer architecture, (i.e., load generation, container orchestration, metrics collection, and visualization (Figure 3.1), in which each layer's output feeds the next, closing the gap identified in the literature between disconnected load testing and observability.
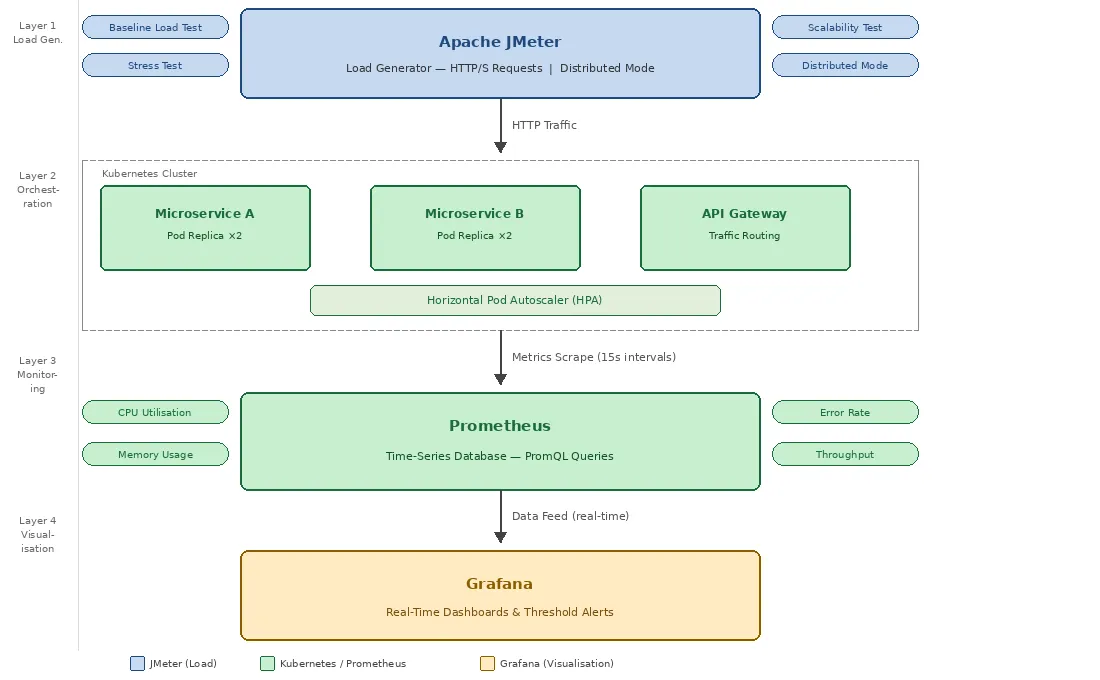
Figure 3.1: Proposed Performance Testing Framework: Four-Layer Architecture
3.2 Framework Layers and Integrated Workflow
Table 3.1 summarises the role of each layer. The four layers operate as a closed loop: JMeter generates load against the application; Kubernetes receives, routes, and scales in response; Prometheus continuously records the resulting resource and response behaviour; and Grafana visualises these observations in real time - enabling evaluation, observability, and diagnosis to occur simultaneously rather than sequentially.
|
Layer |
Tool |
Function |
|
1. Load Generation |
Apache JMeter |
Simulates concurrent users via HTTP thread groups; runs baseline, stress, and scalability scenarios in distributed mode to avoid becoming a bottleneck itself. |
|
2. Orchestration |
Kubernetes |
Deploys and scales microservices as Deployments; routes traffic through an API Gateway; HPA provisions replicas during scalability testing. |
|
3. Metrics Collection |
Prometheus |
Scrapes throughput, latency, error rate, and CPU/memory metrics from pods and nodes every 15 seconds into a queryable time-series store. |
|
4. Visualisation |
Grafana |
Renders Prometheus data as real-time dashboards with threshold alerts (e.g., error rate > 1%, CPU > 80%). |
Table 3.1: Framework Layers and Responsibilities
4. METHODOLOGY
4.1 Test Environment Configuration
The evaluation was conducted within a Kubernetes cluster hosting containerized microservices, each exposing a Prometheus-instrumented metrics endpoint for request counts, error counts, and response-duration histograms. System-level CPU and memory metrics were collected via Node Exporter and kube-state-metrics, scraped every fifteen seconds. Grafana was connected to Prometheus as its data source, with one dashboard panel per evaluation metric. Apache JMeter ran in distributed mode (i.e., one controller coordinating multiple worker nodes) to prevent the load generator itself from becoming a bottleneck, sending HTTP GET/POST requests with zero think-time to produce conservative, worst-case performance estimates.
4.2 Evaluation Metrics
Four metrics were collected across all scenarios, consistent with established performance-engineering practice (Table 4.1).
|
Metric |
Definition |
Measurement Method |
|
Throughput |
Requests successfully processed per second |
Prometheus counters, reported as a one-minute rolling rate in Grafana |
|
Latency |
Mean and 95th-percentile response time (ms) |
Derived from Prometheus histogram buckets |
|
Error Rate |
% of requests returning HTTP 4xx/5xx (such as error 404, 502, etc.) |
Monitored continuously in Grafana; alert threshold 5% |
|
CPU & Memory Utilisation |
Per-pod CPU (% of limit) and memory (MB) |
Node Exporter / kube-state-metrics, scraped every 15s |
Table 4.1: Evaluation Metrics and Measurement Method
4.3 Test Scenarios
Three scenarios were executed sequentially (Table 4.2). The baseline test held load at 50 users for 20 minutes to establish a stable reference, requiring non-increasing CPU/memory trends and an error rate at or below 0.1%. The stress test escalated load in increments of 50 users every two minutes until mean response time exceeded 2,000 ms or the error rate exceeded 5%, with success defined as a clearly identified failure mode rather than system survival. The scalability test held load fixed at 500 users while pod replicas were doubled from 2 to 4 between two 15-minute phases, with efficient scaling defined as an approximately proportional increase in throughput.
|
Test Scenario |
Virtual Users |
Duration |
Pod Count |
Stop Condition |
|
Baseline Load |
50 (fixed) |
20 minutes |
2 |
Stable metrics throughout |
|
Stress Test |
50 → +50 per 2 min |
Until failure |
2 |
RT > 2s or Error Rate > 5% |
|
Scalability Test |
500 (fixed) |
15 min × 2 phases |
Phase 1: 2 / Phase 2: 4 |
Throughput comparison |
Table 4.2: Test Scenario Parameters
5. RESULTS AND DISCUSSION
5.1 Baseline Load Test Results
At 50 concurrent users over 20 minutes, the application performed stably across all four metrics: throughput settled at 128 req/s after a three-minute warm-up, 95th-percentile latency held at 72 ms, error rate remained near zero, and CPU/memory plateaued at 25% and 260 MB respectively, well within resource limits. These flat, non-increasing trends satisfied the success criteria (no memory leak, no latency drift) and served as the reference benchmark for the stress and scalability comparisons.
5.2 Stress Test Results
Table 5.1 and Figure 5.1 summarize performance across increasing load. Throughput and latency rose roughly linearly through 200 users, then latency inflected sharply beyond 250 users as CPU approached saturation, the hockey-stick pattern characteristic of thread-pool exhaustion, before throughput itself declined past 300 users as CPU time shifted toward context-switching and garbage collection. The error rate spiked from near-zero to 5.2% at 350 users, where Kubernetes health checks began returning HTTP 503 responses, marking the failure threshold. Because the system failed explicitly rather than silently, this confirmed correctly functioning health-check and circuit-breaker configurations.
|
Concurrent Users |
Throughput (req/s) |
Latency p95 (ms) |
Error Rate (%) |
CPU Usage (%) |
|
50 |
128 |
72 |
0.00 |
25 |
|
100 |
165 |
78 |
0.00 |
38 |
|
150 |
195 |
85 |
0.00 |
52 |
|
200 |
221 |
95 |
0.10 |
68 |
|
250 |
238 |
118 |
0.20 |
81 |
|
300 |
241 |
210 |
0.50 |
94 |
|
350 |
228 |
890 |
5.20 |
100 |
|
400 |
190 |
2,100 |
18.40 |
100 |
Table 5.1: Stress Test Performance Metrics Across Increasing Concurrent User Load
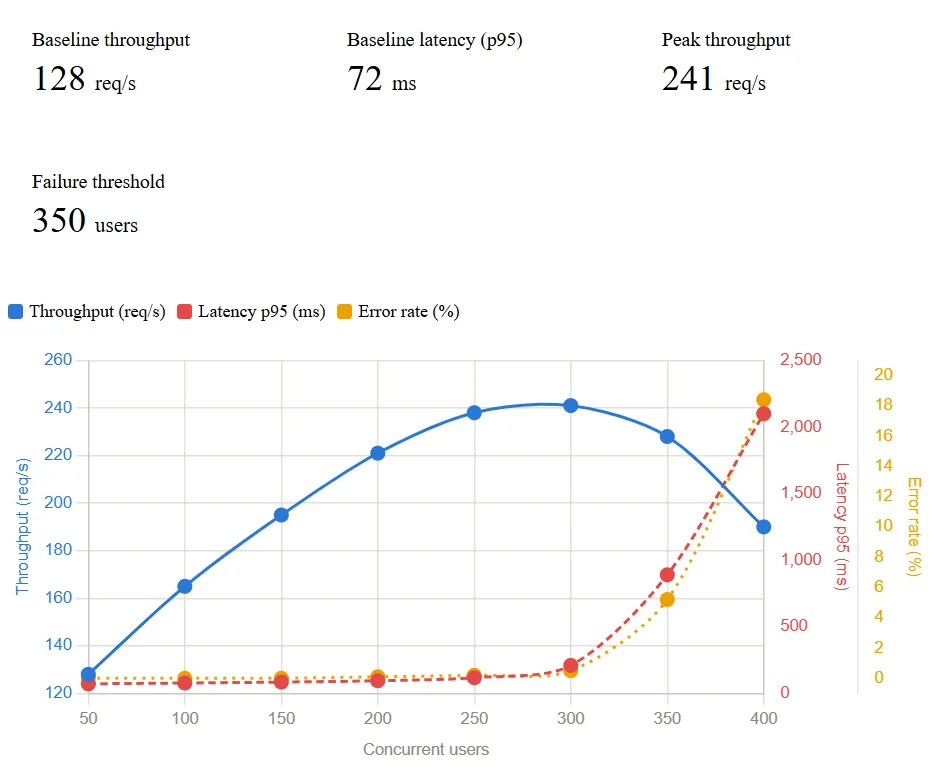
Figure 5.1: Baseline and Stress Test Performance Profile: Throughput, Latency, and Error Rate vs. Concurrent Users
5.3 Scalability Test Results
Table 5.2 compares the 2-pod and 4-pod deployments under a fixed 500-user load. Doubling pod replicas increased throughput by only 67.2% rather than the theoretical 100%, a sub-linear result attributable to three factors: a shared database connection pool that did not scale with pod count, additional inter-pod network and load-balancing overhead, and uneven initial traffic distribution during round-robin equilibration. Despite the sub-linear throughput gain, per-pod CPU utilisation fell from 96% to 58% and error rate fell by 87.2%, confirming that the 2-pod deployment had been genuinely overloaded and that horizontal scaling delivered a meaningful reliability recovery.
|
Metric |
Phase 1 (2 Pods) |
Phase 2 (4 Pods) |
Improvement |
|
Throughput (req/s) |
198 |
331 |
+67.2% |
|
Latency p95 (ms) |
340 |
189 |
−44.4% |
|
Error Rate (%) |
3.20 |
0.41 |
−87.2% |
|
CPU Usage per Pod (%) |
96 |
58 |
−39.6% |
|
Memory per Pod (MB) |
398 |
271 |
−31.9% |
Table 5.2: Scalability Test Comparison Between 2-Pod and 4-Pod Deployments
5.4 Discussion
These results support the central argument that an integrated JMeter–Kubernetes–Prometheus–Grafana pipeline provides substantially greater diagnostic value than disconnected load testing and monitoring. Real-time Grafana visualization allowed the stress test's latency inflection and error-rate spike to be pinpointed live rather than discovered retrospectively. More significantly, the scalability test shows why infrastructure telemetry must accompany load-test results: a team relying on JMeter throughput data alone would judge the 2-to-4-pod scale-out a success, without detecting that a shared database connection pool remained the binding constraint on further capacity growth. Correlating JMeter's application-layer data with Prometheus's infrastructure-layer data exposes this bottleneck in a way neither tool reveals independently.
CONCLUSION
This paper has shown that integrating Apache JMeter, Kubernetes, Prometheus, and Grafana into a unified performance testing framework substantially reduces the time required to identify and diagnose cloud-native performance issues. The framework's diagnostic value derives not from any single tool but from the direct linkage between JMeter's load-generation data and Prometheus's infrastructure telemetry, rendered actionable in real time through Grafana. Across three scenarios, the framework identified a precise stress-test failure threshold at 350 users and revealed that scalability testing's 67.2% throughput improvement was capped by a shared database bottleneck invisible to load-generation tooling alone. DevOps engineers gain faster root-cause identification, organisations gain more accurate cost-optimization decisions, and developers gain continuous, automated feedback on the performance impact of code changes.
FUTURE WORK
REFERENCES

Oloyede Emmanuel Opeolorun*, Lawal Ahmed Oladimeji, Sholademi Adeshope Samiat, Omolaja Daniel Ayobami, Omoloye Bolaji Emmanuel, Kuye Idris Adebanjo, Alokwem Chizelum Victor, Performance Evaluation Of Cloud-Native Applications Using Apache JMeter: A Scalable Testing Framework, Int. J. Sci. R. Tech., 2026, 3 (8), 1037-1043. https://doi.org/10.5281/zenodo.22206442
 10.5281/zenodo.22206442