

We use cookies to ensure our website works properly and to personalise your experience. Cookies policy
Dept. of Electrical and Electronics Engineering, K.Ramakrishnan College of Technology, Tiruchirappalli, Tamil Nadu
The proposed paper presents a compact, non-wearable biosensor system for monitoring blood oxygen saturation and estimating glucose-related optical measurements without requiring a conventional finger-prick blood sample. The system uses an Arduino Uno as the main controller. A MAX30102 sensor is used to measure blood oxygen saturation (SpO?) and heart rate, while an infrared LED, photodiode, and signal-conditioning circuit are used as an experimental optical glucose-sensing arrangement. The measured parameters are processed by the Arduino Uno and displayed on an OLED display. A buzzer provides an alert when the measured or estimated values cross predefined limits. An HC-05 Bluetooth module transmits the readings wirelessly to a mobile phone for remote observation. The proposed system provides a low-cost educational prototype for demonstrating biomedical sensing, signal processing, embedded systems, and wireless health-data monitoring.
Health monitoring is important for detecting abnormal physiological conditions and maintaining good health. Among the various health parameters, blood oxygen saturation (SpOâ‚‚), heart rate, and blood glucose level are commonly monitored. SpOâ‚‚ indicates the amount of oxygen present in the blood, while heart rate gives information about the activity of the cardiovascular system. Blood glucose is an important parameter for monitoring glucose regulation and diabetes. Conventional glucose testing generally requires a blood sample, whereas oxygen saturation is usually measured using an optical pulse oximeter. Using separate devices for different parameters can be inconvenient and may increase the cost of monitoring.
The proposed paper, “Smart Biosensor for Glucose and Oxygen Level Monitoring using Arduino Uno and Bluetooth,” is designed as a low-cost, non-wearable monitoring prototype. The system uses an Arduino Uno as the main controller. It receives signals from different sensors, processes the readings, and controls the output devices. The Arduino Uno is suitable for this paper because it is simple to program, economical, and supports many sensor and communication modules.
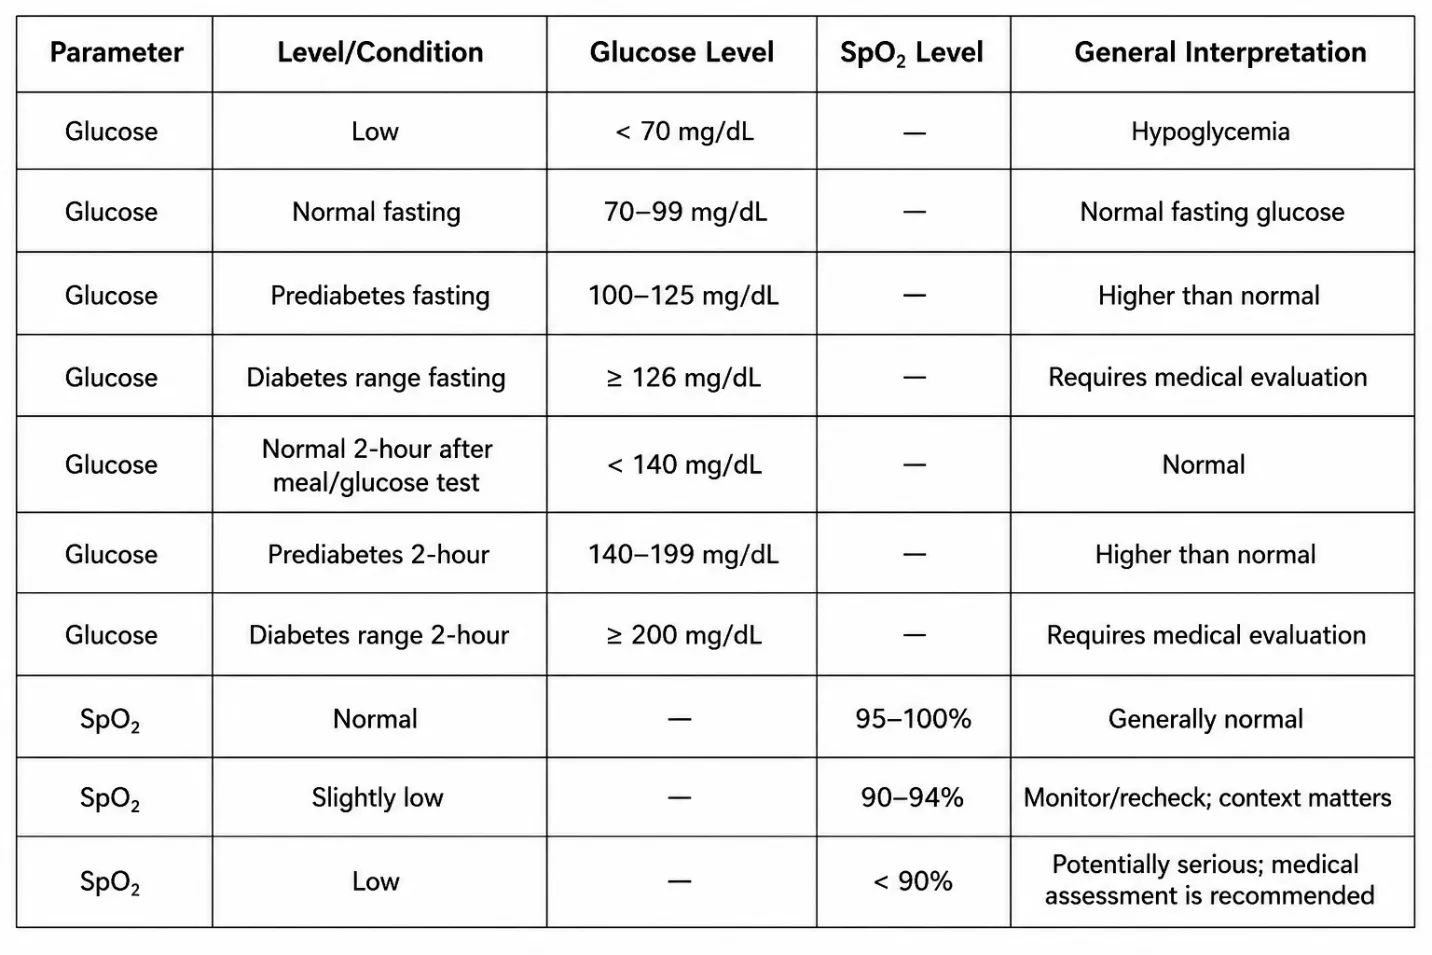
Table 1: Range of Level of Glucose and SpO2
Table.1 shows the range of level for oxygen monitoring, a MAX30102 sensor is used to measure SpOâ‚‚ and heart rate. The sensor works using optical signals and detects changes caused by blood circulation in the finger. The sensor communicates with the Arduino through the I²C interface. When the finger is placed on the sensor, the Arduino receives the optical data and processes it to obtain the required readings.
The paper also contains an experimental optical glucose-sensing circuit consisting of an IR LED, photodiode, and LM358 operational amplifier. The IR LED provides infrared illumination, and the photodiode detects the optical response. The LM358 amplifies and conditions the weak signal from the photodiode. The amplified signal is then connected to an analog input of the Arduino. The Arduino processes this signal to produce an experimental glucose estimation. Since non-invasive glucose measurement is affected by several factors such as skin characteristics, temperature, sensor position, and ambient light, this section is intended only for educational and experimental purposes and is not a clinically validated glucose meter.
The measured information is displayed on a 0.96-inch OLED display. The display can show SpOâ‚‚ percentage, heart rate, estimated glucose value, and system status. A piezoelectric buzzer is also included to provide an audible alert when a programmed threshold is crossed. This makes it easier for the user to identify abnormal readings during the demonstration.
Another important feature of the system is Bluetooth communication. An HC-05 Bluetooth module is connected to the Arduino to transmit the measured values to a mobile phone. The user can view the readings on a suitable mobile application without continuously checking the OLED display. This feature demonstrates wireless transmission of biomedical data and can be extended in the future to include graphs, data storage, measurement history, and notifications.
LITERATURE SURVEY:
Kim et al. (2019) have reviewed the development of wearable biosensors for healthcare monitoring and highlighted their ability to continuously measure physiological and biochemical parameters from body fluids such as sweat, tears, saliva and interstitial fluid. The study emphasized electrochemical and optical sensing techniques for non-invasive and minimally invasive monitoring. This work is important for the proposed smart biosensor because it establishes the basis for integrating multiple health parameters into a compact wearable system. The use of wireless communication can further improve accessibility by transmitting sensor readings to a smartphone in real time.
Morales-Narváez et al. (2021) have presented a review of advances in biosensors for continuous glucose monitoring and discussed different wearable approaches for measuring glucose in body fluids. The authors examined sweat, tears and other biological fluids as alternatives to conventional blood-based measurement. The study pointed out that accuracy, sensitivity, repeatability and wearability remain important challenges. This literature supports the development of a low-cost glucose monitoring system, although a prototype based on Arduino UNO should be considered a research/educational device rather than a clinically validated glucose monitor.
A comprehensive have review of wearable electrochemical glucose sensors described how electrochemical biosensors can provide real-time information about changing glucose concentrations. The study discussed enzymatic sensing, alternative body fluids and wearable sensor configurations. Electrochemical glucose sensors are particularly relevant because their electrical output can be acquired by a microcontroller after suitable signal conditioning. For the proposed Arduino UNO system, this approach provides a practical foundation for acquiring glucose-related sensor signals and displaying or transmitting the resulting data.
Zafar et al. (2022) have reviewed wearable sweat-glucose sensors for continuous glucose monitoring. Their work showed that sweat is attractive for wearable sensing because it can be collected non-invasively and can potentially support continuous measurements. However, sweat glucose concentration can be affected by sweat rate, environmental conditions and individual physiological differences. These observations are useful for the proposed paper because they indicate that a glucose sensor must be carefully calibrated and that readings obtained from non-invasive methods should not automatically be treated as equivalent to clinical blood-glucose measurements.
Mobashsher et al. (2022) have investigated non-invasive blood-glucose monitoring technologies based on near-infrared techniques. Their review discussed optical, transdermal and enzymatic methods, with particular attention to near-infrared spectroscopy and near-infrared photoplethysmography. The authors identified signal processing and machine-learning techniques as important for extracting glucose-related information from optical signals. This work is relevant to a smart biosensor because optical glucose estimation could potentially be combined with physiological sensing and processed electronically before wireless transmission.
A 2021 have review of continuous glucose monitoring systems examined the development of glucose sensors and the movement toward less-invasive and non-invasive monitoring. The study identified glucose sensing in sweat, tears, saliva and urine as important research directions. Continuous glucose monitoring can provide more information about glucose variation than occasional measurements. For the proposed paper, this literature supports the objective of creating a compact monitoring platform capable of collecting sensor information continuously and transmitting it to a remote display through Bluetooth.
A study on smart glucose monitoring have proposed a wearable system in which a glucose sensor, motion sensor and temperature sensor were controlled using an Arduino UNO and connected to a smartphone through Bluetooth. The sensor information was transmitted to a mobile device and subsequently to a database through wireless communication. This work is particularly relevant to the proposed paper because it demonstrates the feasibility of using Arduino UNO as a central data-acquisition controller and Bluetooth as the communication interface. It also shows how multiple physiological parameters can be incorporated into a connected healthcare system.
Sathya and Rajalakshmi (2023) have developed a non-invasive physiological monitoring system using IoT and the Blynk application. Their system was designed to measure heart rate, oxygen saturation, blood glucose and body temperature. A MAX30100 pulse-oximeter sensor was used for heart rate and SpOâ‚‚, while an infrared-based approach was investigated for glucose estimation. Arduino and NodeMCU were used for system integration. This study is highly relevant to the proposed paper because it demonstrates the concept of combining glucose and oxygen measurements in one multi-parameter monitoring platform.
Thapa et al. (2023) have developed an IoT-based health monitoring system using Arduino UNO, a MAX30100 pulse-oximeter sensor, LCD display and HC-05 Bluetooth module. The system was designed to monitor parameters including heart rate and oxygen saturation and to provide wireless health information. The work demonstrates that inexpensive embedded hardware can be used to construct a portable physiological monitoring prototype. For the proposed paper, the same architecture can be extended by adding an appropriate glucose-sensing subsystem and sending both glucose and SpOâ‚‚ information through Bluetooth.
Khan et al. have described an IoT-based health monitoring architecture using Arduino UNO, MAX30100, LM35 and an HC-05 Bluetooth module. The MAX30100 was employed for pulse rate and SpOâ‚‚ measurement, while the Arduino acted as an interface between the sensors and mobile application. This architecture is useful for the proposed design because it illustrates the separation of sensing, processing and wireless communication functions. The Arduino UNO can acquire sensor signals, calculate or organize physiological values and transfer the results to a Bluetooth-enabled smartphone.
Another IoT-based health-monitoring study have investigated the use of Arduino UNO, MAX30100 and HC-05 Bluetooth for monitoring oxygen saturation and pulse rate. The MAX30100 integrates optical components and signal-processing electronics for pulse oximetry. The study demonstrates the suitability of compact optical sensor modules for embedded health-monitoring applications. Such a sensor can serve as the oxygen-monitoring section of the proposed smart biosensor, while Arduino UNO can coordinate the oxygen and glucose data streams.
Research on Bluetooth-enabled pulse oximetry has demonstrated a low-cost architecture based on Arduino UNO, MAX30102 and HC-05 Bluetooth. The system used red and infrared light to obtain information related to blood oxygen saturation and transmitted the measurements wirelessly. This study is directly relevant to the proposed paper because it demonstrates the integration of an optical oxygen sensor with an Arduino-based controller and Bluetooth communication. The same communication architecture can be used to transmit multiple sensor parameters rather than oxygen saturation alone.
Current research on photoplethysmography explains that PPG sensors measure changes in blood volume using optical illumination and photodetection. PPG technology is widely used for pulse-rate and oxygen-saturation measurements. However, motion artifacts can affect the quality of the signal, particularly in wearable applications. This literature is important for the proposed oxygen-monitoring module because the Arduino system should use suitable signal filtering and stable sensor placement to obtain reliable SpOâ‚‚ readings.
A comprehensive have review of PPG in wearable devices discussed the optical principles behind pulse oximetry and identified factors that can influence SpOâ‚‚ accuracy. The ratio of AC and DC components of optical signals is important in oxygen-saturation estimation, while optical crosstalk, sensor geometry and skin-related effects can introduce errors. These findings indicate that simply connecting a MAX30100 or MAX30102 to an Arduino is not sufficient for highly accurate medical measurement. Appropriate sensor positioning, calibration and signal processing are necessary for a reliable prototype.
Dcosta et al. (2023) have reviewed flexible and wearable photoplethysmography sensors for SpOâ‚‚ monitoring. The study explained that pulse oximeters use different optical wavelengths to distinguish oxygenated and deoxygenated hemoglobin and estimate blood oxygen saturation. Flexible sensors can improve comfort and enable long-term monitoring. This research supports the oxygen-monitoring component of the proposed smart biosensor and suggests that future versions could replace rigid sensor modules with flexible wearable technologies.
A 2024 have study developed a wearable device and synchronized mobile application for real-time vital-sign monitoring. An Arduino Nano was used as the control unit, while a pulse-oximeter sensor measured SpOâ‚‚ and pulse information. An HM-10 Bluetooth Low Energy module transferred the data to a smartphone. This work demonstrates the practical value of wireless communication in wearable health monitoring and supports the proposed use of Bluetooth to send glucose and oxygen measurements from the embedded system to a mobile device.
Li et al. (2024) have developed a fully integrated wearable microneedle biosensing platform for real-time continuous glucose monitoring. The researchers used a three-dimensional glucose-oxidase-based sensing structure to improve glucose detection and electron transfer. Microneedles provide access to interstitial fluid while maintaining a wearable form factor. The study demonstrates the technological direction of continuous glucose monitoring, although such advanced microneedle technology is considerably more complex than an Arduino-based educational prototype.
A 2022 have study on a continuous glucose monitoring system based on a percutaneous microneedle array combined a glucose sensor, electronic circuit and wireless transmission module in a wearable device. The measured glucose information was transmitted to a mobile phone or computer for analysis. This research highlights the importance of integrating sensing and wireless communication into a single wearable platform. The proposed Arduino UNO paper follows a similar system-level concept but aims for a simpler and lower-cost implementation.
A 2019 have study introduced a fully integrated and self-powered smartwatch for continuous sweat-glucose monitoring. The system combined flexible photovoltaic cells, rechargeable energy storage, electrochemical glucose sensors, electronic circuits and a display into a wearable platform. The research demonstrated the potential of integrating energy management, sensing and display functions in a single device. For the proposed Arduino-based biosensor, this work provides a future direction toward miniaturization, low-power operation and wearable glucose monitoring.
Recent research has moved toward multimodal biosensors capable of simultaneously monitoring glucose and physiological signals. A 2026 study reported a flexible dual-functional sensor for real-time glucose monitoring and pulse-signal tracking, incorporating signal conditioning, a control chip, Bluetooth communication and power management. The study demonstrates the growing importance of combining biochemical and physiological sensing with wireless connectivity. This directly supports the concept of the proposed Smart Biosensor for Glucose and Oxygen Level Monitoring Using Arduino UNO and Bluetooth, where glucose sensing and optical SpOâ‚‚ sensing can be integrated into one low-cost embedded platform.
Conventional glucose monitoring requires a blood sample, which can cause discomfort and requires consumable materials. In addition, oxygen saturation and glucose measurements are generally performed using separate devices.The objective of this paper is to develop a low-cost, non-wearable prototype capable of: Measuring SpOâ‚‚ and heart rate using the MAX30102 sensor. Experimentally sensing optical changes associated with glucose using an IR LED and photodiode. Processing sensor signals using an Arduino Uno. Displaying the results on an OLED display. Providing abnormal-value alerts using a buzzer. Sending measured data to a smartphone through an HC-05 Bluetooth module.
The proposed system is designed as a desktop/portable educational prototype for biomedical sensing. The scope includes: Real-time SpOâ‚‚ monitoring. Heart-rate measurement. Experimental optical glucose estimation. OLED-based display of readings. Audible warning using a buzzer. Bluetooth transmission of data to a mobile phone. Development of a simple mobile interface for viewing the readings. Storage or graphical presentation of readings can be added as a future enhancement. The system is intended for academic demonstration and research purposes and not for clinical diagnosis.
PROPOSED SYSTEM:
The proposed system consists of an Arduino Uno, MAX30102 sensor, optical glucose-sensing circuit, OLED display, HC-05 Bluetooth module and buzzer. The MAX30102 detects optical signals from the fingertip and provides data for SpOâ‚‚ and heart-rate calculation. The experimental glucose-sensing section uses an infrared LED to illuminate the finger and aphotodiode to detect the resulting optical signal. An LM358 operational amplifier is used for signal conditioning. The Arduino Uno processes the sensor outputs and displays the parameters on the OLED. The HC-05 Bluetooth module sends the readings to a mobile phone. The buzzer is activated when predefined alert conditions are detected.
The overall concept follows the sensor-to-controller-to-display/wireless-monitoring approach used in the uploaded reference report, where an Arduino collects biological sensor information and provides monitoring functionality. The block diagram represents the complete operation of the Smart Biosensor for Glucose and Oxygen Level Monitoring using Arduino Uno and Bluetooth. The proposed Smart Biosensor for Glucose and Oxygen Level Monitoring using Arduino Uno and Bluetooth consists of several interconnected hardware blocks that work together to acquire, process, display, alert, and wirelessly transmit physiological information.
The system starts with the finger sensing unit, where the user's finger is placed over the optical sensors.The MAX30102 sensor uses red and infrared light to detect changes in blood absorption and provides the required data for measuring blood oxygen saturation (SpOâ‚‚) and heart rate. Along with this, the experimental glucose-sensing section consists of a 940 nm infrared LED, photodiode, and LM358 operational amplifier.
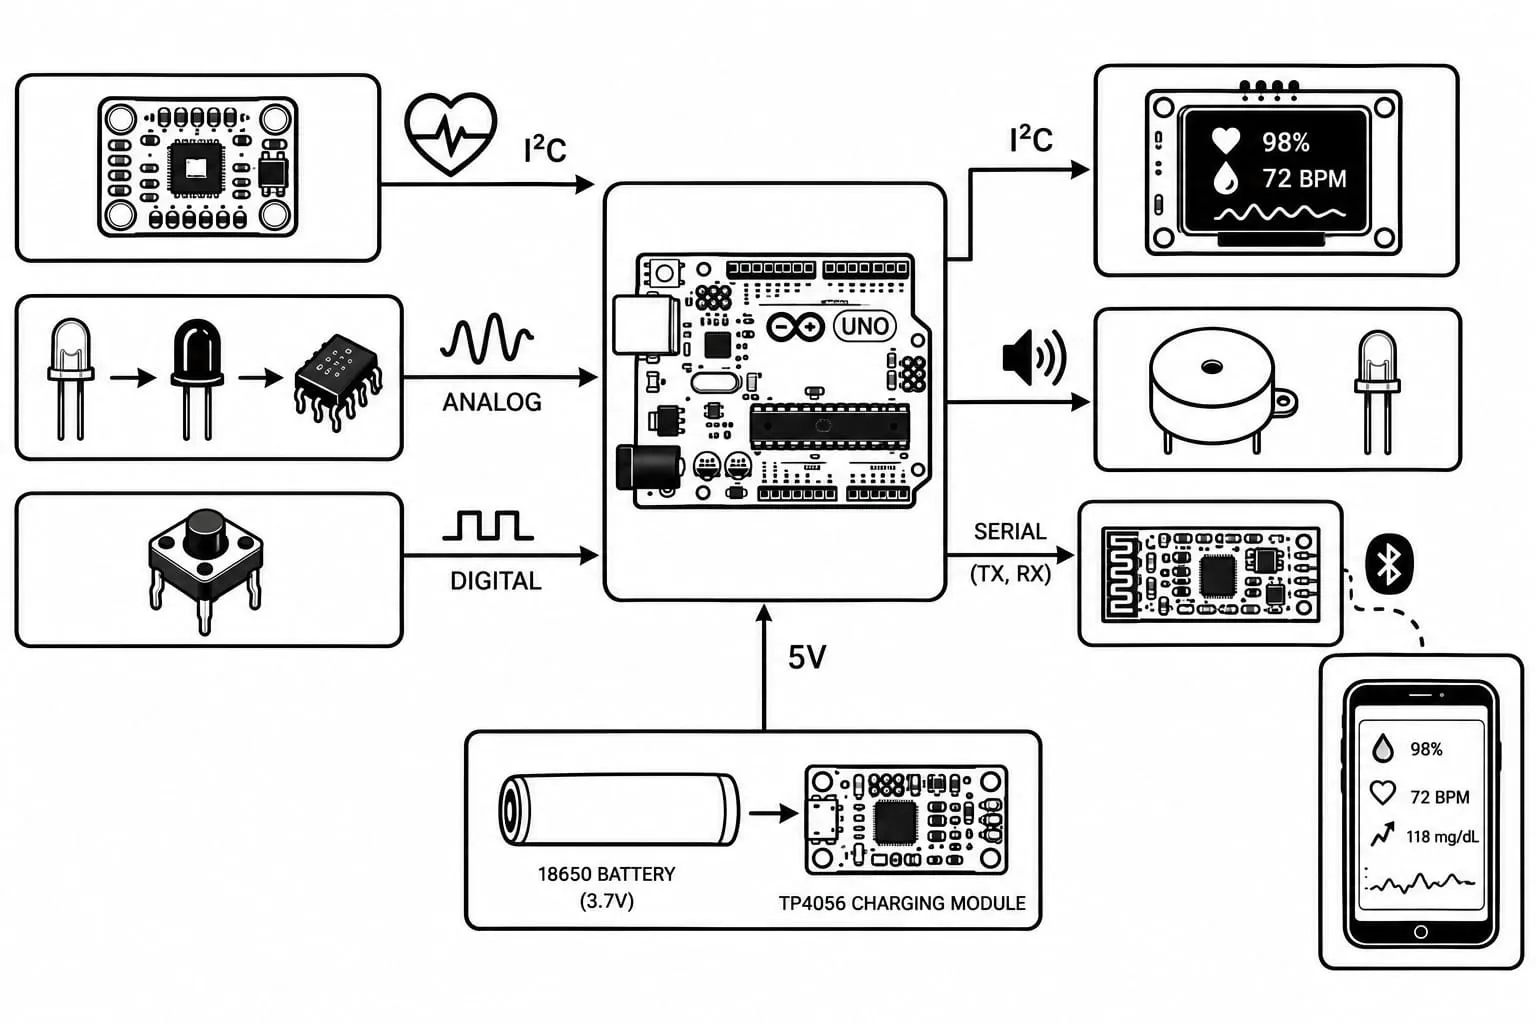
Figure 1: Block Diagram of the Glucose and SpO2 Level Monitoring
Figure 1. shows the block diagram. The IR LED illuminates the finger, while the photodiode detects the corresponding optical response. Since the photodiode produces a small electrical signal, the LM358 is used to amplify and condition the signal before it is supplied to the Arduino. The Arduino Uno acts as the central processing unit of the complete system. It receives the signals from the MAX30102 and the optical glucose-sensing circuit, processes the acquired data according to the programmed algorithm, and prepares the values for monitoring. The processed information is then sent to the 0.96-inch OLED display, where the user can view the SpOâ‚‚ level, heart rate, estimated glucose value, and system status in real time. A buzzer is connected to the Arduino to provide an audible warning whenever a programmed abnormal condition or sensor error is detected. For wireless monitoring, an HC-05 Bluetooth module is connected to the Arduino through serial communication. It transmits the processed readings to a Bluetooth-enabled mobile phone, where the user can view the measured parameters through a suitable mobile application. The system also includes a push button for starting or resetting the measurement and a power supply section consisting of a battery, charging module, and ON/OFF switch to provide electrical power to the circuit. Thus, the complete system follows the sequence finger sensing → signal acquisition → signal conditioning → Arduino processing → OLED display and buzzer alert → Bluetooth transmission → mobile monitoring. This integrated arrangement provides a low-cost, non-wearable educational prototype for studying biomedical sensors, embedded systems, optical sensing, signal processing, and wireless health-data monitoring. The glucose value produced by this prototype should be treated only as an experimental/estimated value and not as a clinically validated blood-glucose measurement.
The Arduino Uno is the main controller of the paper, and all the sensors and output devices are connected to it. The MAX30102 sensor is connected to the Arduino through the I²C communication interface. Its SDA pin is connected to A4 (SDA) and SCL is connected to A5 (SCL) of the Arduino Uno, while VCC and GND are connected to the appropriate power and ground lines. The OLED display also uses I²C communication, so its SDA and SCL lines are connected to the same A4 and A5 lines. This allows both the MAX30102 and OLED to communicate with the Arduino using the same I²C bus. The experimental glucose-sensing circuit consists of a 940 nm IR LED, photodiode, and LM358 amplifier. The IR LED is powered through a suitable current-limiting resistor and illuminates the finger. The photodiode detects the resulting optical signal, and the LM358 amplifies this weak signal. The amplified output of the LM358 is connected to an Arduino analog input, such as A0, where it can be sampled and processed. The HC-05 Bluetooth module is connected to the Arduino using serial communication. For a basic connection, the HC-05 TXD is connected to an Arduino digital RX pin and the Arduino TX signal is connected to the HC-05 RX pin through an appropriate voltage divider to protect the HC-05 input. The buzzer is connected to a digital output pin, such as D8, with its other terminal connected to GND; the Arduino activates it when an alert condition occurs. A push button is connected to another digital input, such as D7, and can be used to start or reset a measurement. Finally, all modules share a common ground, and the power supply provides the required voltage to the Arduino and peripheral circuits.
The proposed system consists of an Arduino Uno, MAX30102 sensor, IR LED, photodiode, LM358 amplifier, OLED display, HC-05 Bluetooth module, piezo buzzer, push button, and power supply. The Arduino Uno acts as the main controller and processes the signals received from the sensors. The MAX30102 sensor is used to detect SpOâ‚‚ and heart rate using red and infrared optical signals. The glucose sensing section consists of an IR LED, photodiode, and LM358 amplifier. The IR LED illuminates the finger, the photodiode detects the optical response, and the LM358 amplifies the weak signal before it is given to the Arduino through an analog input. The OLED display shows the measured SpOâ‚‚, heart rate, and experimental glucose value. The push button is used to start or reset the measurement process. The piezo buzzer provides an audio alert when a programmed threshold is exceeded. The HC-05 Bluetooth module sends the processed readings from the Arduino to a mobile phone for wireless monitoring. The system is powered using an 18650 battery with a TP4056 charging module. Overall, the hardware works together to sense the parameters, process the signals, display the results, provide an alert, and transmit the readings to a mobile phone. The glucose section is an experimental estimation system and is not intended for clinical diagnosis. Fig.3 Shows Hardware arrangement for the proposed prototype.
The system starts by initializing the Arduino Uno, MAX30102 sensor, glucose-sensing circuit, OLED display, buzzer, and HC-05 Bluetooth module. The MAX30102 collects the data required for SpOâ‚‚ and heart-rate monitoring, while the glucose-sensing circuit provides an analog signal for experimental glucose estimation. The Arduino reads and processes these sensor signals and displays the calculated values on the OLED screen. The program then checks the readings against the predefined limits. If an abnormal value is detected, the buzzer is activated to provide an alert. At the same time, the processed SpOâ‚‚, heart rate, and experimental glucose readings are transmitted through the HC-05 Bluetooth module to a mobile phone. After displaying and transmitting the data, the system repeats the process continuously for further monitoring.
RESULTS AND DISCUSSION:
The proposed biosensor system is expected to successfully detect and display SpOâ‚‚, heart rate, and experimental glucose values. During normal operation, the MAX30102 sensor should provide the SpOâ‚‚ and heart-rate readings, while the glucose-sensing circuit should produce an analog signal that is processed by the Arduino Uno. The OLED display is expected to show the measured values clearly. If the programmed threshold is exceeded, the piezo buzzer should produce an alert. The HC-05 Bluetooth module is expected to transmit the readings to a mobile phone for wireless monitoring. Overall, the prototype is expected to demonstrate the basic operation of a low-cost, non-wearable health-monitoring system. The glucose measurement is experimental and is not intended for medical diagnosis. Shows the glucose range.
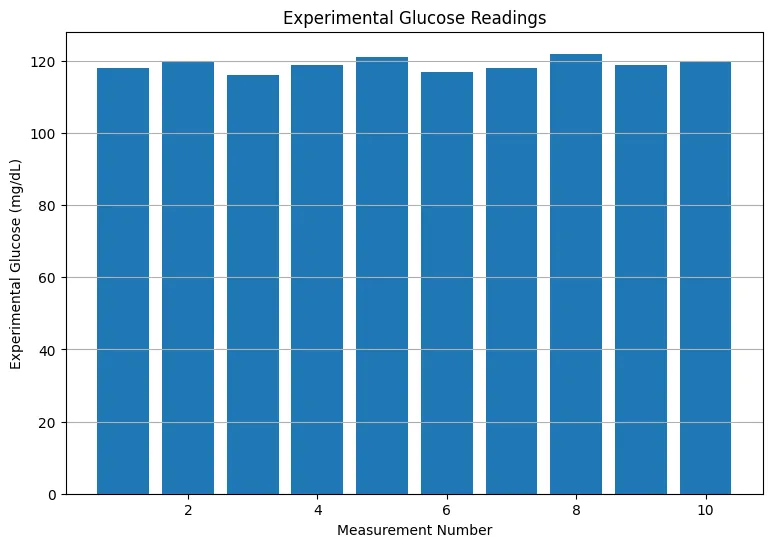
Figure 2: Glucose Range.
Figure 2. shows the glucose range. The given bar graph represents 10 experimental glucose readings measured in mg/dL. The graph is titled “Experimental Glucose Readings”, with the measurement number shown on the X-axis and experimental glucose level shown on the Y-axis. The readings are generally consistent and fall within a narrow range of approximately 116 to 122 mg/dL. The first measurement is around 118 mg/dL, while the second measurement is approximately 120 mg/dL. The third measurement records the lowest glucose value, at about 116 mg/dL. The fourth reading is nearly 119 mg/dL, and the fifth measurement is slightly higher at around 121 mg/dL. The sixth reading is approximately 117 mg/dL, followed by about 118 mg/dL in the seventh measurement. The eighth measurement has the highest reading, approximately 122 mg/dL. The ninth reading is around 119 mg/dL, while the tenth measurement is approximately 120 mg/dL. Overall, the graph shows that the experimental glucose values remain relatively stable throughout all ten measurements, with only minor variations. This indicates that the readings are closely grouped around 120 mg/dL, and there are no sudden or major changes between consecutive measurements.
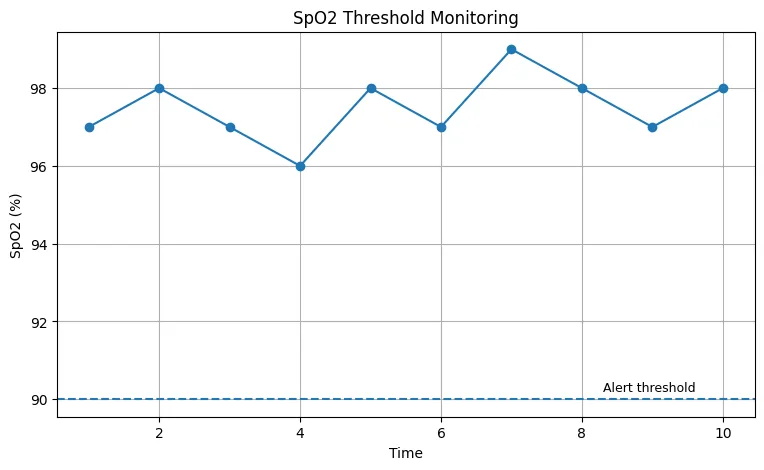
Figure 3: Threshold Monitoring.
Figure 3. shows the threshold monitoring. The given line graph represents SpOâ‚‚ (blood oxygen saturation) threshold monitoring over 10 different time measurements. The X-axis represents time, while the Y-axis shows SpOâ‚‚ percentage. The recorded SpOâ‚‚ values vary between approximately 96% and 99%. At the first time point, the reading is about 97%, increasing to 98% at the second point. It then decreases to 97% and reaches the lowest value of 96% at the fourth measurement. The value rises again to 98% at the fifth measurement and slightly decreases to 97% at the sixth. The highest reading, approximately 99%, occurs at the seventh measurement. After that, the value decreases to 98%, then 97%, and finally increases to 98% at the tenth measurement. The dashed horizontal line represents the alert threshold at 90%. All recorded SpOâ‚‚ values remain well above this threshold throughout the monitoring period, showing stable oxygen saturation during the measurements.
Low cost and easy to build using commonly available components. Non-wearable and simple system for basic health monitoring. Can monitor SpOâ‚‚ and heart rate using the MAX30102 sensor. Provides experimental glucose estimation using an optical sensing circuit. OLED display provides clear and immediate readings. Bluetooth communication allows the readings to be viewed on a mobile phone. Buzzer alert provides a warning when programmed limits are exceeded. The system is easy to modify and expand for future improvements.
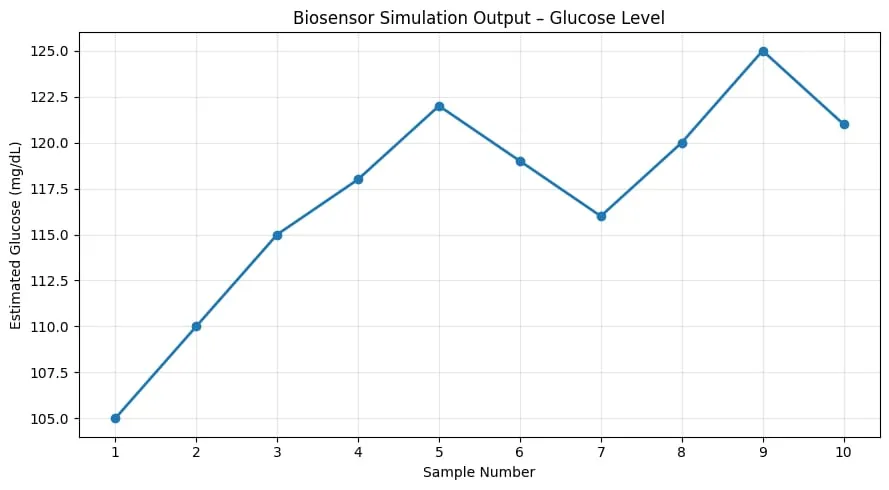
Figure 4: Biosensor Simulation Output
Figure 4. shows the Biosensor simulation output. The graph represents the simulation output of the biosensor for estimated glucose levels. The X-axis shows the sample number from 1 to 10, while the Y-axis shows the estimated glucose level in mg/dL. The readings vary from 105 mg/dL to 125 mg/dL, showing small changes between samples. The highest simulated value is 125 mg/dL at sample 9, and the lowest is 105 mg/dL at sample 1. This graph demonstrates how the Arduino Uno can process sensor signals and display changing glucose values. These values are simulation values only and are not medical measurements.
The proposed system has some limitations because it is developed as a low-cost educational prototype. The glucose measurement is only an experimental estimation and may not provide accurate results without proper calibration and validation. The sensor readings can also be affected by finger position, movement, ambient light, and sensor placement. The system requires suitable calibration to improve the reliability of the measurements. Bluetooth communication depends on the availability of a compatible mobile device and application. Therefore, the prototype is mainly intended for academic demonstration and learning purposes and should not be used for medical diagnosis or treatment.
CONCLUSION:
The proposed Smart Biosensor for Glucose and Oxygen Level Monitoring using Arduino Uno and Bluetooth provides a simple and low-cost approach for monitoring important health parameters. The system uses the MAX30102 sensor for SpOâ‚‚ and heart-rate monitoring, while the IR LED, photodiode, and LM358 circuit provide an experimental method for glucose estimation. The Arduino Uno processes the sensor signals and displays the readings on the OLED screen. The buzzer provides an alert when programmed limits are exceeded, and the HC-05 Bluetooth module allows the readings to be shared with a mobile phone. Overall, the paper demonstrates the practical application of biomedical sensors, Arduino programming, signal processing, display interfacing, and wireless communication. The prototype is suitable for academic and demonstration purposes, while the experimental glucose measurement requires further calibration, validation, and improvement before any medical application.
REFERENCES


Sivasubramanian A., Jothiswar B., Sudharsan S., Deepak Lara L., Smart Biosensor for Glucose and SPO2 Level Monitoring, Int. J. Sci. R. Tech., 2026, 3 (10), 652-662. https://doi.org/10.5281/zenodo.23278833
 10.5281/zenodo.23278833