

We use cookies to ensure our website works properly and to personalise your experience. Cookies policy
Department of Geology and Mineral Sciences, University of Ilorin, Ilorin, Nigeria.
Ditch cuttings of shale, siltstone and sandstone sediments penetrated by the offshore T-well in the Eastern Dahomey Basin, Southwestern Nigeria were studied to establish the stratigraphy and Hydrocarbon potential of the field. The Siltstones are at the base of the well and overlain by shales and sandstones at the top. The Total depth of the well is approximately 2400m. Twenty shale samples were selected from the well at intervals between 1088m to 2280m for organic geochemical study. Organic geochemical study through Rock-Eval Pyrolysis revealed the Total Organic Carbon (TOC) average 2.17wt%, Hydrogen Index (HI) average value of 329mgHC/gTOC, Source Potential (SP) mean value of 8.03mg HC/g rock and Tmax mean value of 4340C. The plot of Tmax (0C) against Hydrogen Index (mgHC/gTOC). The results suggest that the shale sediments fall mainly within oil and gas generation zone. The results suggest that the shale sediments have very good source rock potential to generate hydrocarbon with the predominance of oil, oil and gas, kerogen Types II and II-III and are marginally mature at the present stratigraphic level.
The Dahomey Basin is a very extensive sedimentary basin in the Gulf of Guinea which extends from the southeastern Ghana through Togo and Benin Republic on the west side to the Okitipupa ridge/Benin Hinge line on the east side in the southern part of Nigeria (Fig.1). The basin consists of sedimentary formations (Cretaceous – Tertiary) that outcrop in an arcuate belt roughly parallel to the coastline. The tertiary sedimets of the Dahomey Basin thin out to the east and are partially cut off from the sediments of the Niger Delta basin by the Okitipupa basement ridge. In general, rock ourcrops are poor due to the thick vegetation and soil cover making studies in the basin to depend largely on exploratory wells and boreholes. The geology of this basin has attracted a lot of interest especially in the recent years despite the challenges of securing rock samples for needed studies. (Haack et al., 2000; Adekeye and Samuel, 2007; Akande et al., 2012, Adekeye et al., 2019).
Fig. 1: Regional map of four countries showing the location of the Benin (Dahomey) Basin in the Gulf of Guinea (modified from Brownfield and Chapentier, 2006).
Fig. 2: Generalised regional stratigraphic setting of the eastern Dahomey Basin, Southwestern Nigeria. (Modified from Adekeye et al., 2019.)
The ditch cutting samples of T-well in the Eastern Dahomey basin were collected from an indigenous oil company in Nigeria. The lithostratigraphic units penetrated by the T-well were logged. It composed of basal units of Siltstone about 120m and in turn overlain by black shale to grey shale of over 348m thick which also overlain by Marly shale of about 286m thick, overlain by black shale of about 558m followed by shaly sandstone of about 588m and top of the lithology is sandstone of about 336m thick (Fig 3.). Organic geochemical analysis for Total Organic Carbon (TOC) and Rock-Eval Pyrolysis carried out at Weatherford Commercial Laboratories, Shenandoah, Texas, USA. The technique of Rock-Eval pyrolysis developed by Espitalie et al. (1984) was used on pulverized shales and carbonate samples to the elevated temperatures of about 6000C to determine their organic matter indices. These indices include Total Organic carbon (TOC), free or volatile Hydrocarbon (S1), cracked or pyrolysed hydrocarbon (S2), volatile carbondioxide (S3) and thermal maturity (T-max). Other parameters assessed include hydrogen, oxygen and production indices which are derivatives of S1, S2, and TOC.
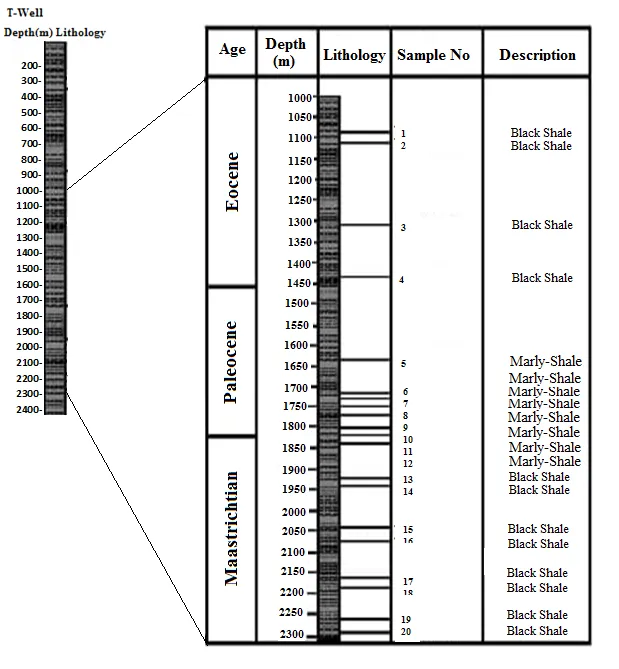
Fig 3: Lithosratigraphic Section of the Study T-well
Petroleum Source Rock Evaluation
|
Sample No |
Depth (m) |
TOC (wt%) |
S1 (mgHC/grock) |
S2 (mgHC/grock) |
S3 (mgCo2/grock) |
S2/S3
|
Tmax ( 0C) |
HI (mgHC/grock) |
OI (mgCo2/grock) |
PI |
S1+S2 (mgHC/grock) |
|
T1 |
1088 |
2.84 |
0.9 |
8.79 |
1.53 |
5.7 |
439 |
309 |
53 |
0.09 |
9.67 |
|
T2 |
1107 |
2.28 |
0.7 |
5.88 |
1.89 |
3.1 |
431 |
257 |
83 |
0.1 |
6.55 |
|
T3 |
1317 |
2.91 |
0.9 |
10.4 |
1.41 |
7.4 |
432 |
358 |
48 |
0.08 |
11.35 |
|
T4 |
1445 |
2.09 |
0.8 |
7 |
1.26 |
5.5 |
434 |
334 |
60 |
0.1 |
7.76 |
|
T5 |
1646 |
1.24 |
0.9 |
3.15 |
0.9 |
3.5 |
435 |
253 |
72 |
0.22 |
4.06 |
|
T6 |
1732 |
1.55 |
0.7 |
4.7 |
0.92 |
5.2 |
437 |
303 |
58 |
0.14 |
5.44 |
|
T7 |
1738 |
1.72 |
0.7 |
5.08 |
0.98 |
5.1 |
430 |
296 |
57 |
0.12 |
6.06 |
|
T8 |
1750 |
1.96 |
0.8 |
5.98 |
1.04 |
5.8 |
434 |
306 |
53 |
0.12 |
6.8 |
|
T9 |
1768 |
2.43 |
0.7 |
7.77 |
1.19 |
6.5 |
432 |
320 |
48 |
0.08 |
8.45 |
|
T10 |
1810 |
2.2 |
0.9 |
6.82 |
1.02 |
6.7 |
431 |
310 |
46 |
0.12 |
7.73 |
|
T11 |
1817 |
2.78 |
0.6 |
9.21 |
1.2 |
7.8 |
430 |
331 |
43 |
0.06 |
9.8 |
|
T12 |
1832 |
2.87 |
0.6 |
10.6 |
1.07 |
9.9 |
431 |
368 |
37 |
0.06 |
11.26 |
|
T13 |
1932 |
2.48 |
0.5 |
8.11 |
1.14 |
5.8 |
433 |
327 |
56 |
0.06 |
8.63 |
|
T14 |
1945 |
2.48 |
0.5 |
8.43 |
1.39 |
6.1 |
436 |
339 |
55 |
0.06 |
8.93 |
|
T15 |
2048 |
3.49 |
0.5 |
16.5 |
1.16 |
14.2 |
430 |
473 |
33 |
0.03 |
17 |
|
T16 |
2060 |
3.32 |
0.4 |
14.7 |
1.12 |
13.1 |
427 |
442 |
33 |
0.02 |
15.03 |
|
T17 |
2164 |
1.51 |
0.3 |
4.58 |
1.38 |
3.3 |
439 |
303 |
91 |
0.06 |
4.86 |
|
T18 |
2176 |
1.53 |
0.4 |
4.5 |
1.52 |
3 |
440 |
293 |
99 |
0.07 |
4.86 |
|
T19 |
2268 |
0.89 |
0.3 |
2.92 |
1.12 |
2.6 |
438 |
329 |
126 |
0.09 |
3.19 |
|
T20 |
2280 |
0.86 |
0.3 |
2.89 |
1.2 |
2.4 |
435 |
336 |
139 |
0.09 |
3.19 |
Table 1 : Rock-Eval data of the shale samples from T-well, Dahomey Basin.
The various parameters for evaluating the petroleum source rock potential are;
Total Organic Carbon (TOC)
Total Organic Carbon (TOC in wt. %) describes the quantity of organic carbon in a source rock. It is commonly used for the interpretation of hydrocarbon generating potential of a rock base on the semi-quantitative scale, Tissot and Welte, (1984), Peters, (1986, Jarvie (1991), Peter and Cassa, (1994). Some organic matter will generate oil, some will generate gas, and some may be inert Tissot et al. (1974). Therefore TOC is not sufficient for petroleum potential estimation, because it includes “dead carbon” incapable of generating petroleum. e.g graphite which is essentially 100% carbon will not generate petroleum. Nevertheless good source rock must have a high TOC that has to be associated with hydrogen to generate adequate quantities of hydrocarbons. The TOC content of the samples in T-well have values ranging from 0.86wt% to 3.49wt% with an average TOC value of 2.17wt% (Table 1). Compare to the work of Akande et al. (2012), which reported the TOC value of Afowo Formation (Cenomanian-Turonian) of an average of 1.07wt% and Adekeye et al. (2016) with TOC value of Afowo-Araromi Formation (Cenomanian-Coniacian) of an average of 1.81wt% and in this present work the TOC average value is 2.17wt% which is greater than the previous works signify the increase in trend of specie assemblages upward and high diversity and abundant of microfauna species at the interval of Maastrichtian-Eocene of the T-well. Most of the samples having TOC values in such level of organic richness are considered as very good source rock for hydrocarbon generation ( Peters and Cassa, 1994). The samples (T1-T10) have TOC values ranging from 0.86wt% to 3.49wt% with an average TOC value of 2.22wt% indicating very good quality for hydrocarbon generation. The samples (T11-T17) have TOC values ranging from 2.09w% to 2.43wt% with an average TOC value of 1.58wt% indicating good quality for hydrocarbon generation. The samples (T18-T20) have TOC values ranging from 2.28wt% to 2.91wt% with an average TOC value of 2.67wt% indicating very good quality for hydrocarbon generation. According to Tissot and Welte, 1978 TOC values >0.5wt% is the minimum threshold value for hydrocarbon generation in siliciclastic rocks. The TOC values of the T-well suggests that the shales have adequate organic matter constituents for hydrocarbon generation. Fig 4. shows the plot of remaining hydrocarbon potential versus TOC and from the figure, only the maastrichtian sediments have lean organic contents. The plot shows the kerogen quality of the sediments as they fall in kerogen Types II and II/III. Source rock potential assessment using TOC indicates generally good to very good amount of organic matter richness. It is noted that the dispersed organic matter in the source rock facies is composed mainly of Types II and II/III kerogen which are capable of generating oil and gas.
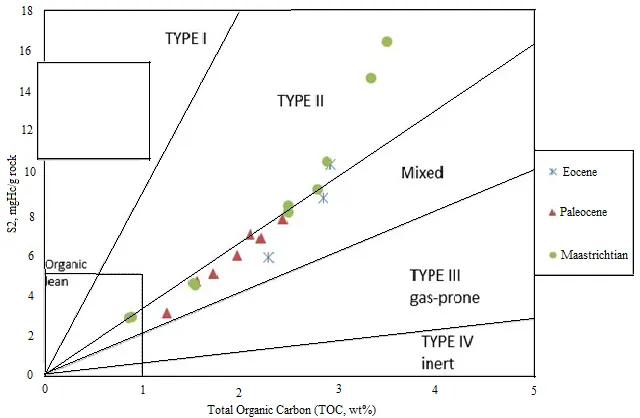
Fig. 4: Plot of Remaining Hydrocarbon Potential against Total Organic Carbon
Source Potential (SP)
The source potential is calculated from the addition of S1 + S2 values and is measure of the genetic potential of the rock. The genetic potential represents the amount of petroleum (oil and gas) that the kerogen is able to generate, if it is subjected to an adequate temperature during a sufficient interval of time, Tissot and Welte, (1984). This potential yield depends on the nature and abundance of kerogen, which in turn are related to the original input at the time of sediment deposition, and to the conditions of microbial degradation and rearrangement of the organic matter in the younger sediments. Dymann et al. (1996) gave standard for SP qualities. From T-well, the source potential (SP) values range from 3.19mg HC/g – 17.0mg HC/g and mean value of 8.03mg HC/g indicating good to excellent source potential.The work of Akande et al. (2012), indicate 5.41mgHC/g and Adekeye et al. (2016), indicate also 6.34mgHC/g of source potential while the SP for this study is 8.03mgHC/g signify more good source for hydrocarbon potential than the previous works but also noted that, the previous works indicate good to excellent source potential for hydrocarbon generation based on the standard values. The samples (T1-T10) have values range from 3.19mg HC/g – 17.0mg HC/g and mean value of 8.67mg HC/g indicating good to excellent source potential. The samples (T11-T17) have values range from 4.06mg HC/g – 8.45mg HC/g and mean value of 6.61mg HC/g indicating good to excellent source potential. The samples (T18-T20) have values range from 6.55mg HC/g – 11.35mg HC/g and mean value of 9.19mg HC/g indicate good to excellent source potential. Using the standard of Dymann et al., 1996 the SP values suggest that shale sediments in the T-well can serve as source rock which have good to excellent source rock quality to generate oil and gas. Tissot & Welte, 1984 proposed a genetic potential (SP=S1+S2) for the classification of source rocks. According to their classification scheme, rocks having SP of less than 2mgHC/g rock correspond to gas-prone rocks or non-generative ones, rocks with SP between 2mgHC/g and 6mgHC/g rock are moderate source rocks, and those with SP greater than 6mgHC/g rocks are good source rocks.
Hydrogen Index (HI)
Hydrogen Index (HI= [100 x S2]/ TOC, mg HC/gTOC), is a parameter used to characterize the origin and type of organic matter. Marine organism and algae, in general, are composed of lipid-rich and protein-rich organic matter, where the ratio of H:C is higher than in the carbonhydrate-rich constituents of the land plants. Significant HI values typically range from ~100 to 600 in geological samples. HI and H/C are proportional to the amount of hydrogen in the kerogen and thus indicate the potential of the rock to generate oil, Peter and Cassa (1994) and Dembicki (2009). Gas prone coals and coaly rocks can give anomalously high HI values that could be confirmed by elemental analysis Peters (1986).
The type of hydrocarbons a source rock can generate is dependent on the type of its kerogen constituents. Kerogen have been classified into four types based on their hydrogen indices, Tissot et al. (1974). Peter and Cassa (1994) and Dembicki (2009) among others. Type I consists of high initial H/C or HI greater 600 mgHC/gTOC and low initial O/C atomic ratios, derived primarily from algal material deposited mainly in lacustrine environments that produces mainly waxy oil; Type II, moderately high H/C or 300-600 mgHC/gTOC and moderate O/C atomic ratios derived from autochthonous organic matter deposited under reducing conditions in marine environments that produce mainly naphthenic oil; Type III, low initial H/C or 50-200 mgHC/gTOC and high O/C atomic ratios derived from terrestrial plant debris and/or aquatic organic matter are deposited in oxidizing environment that produces mainly gas; and Type IV is a product of severe oxidation of organic matter in the deposition environment with less than 50 mgHC/gTOC and is essentially inert with no hydrocarbon generating potential. In the T-well the HI values of the shale samples analysed generally exceed 250mgHC/gTOC. The values range from 253-473mgHC/gTOC (Table 5.1) with an average value of 329mgHC/gTOC indicating oil and gas prone Type II kerogen. The samples (T1-T10) have higher HI values (293-473mgHC/gTOC) with an average value of 354mgHC/gTOC indicating the potential to generate oil and gas Type II kerogen. The samples (T11-T17) have HI values range from 253-334mgHC/gTOC with an average value of 303mgHC/gTOC indicating the potential to generate oil and gas Type II kerogen. The samples (T18-T20) have HI values range from 257-358mgHC/gTOC with an average value of 308mgHC/gTOC indicating potential to generate oil and gas Type II kerogen. (Fig 5.).
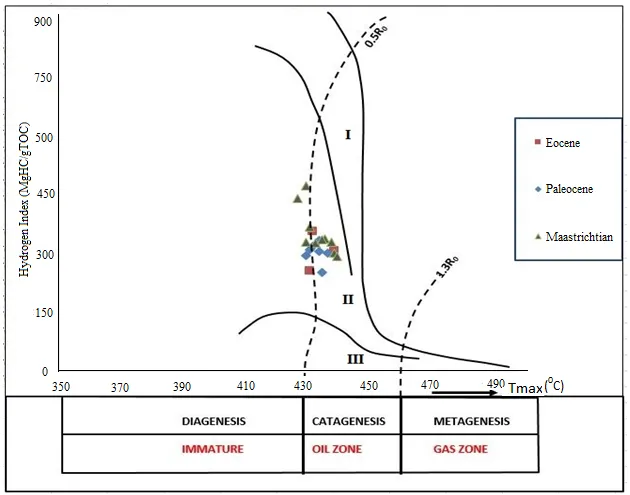
Fig 5: The plot of Hydrogen Index (mgHC/gTOC) against Tmax (0C) to show the stages of hydrocarbon Formation.
Thermal Maturity (T-Max 0C)
Thermal maturity describes the extent of heat driven reactions which convert organic matter in sedimentary rocks into petroleum. Depending on the relation to the oil generative window, organic matter can be described as immature, mature or post mature. The Tmax values represent the temperature at which the largest amount of hydrocarbons can be produced in the laboratory when a whole rock sample undergoes a pyrolysis treatment. Fig. 6 & 7. show the stages of hydrocarbon formation and kerogen types. Tmax values correlates directly with vitrinite reflectance values and can be used to depict the maturity of the organic matter. The thermal maturity process can be divided into diagenetic, catagenetic and metagenetic stages which represents the transformation of the organic matter as temperature and pressure increases with burial. Peters and Cassa, 1994 gave a standard of range of Tmax values and their respective implication to maturity. In the T-well the Tmax values range from 4270C – 4400C with mean value of 4340C this indicates marginally maturity. The samples (T1-T10) have Tmax values range from 4270C – 4400C with an average value of 4340C indicates marginally maturity. The samples (T11-T17) have Tmax values range from 4300C – 4370C with an average value of 4330C, this indicates marginally mature stage of kerogen maturation. The samples (T18-T20) have Tmax values range from 4310C – 4390C with an average value of 4340C indicates also marginally maturity. However, Maastrichtian, Paleocene and Eocene sediments are all marginally mature this indicate they have fair potential to generate oil and gas.
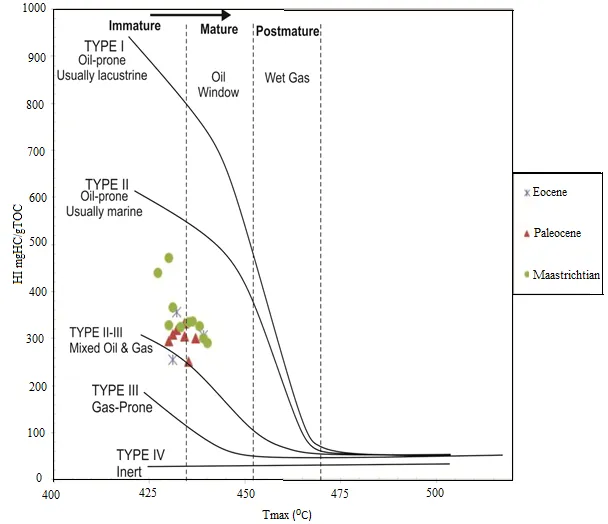
Fig.6 : The plot of Hydrogen Index (mgHC/gTOC) against Tmax(0C) to show stages of hydrocarbon formation and kerogen types.
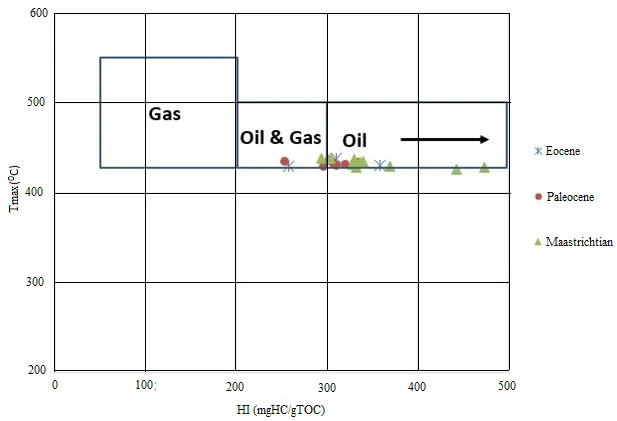
Fig 7: Plot of Tmax(0C) against Hydrogen Index (mgHC/gTOC) (after Petters, 1986).
Production Index
The ratio of already generated hydrocarbon to potential hydrocarbon can be derived from the Rock-Eval pyrolysis (Peters and Cassa, 1994). This often refers to as production index (PI). PI ratios could indicate the level of maturity of the organic matter. Early and peak maturity stages correspond to PI values of between 0.10 to 0.15 and 0.25 to 0.40 respectively. PI values greater than 0.4 indicate the late maturity stage. It is usually derived by calculating (S1/S1+S2). Results from the T-well reveals that their organic matter are essentially immature, having PI values which range generally between 0.02 – 0.22. The mean value is 0.08 therefore it can inferred that the organic matter are at their immature to early mature stage. The samples (T1-T10) have PI values range from 0.02 – 0.09 with an average value of 0.06 indicates that the organic matter is immature to early maturity. The samples (T11-T17) have PI values range from 0.08 – 0.22 with an average value of 0.13, this indicates that the organic matter is at early stage of maturity. Therefore the samples (T18-T20) have PI values range from 0.08-0.1 with an average value of 0.09 indicates that the organic matter is immature to early maturity. Fig. 8 shows the rate of Production Index with maturation.
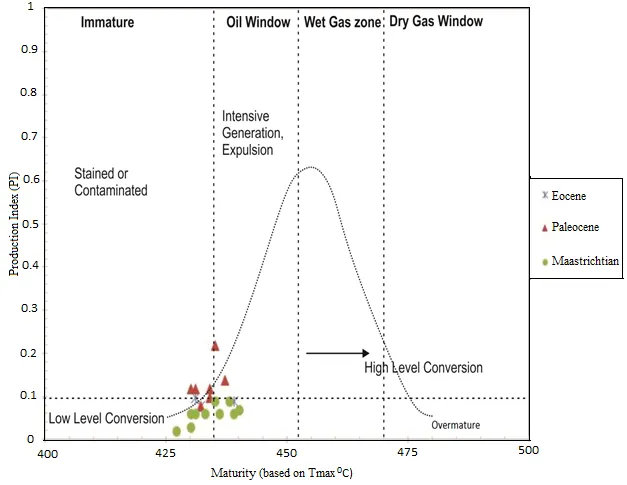
Fig.8 : Plot of Production Index (PI) against Maturity showing kerogen conversion to maturity.
Kerogen Types
The kerogen type classification gives an idea of the maceral constituents of the kerogen, which can provide direct information of their organic matter source and also useful in the determination of the hydrocarbon type likely to be generated. The plot of Hydrogen Index(HI) versus Tmax is very important in organic source rock evaluation, as they offer information on the dominant kerogen type and also an appropriate idea of the maturation level. The kerogen found in the sediments are essentially Types II and II/III. The plot shown in Fig.5.5 shows that majority of the shales are oil prone and oil and gas prone. The HI values in Table 5.1 shows that T-well shales have kerogen types II and II/III.
S2/S3
The ratio of the S2 to S3 is another good chemical parameters for source rock evaluation of shales. Comparing the ratio of S2 (Hydrocarbon generated by pyrolysis of the kerogen) to S3 (trapped CO2) also provides information about the type of organic matter present in the source rock. If the type of kerogen is known, the S2/S3 ratio can be used to determine what product is likely to be expelled from the rock during peak maturity (Peters and Cassa, 1994). Results from the study T-well shows that the shale samples have an S2/S3 ratio which range from 3.0-14.2 which indicate potential to generate oil and gas at peak of maturity.
CONCLUSION
The T-well penetrated siltstone, shale and sandstone sediments in the field, Eastern Dahomey basin, Southwestern Nigeria. The well was logged, measured and sampled. The total depth of the well is approximately 2400m. The base of the well is mainly siltstone which is overlain by dark shale and marl shale respectively and sandstone at the top. Twenty shale samples were selected between the interval of 1088m and 2280m for organic geochemical analysis to assess the hydrocarbon potential of the sediments. Organic geochemical study revealed the Total Organic Carbon (TOC) values range from 0.86wt% to 3.49wt% with an average TOC value of 2.17wt%, Hydrogen Index (HI) values range from 253 - 473mgHC/gTOC with an average value of 329mgHC/gTOC, Source Potential (SP) values range from 3.19mg HC/g – 17.0mg HC/g and mean value of 8.03mg HC/g rock and Tmax values range from 4270C – 4400C with mean value of 4340C. The plot of Tmax (0C) against Hydrogen Index (mgHC/gTOC) shows that the shale sediments fall mainly within oil and gas zones. The plot of remaining hydrocarbon potential (S2 mgHC/g rock) against Total Organic Carbon (TOC wt%), the results suggest that the shale sediments have very good source rock potential to generate hydrocarbon with the predominance of oil, oil and gas, kerogen Types II and II-III and are marginally mature at the present stratigraphic level.
ACKNOWLEDGEMENT
The authors are grateful to the indigenous oil company for providing the core samples. We also acknowledge the Weatherford Commercial Laboratories, Shenandoah, Texas, USA.,for the Rock Eval analysis and the Departrment of Geology and mineral Sciences, University of ilorin laboratory staff for the support in the course of this project.
REFERENCES

Afolami- Akerekan Joshua Olalekan, Adekeye Olabisi Adeleye, Akande Samuel Olusegun, Source Rock Thermal Maturity And Hydrocarbon Potential Of Upper Cretaceous-Lower Tertiary Succession Of T-Well, Eastern Dahomey Basin, South Western Nigeria, Int. J. Sci. R. Tech., 2026, 3 (9), 1-10. https://doi.org/10.5281/zenodo.22230236
 10.5281/zenodo.22230236